The App Insights page provides detailed analytics with various metrics and breakdowns, allowing users to track how well their apps are performing. You can analyze the app activity across specific date ranges, compare metrics, and drill down into trends.
Accessing App Performance Metrics
- In the My Workspace, click on Insights in the upper right-hand corner of the page.
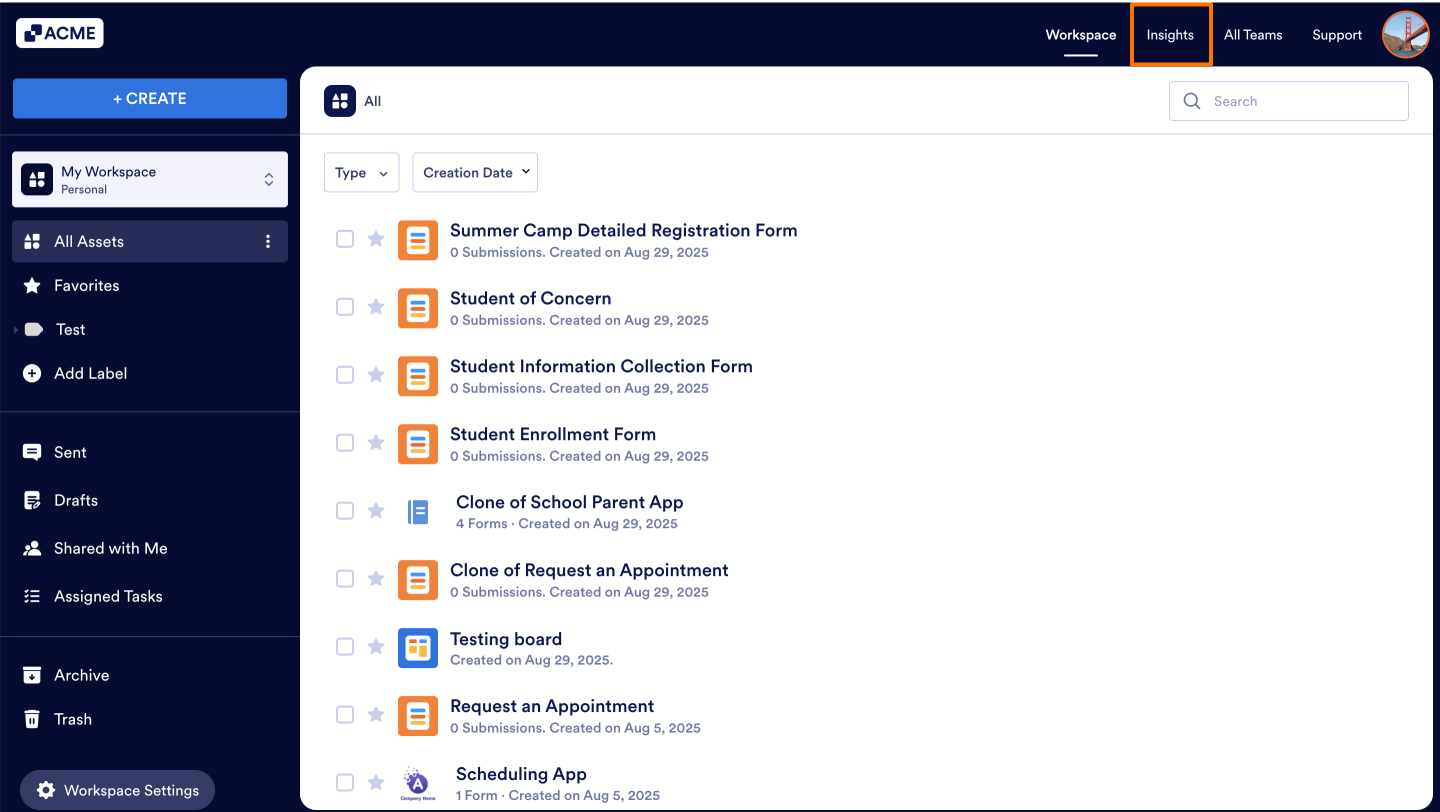
- In the Insights page and click on Apps from the menu on the left.
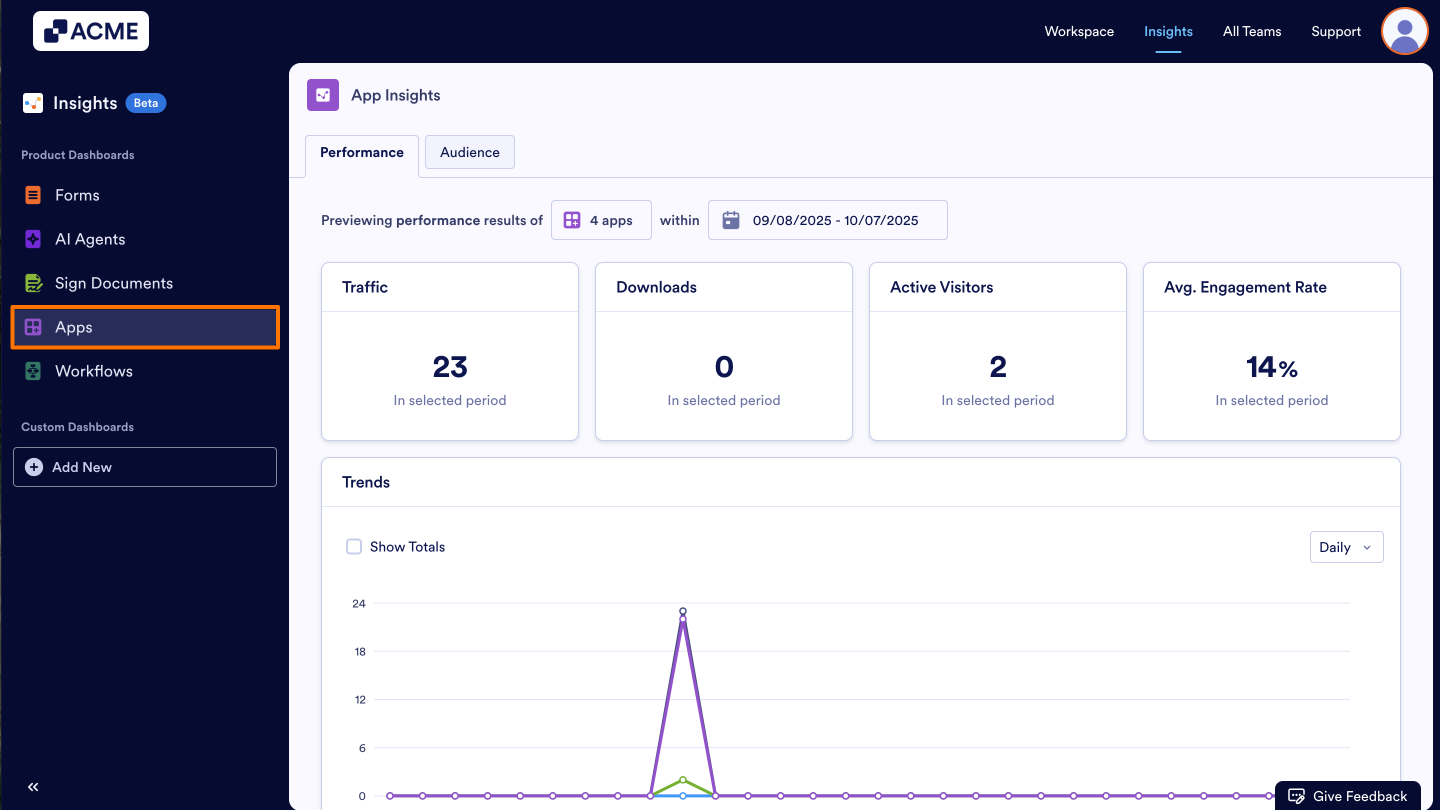
- Under the Apps Insights, click on the Performance tab.

What metrics do we provide?
On this page, you can view key performance metrics for your selected apps, including traffic, downloads, active visitors, and average engagement rate. Below is a detailed explanation of each metric:
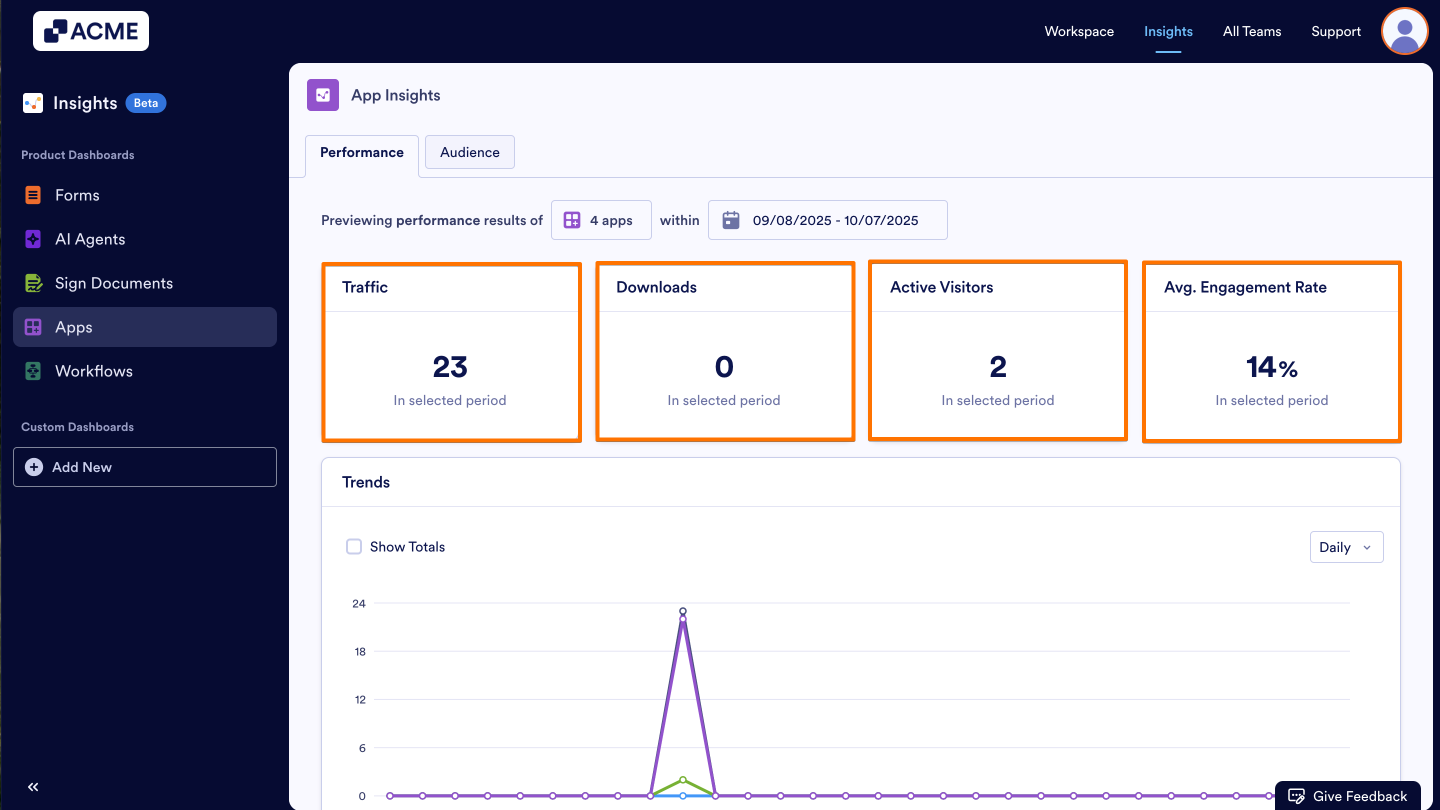
- Traffic: The total number of views your apps have received inside and outside your organization within a selected date range.
- Downloads: The total number of times your app has been downloaded within a selected date range.
- Active Visitors: The total number of active app users who have interacted with your app at least once, within a selected date range.
- Average Engagement Rate: The percentage of app visitors who took at least one action out of all visitors.
Trends
You can view the information mentioned above in the Trends chart by selecting the metrics you’d like to see and choosing the display type—daily, weekly, monthly, or yearly.
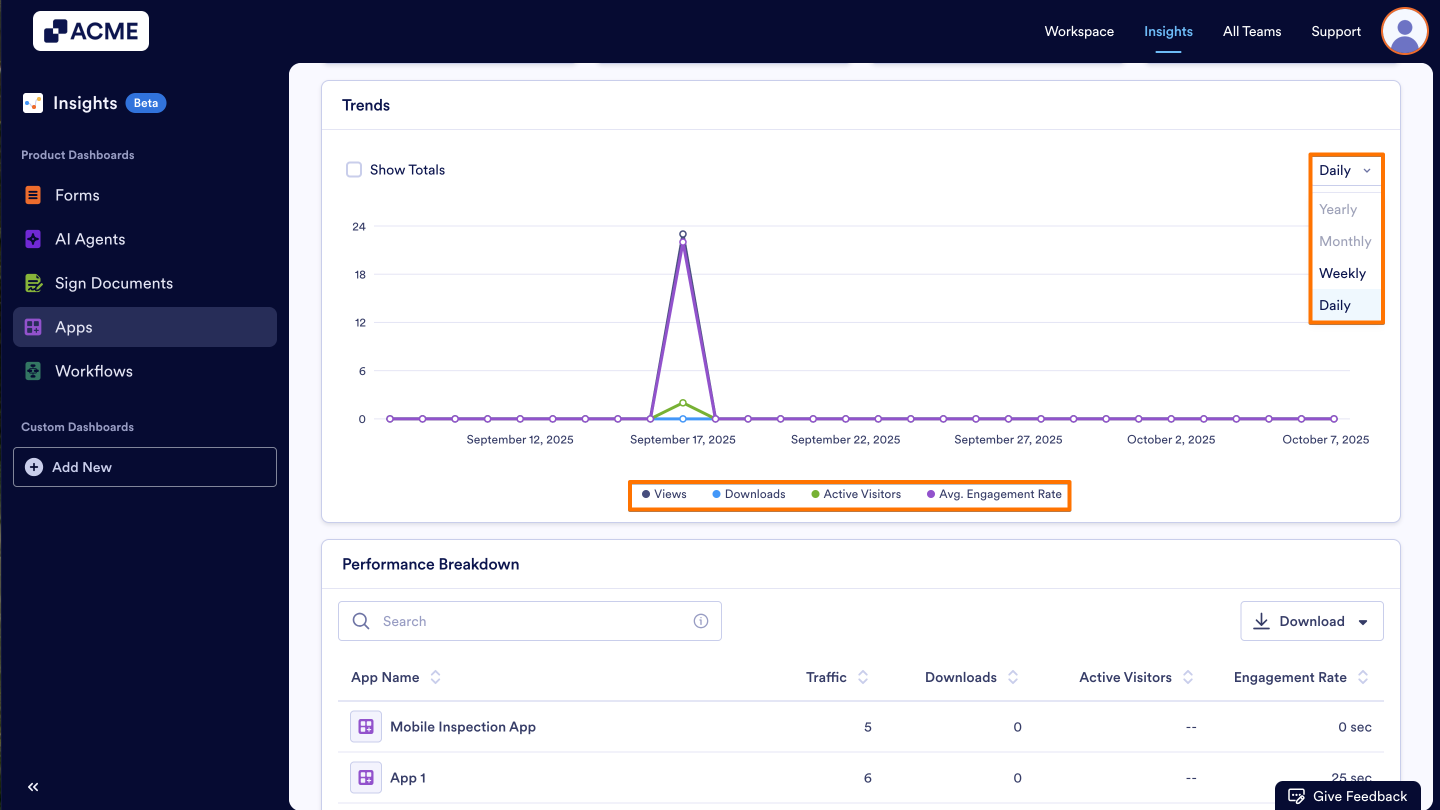
- Add/Remove Metrics: Click on the metric name at the bottom of the chart to add or remove it from the chart.
- Changing the Time Interval: Click on the drop-down menu at the top of the chart and select daily, weekly, monthly, or yearly.
- Depending on the date range you’ve selected, some options might not be available. For example, if your date range for the tab is set to last seven days, you won’t be able to select monthly or yearly.
Performance Breakdown
Need an even more detailed overview for each App? Within the performance breakdown list, you can view all apps in the selected date range along with their individual metrics. These metrics include: Traffic, Downloads, Active Visitors, and Average Engagement Rate.
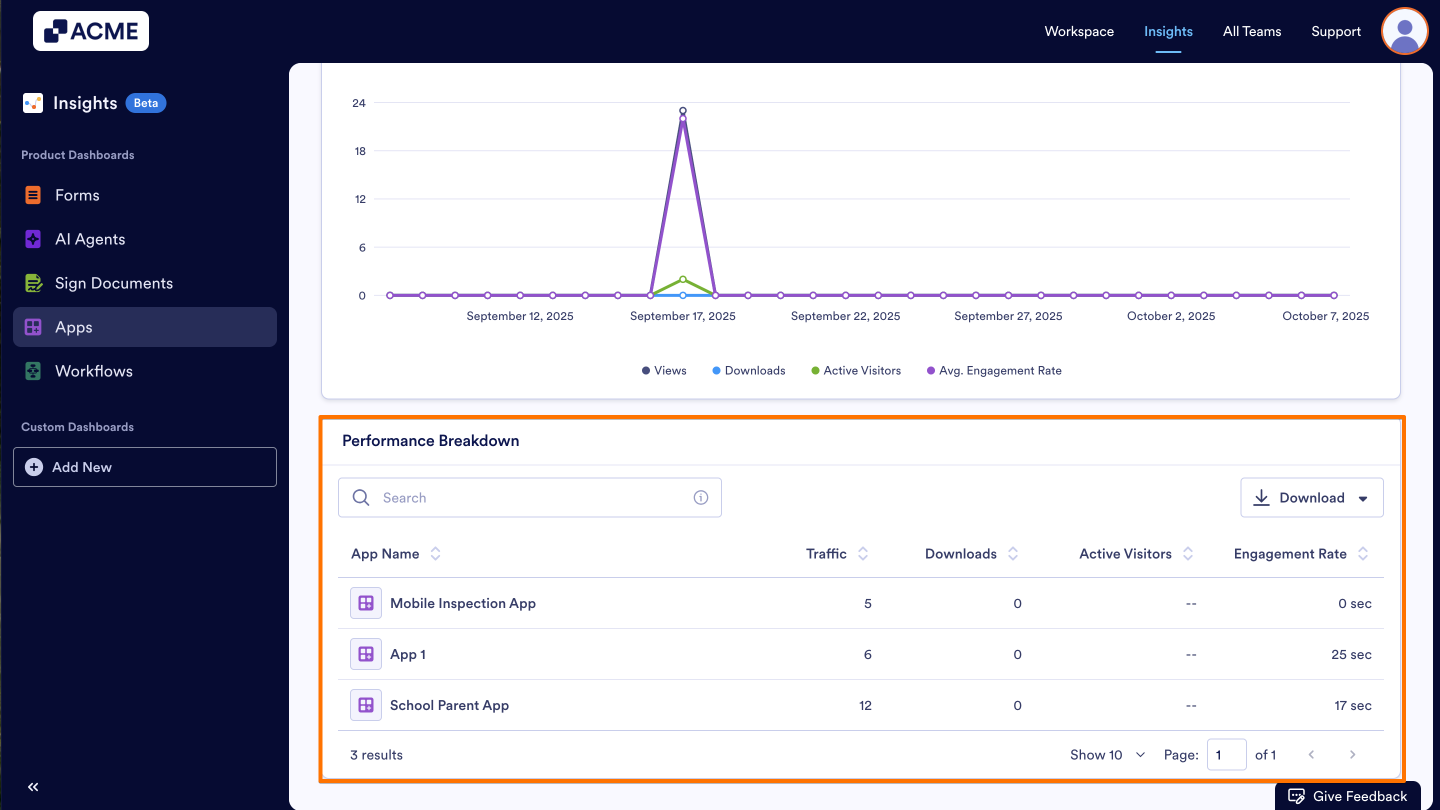
- These metrics are per app, and are specific to the date range selected at the top of the page.
- You can download the entire list by clicking the Download button on the right and saving it as a CSV or Excel file.
See also:
How to filter App Metrics in a specific date range in Insights?

Send Comment: