This guide explains how to access and interpret board performance metrics in Insight. The Board Insights page provides detailed analytics with various metrics and breakdowns, allowing users to track board activity across specific date ranges, compare key metrics, and explore trends. By using these insights, users can evaluate performance, measure progress, and make more informed decisions to improve overall Boards efficiency.


Accessing Board Performance Metrics
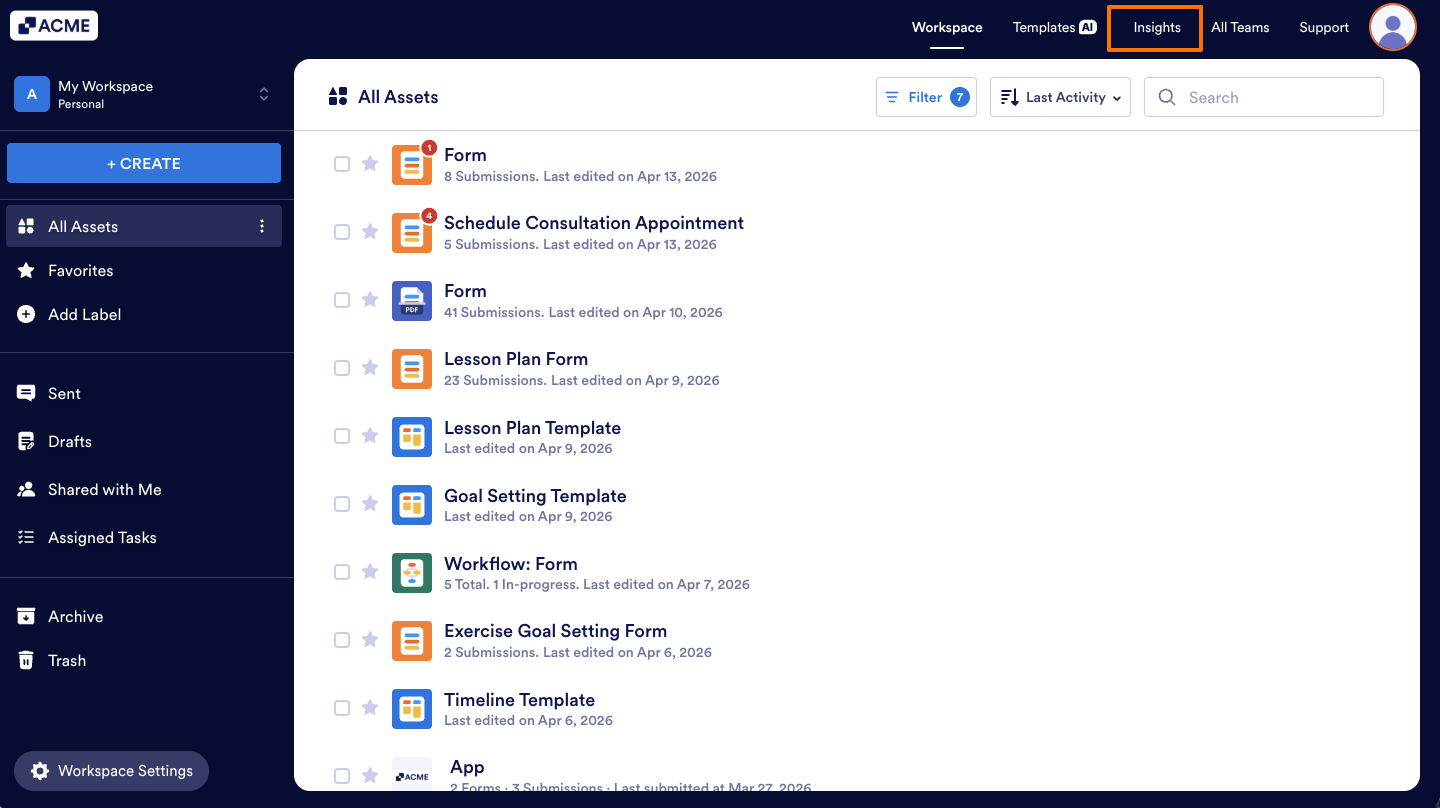
- In the My Workspace page, on the upper right side of the page, click on Insights.
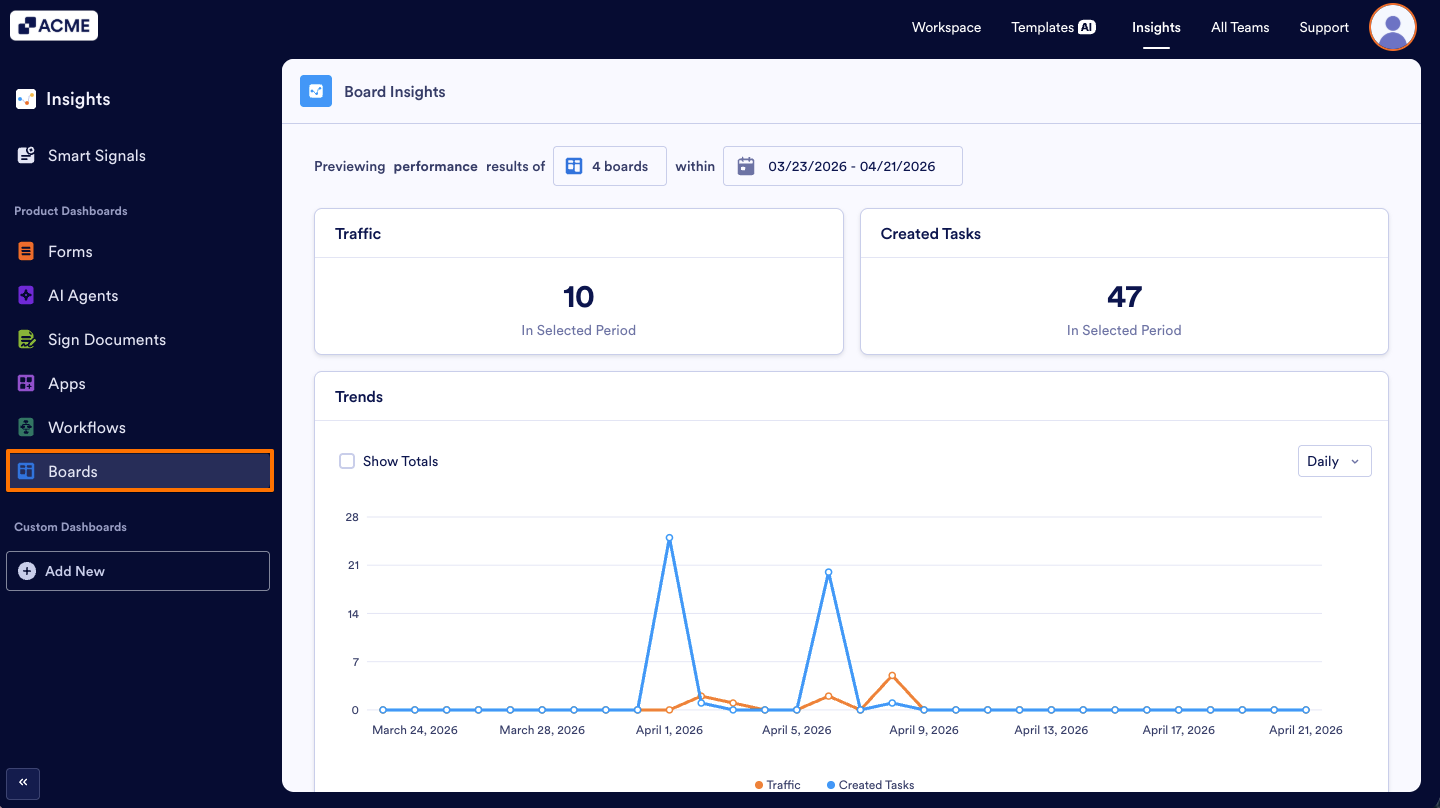
- Next, from the left sidebar, select Boards.
Changing Board and Date Range Filters
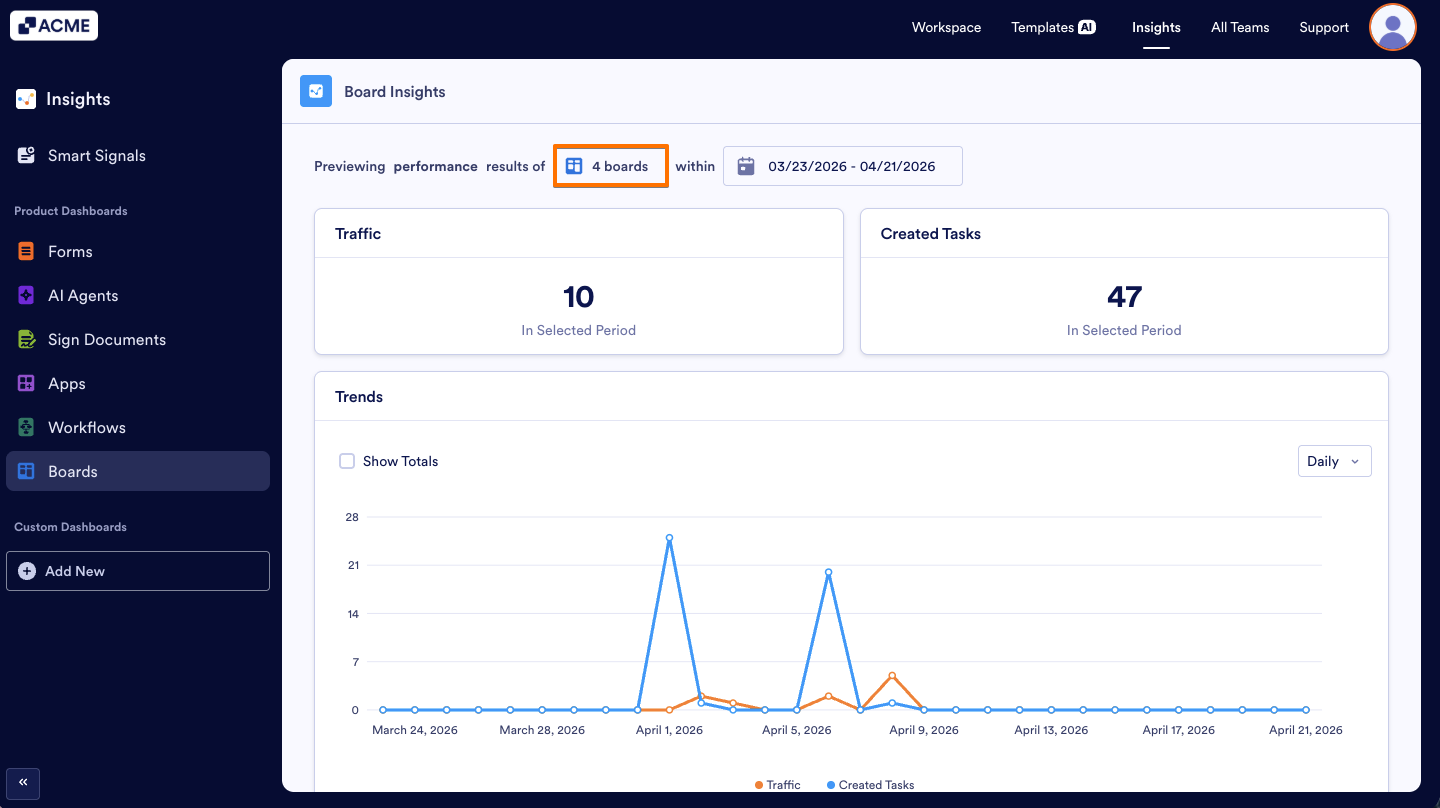
- In the Board Insights page, click the Boards selector at the top of the page.
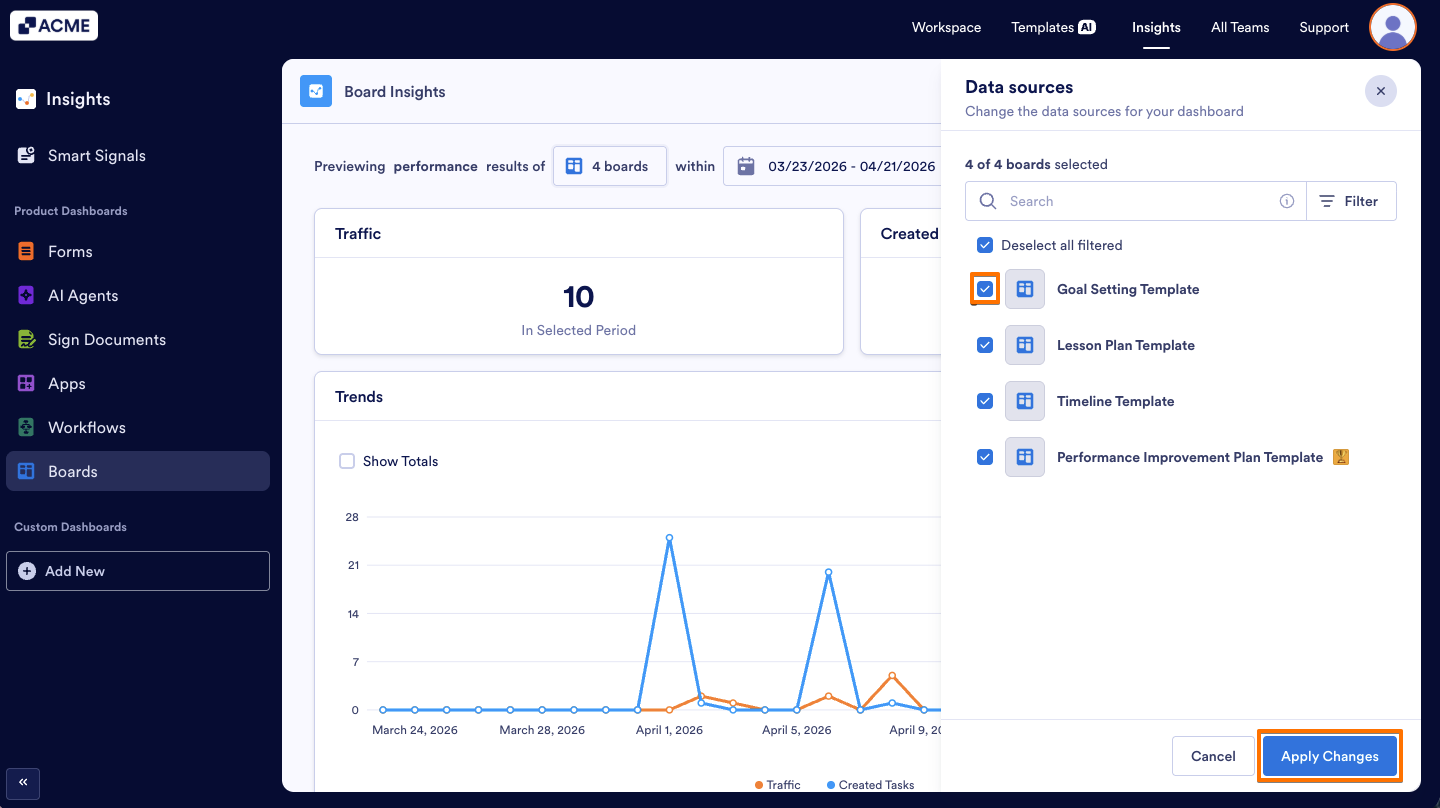
- Next, in the panel that opens on the right, select or deselect boards by clicking the checkboxes and click on Apply Changes.
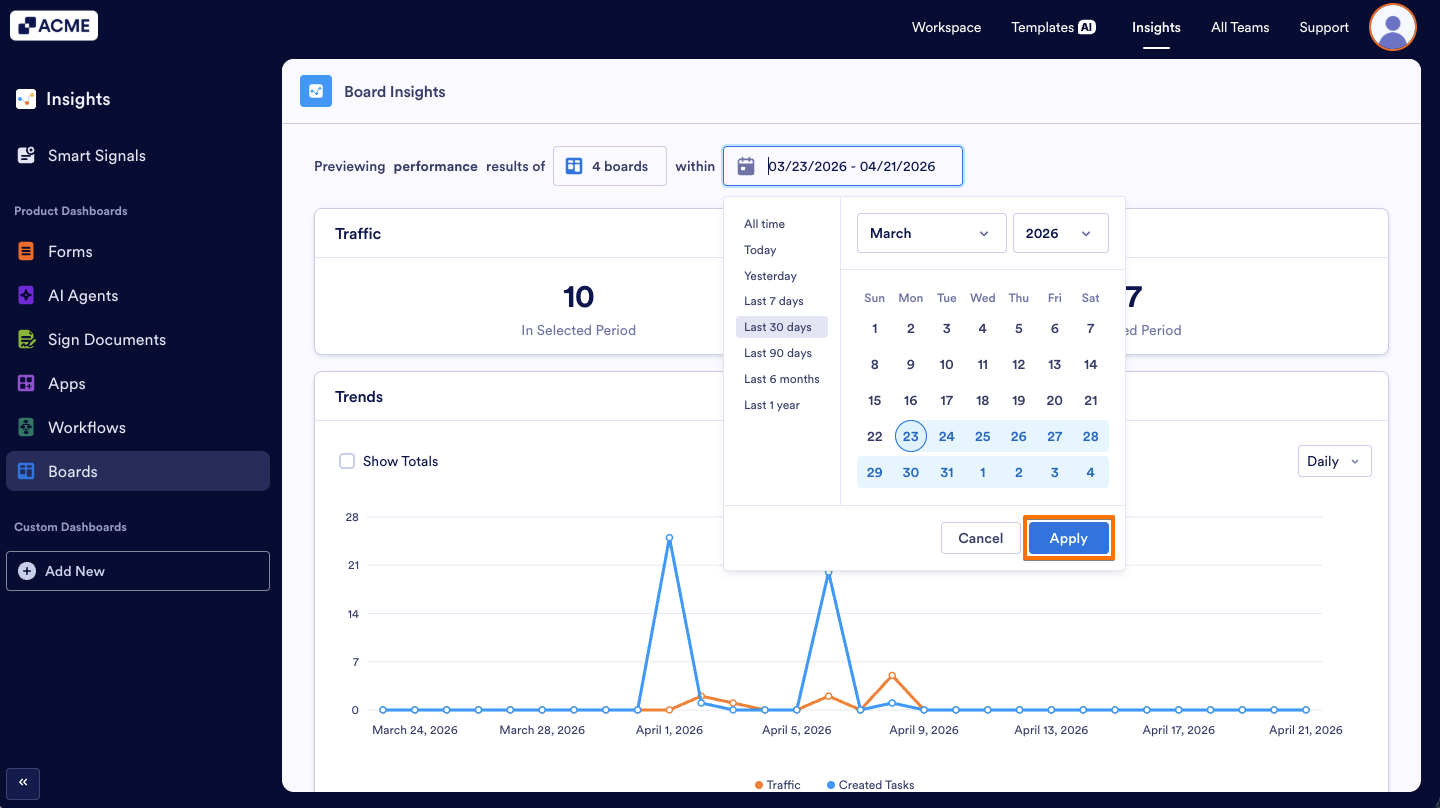
- To adjust the time period, click the Date Range picker next to the Boards selector.
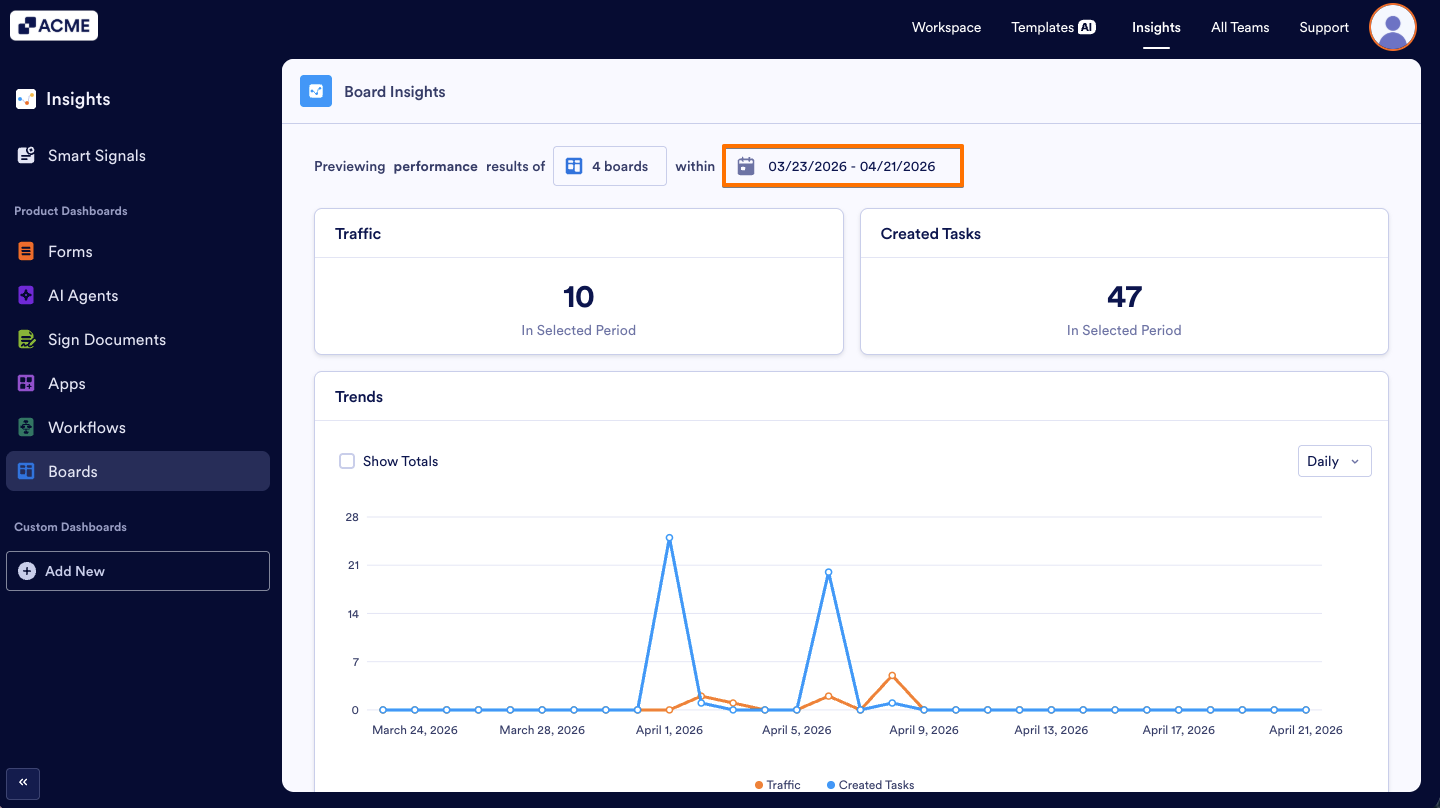
- Choose the desired start and end dates, then click Apply.
What metrics do we provide?
On this page, you can view key performance metrics for your Boards, such as Traffic and Created Tasks.
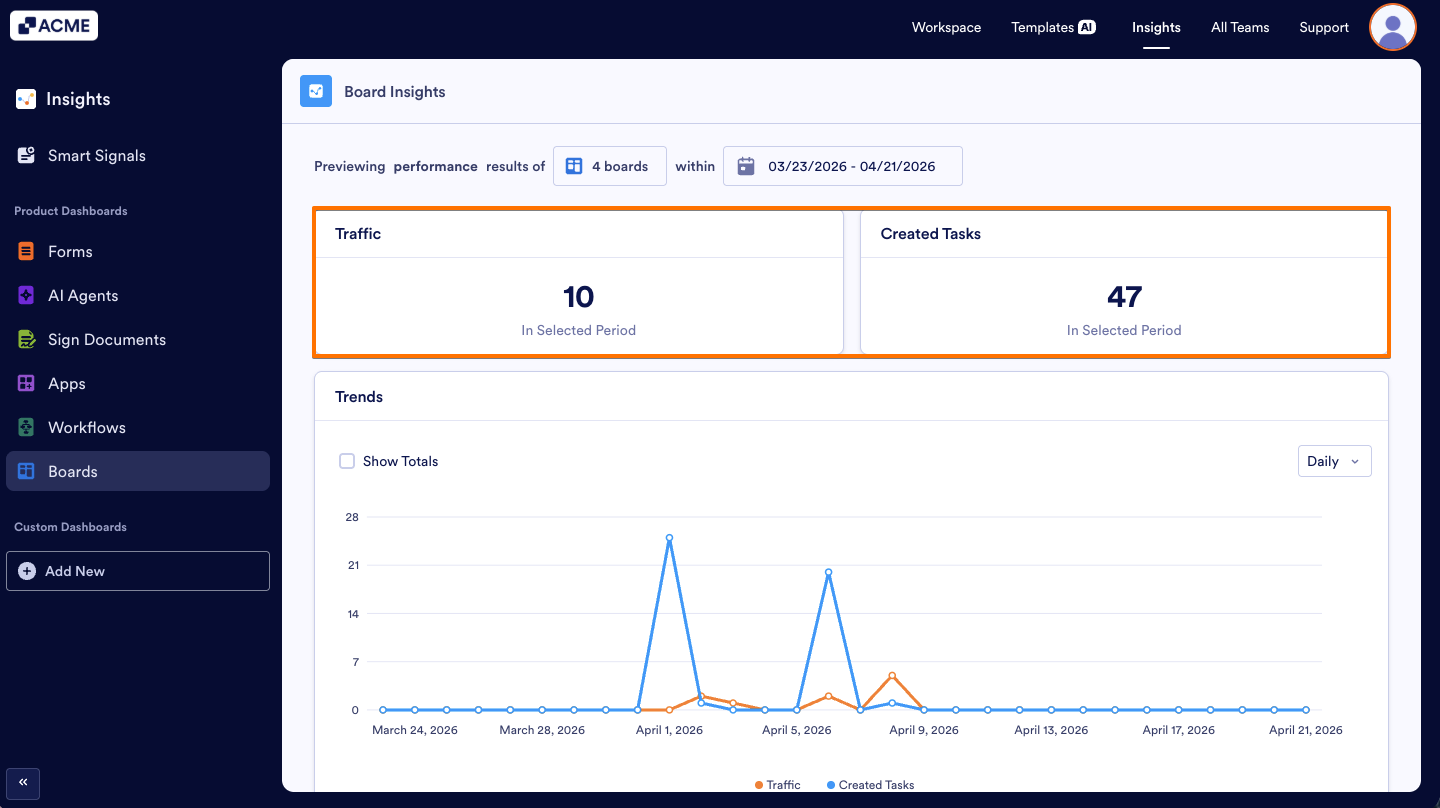
Traffic: Displays the number of visits or interactions on your Boards over a selected time period, helping you understand overall engagement.
Created Tasks: Shows the number of tasks created within your Boards, allowing you to track activity levels and workload trends.
Trends Chart
You can view detailed information about these metrics in the Trends line chart by selecting the metrics you want to analyze and choosing a display type—daily, weekly, monthly, or yearly—to better understand performance patterns over time.
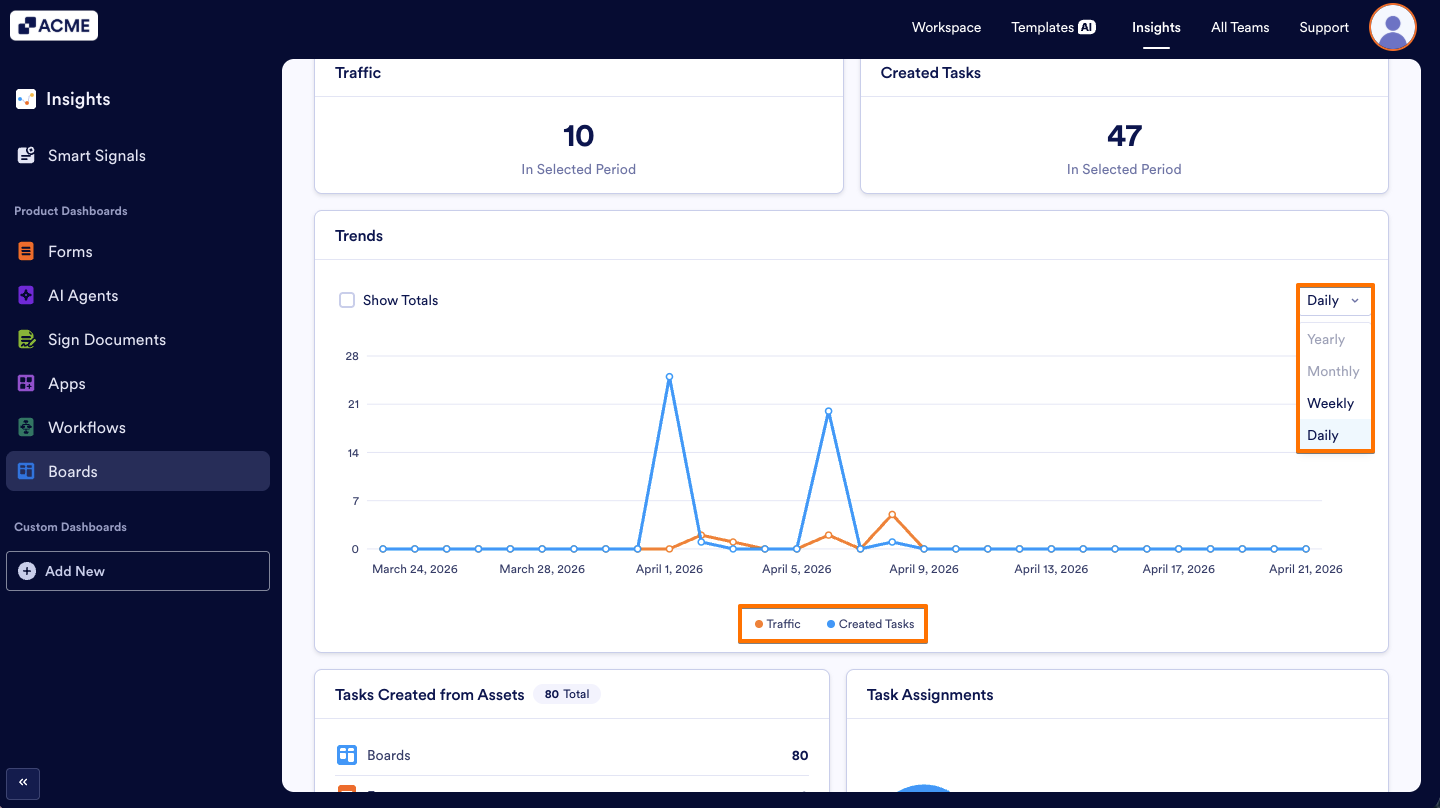
Add or Remove Metrics: You need to click on the metric name at the bottom of the trends chart to add or remove it from the chart.
Changing the Time Interval: To change the time period of the metrics, click on the dropdown menu at the upper-right of the chart and select daily, weekly, monthly, or yearly.
Note
Depending on the date range you’ve selected, some options might not be available. For example, if your date range for the tab is set to last seven days, you won’t be able to select monthly or yearly.
Tasks Created from Assets
This chart shows the distribution of tasks created from different assets, allowing you to see which sources contribute most to task creation and how your workflow resources are being utilized.
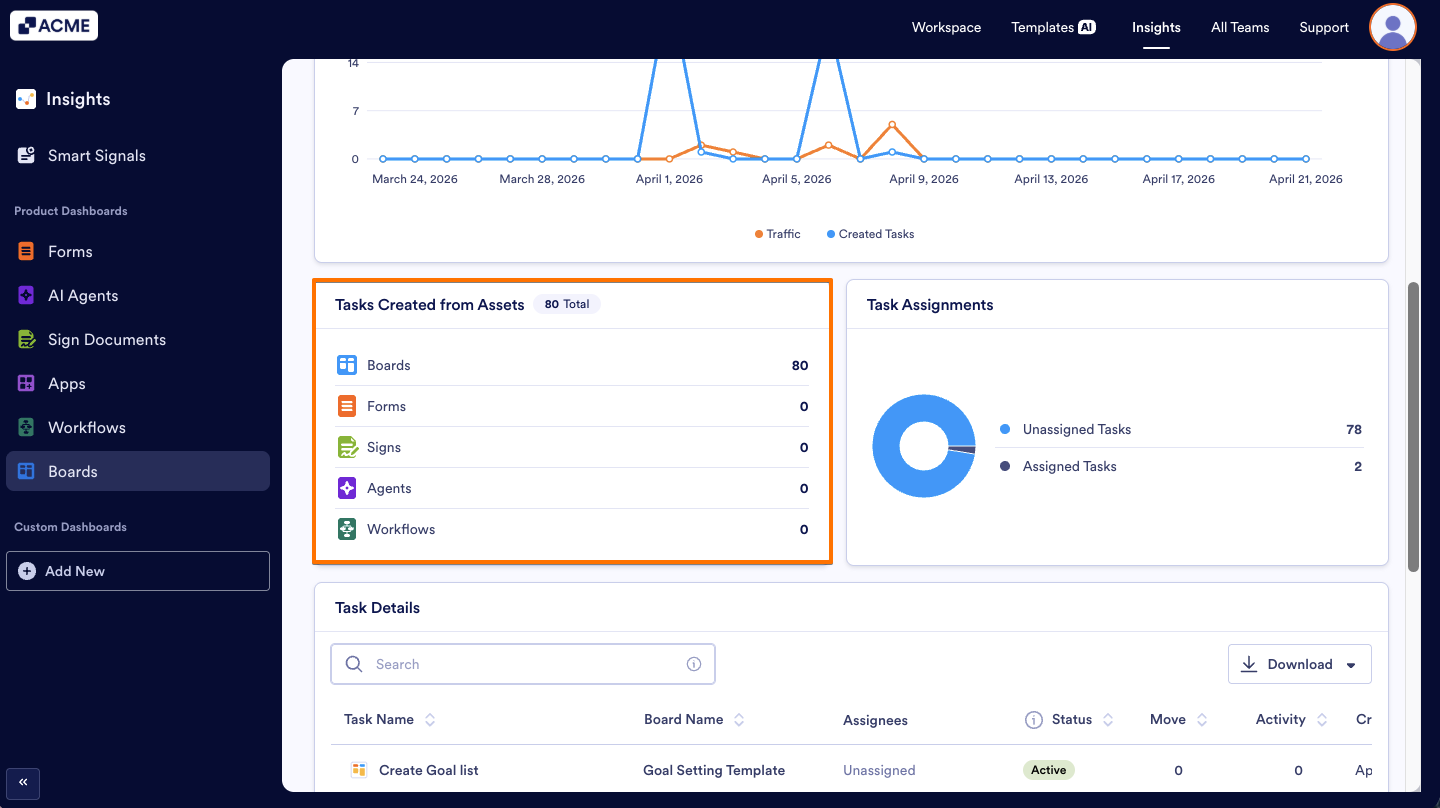
Boards: The total number of tasks or activities created from Boards, showing how much work originates from board-based workflows.
Forms: The total number of tasks generated from submitted Forms, reflecting user input and data collection activity.
Signs: The total number of tasks created through Sign documents, indicating e-signature-related activity.
Agents: The total number of tasks initiated or handled by Agents, showing automation or AI-assisted activity.
Workflows: The total number of tasks created through automated Workflows, representing process-driven task generation.
Task Assignments
This pie chart displays the distribution of assigned and unassigned tasks, helping you see how many tasks have been allocated to users versus those that are still pending assignment.
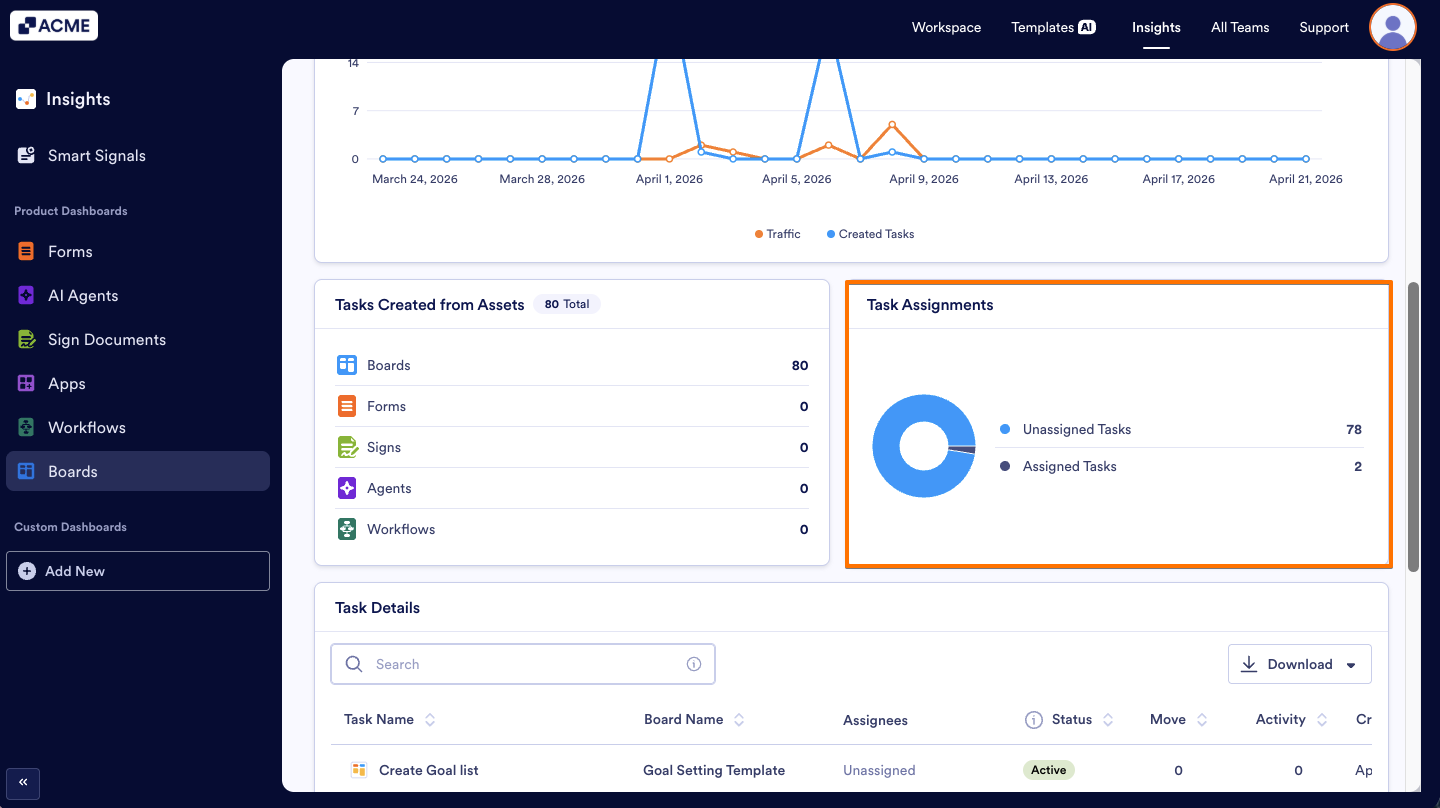
Unassigned Tasks: The total number of tasks that have not yet been assigned to any user.
Assigned Tasks: The total number of tasks that have been assigned to a user.
Task Details List
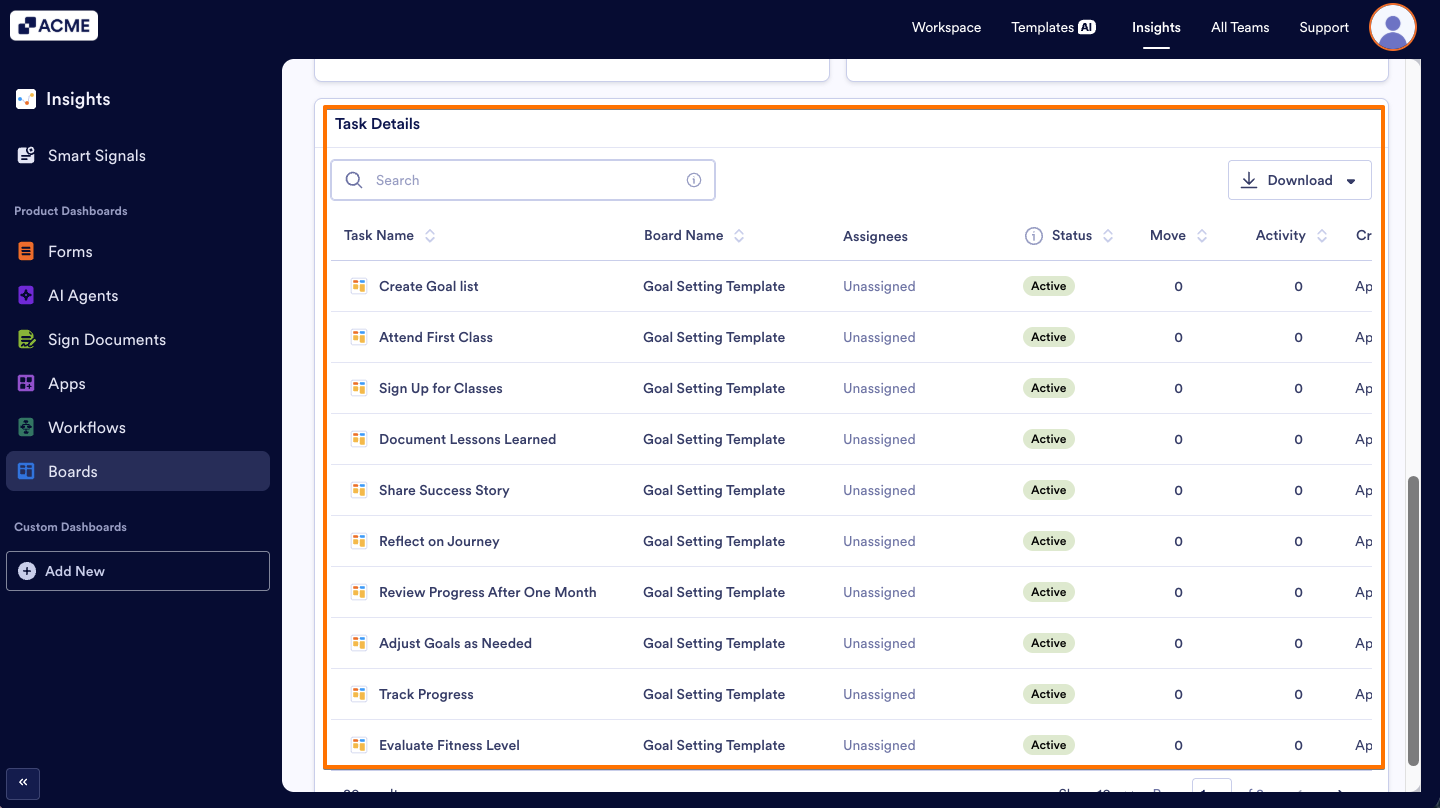
At the bottom of the page, there is a list where you can view detailed metrics for all tasks created in Boards. For each task, you can see information such as the task name, board name, assignees, status, move, activity, and creation time, helping you track and analyze task-level performance in detail.
Tip
You can download the task details as Excel or CSV by clicking the Download dropdown in the upper-right corner of the list.

Send Comment: