The Form Insights page provides detailed analytics with various metrics and breakdowns, allowing users to track the performance of their forms. Users can filter forms and analyze the performances, using specific metrics and select date ranges customized to their needs.
Accessing Form Performance Metrics
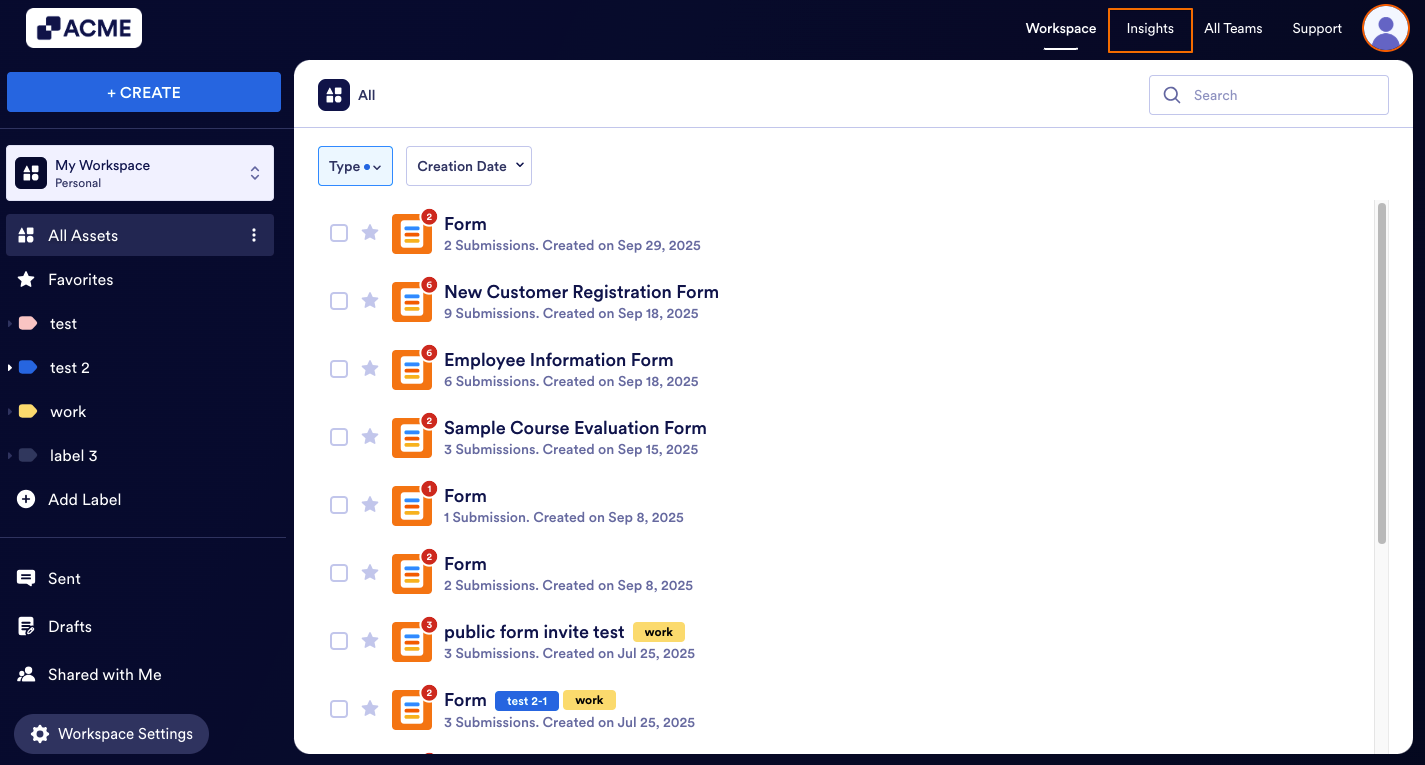
- In My Workspace, click on Insights in the upper right-hand corner of the page.
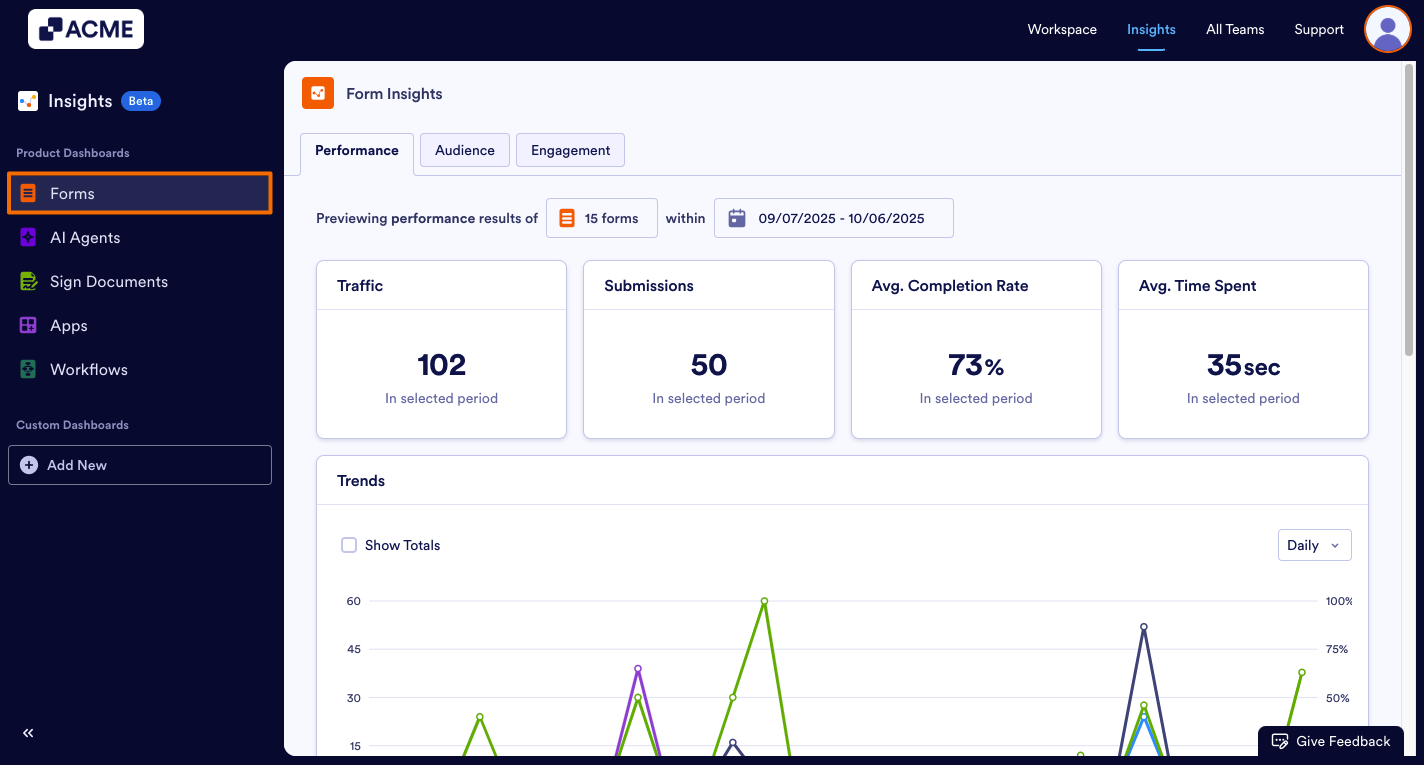
- In the Insights page, click on Forms from the menu on the left.
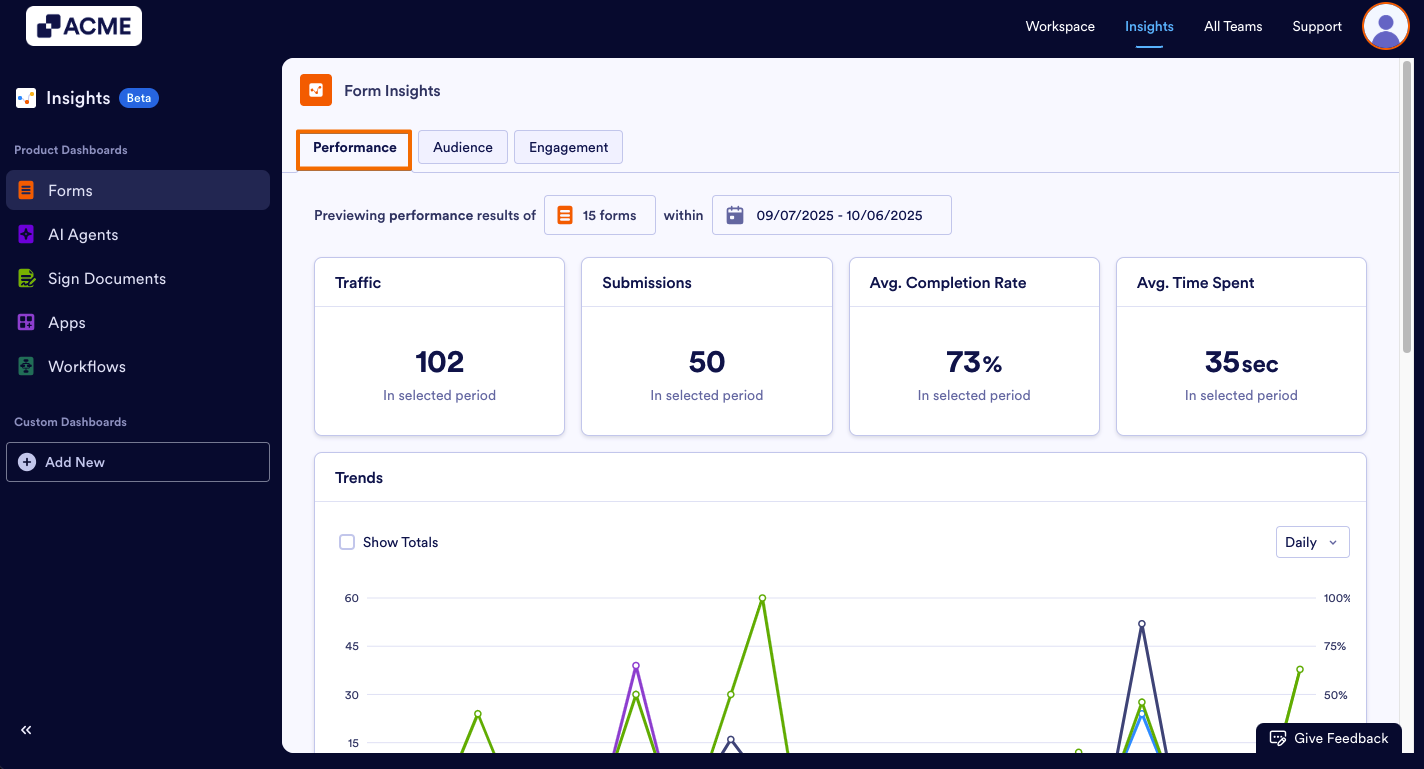
- Under the Form Insights, click Performance at the top of the page.
What Metrics Do We Provide?
On this page, you can view key performance metrics for your selected forms, including total views, submissions, average completion rate, and average time spent filling out the forms. Below is a detailed explanation of each metric:
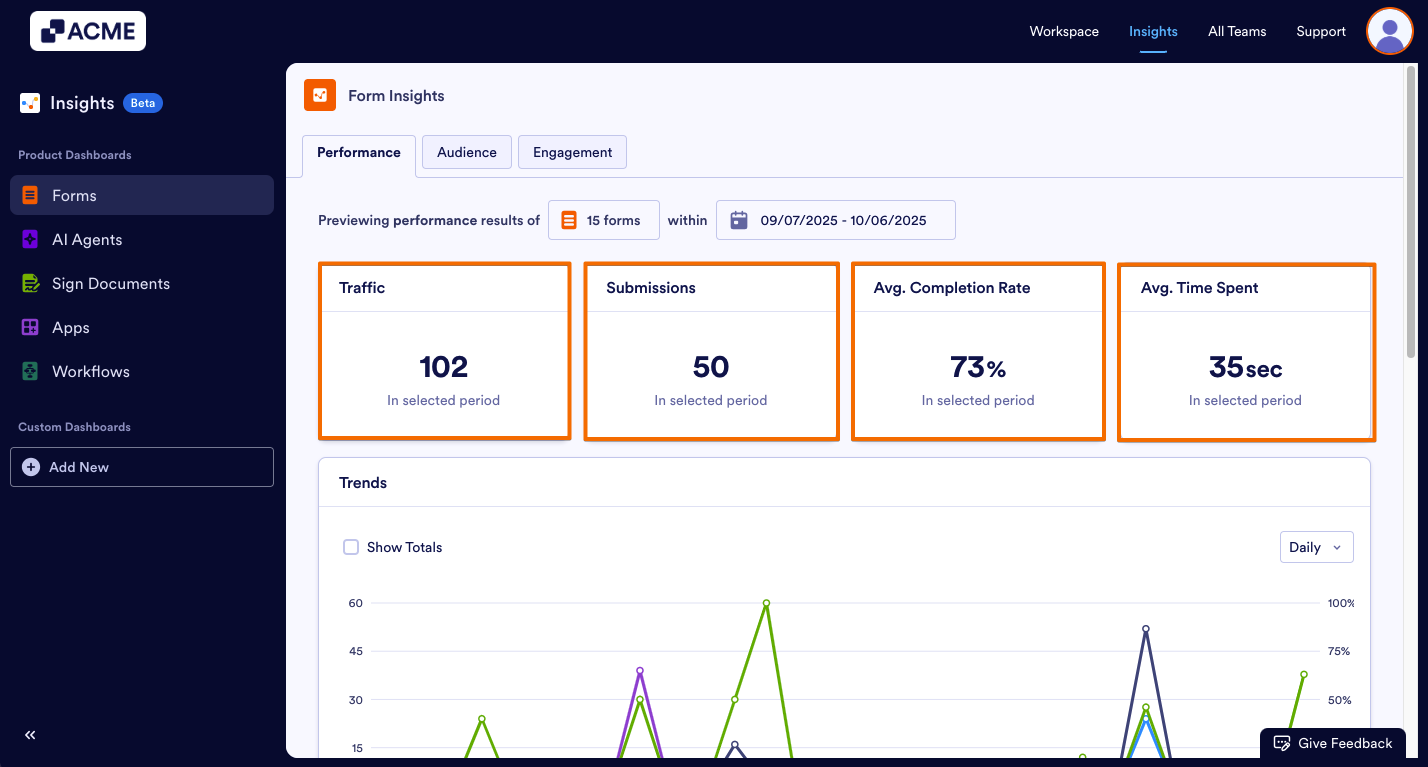
- Traffic: The total number of times your form has been viewed by users. Each view represents a user opening the form, whether they submit it.
- Submissions: The total number of submissions received, showing how many users completed and submitted the form.
- Average Completion Rate: The percentage of forms that were fully completed by users, indicating how often users finish filling out the form after opening it.
- Average Time Spent: The average amount of time users spend completing the form, from opening to submission.
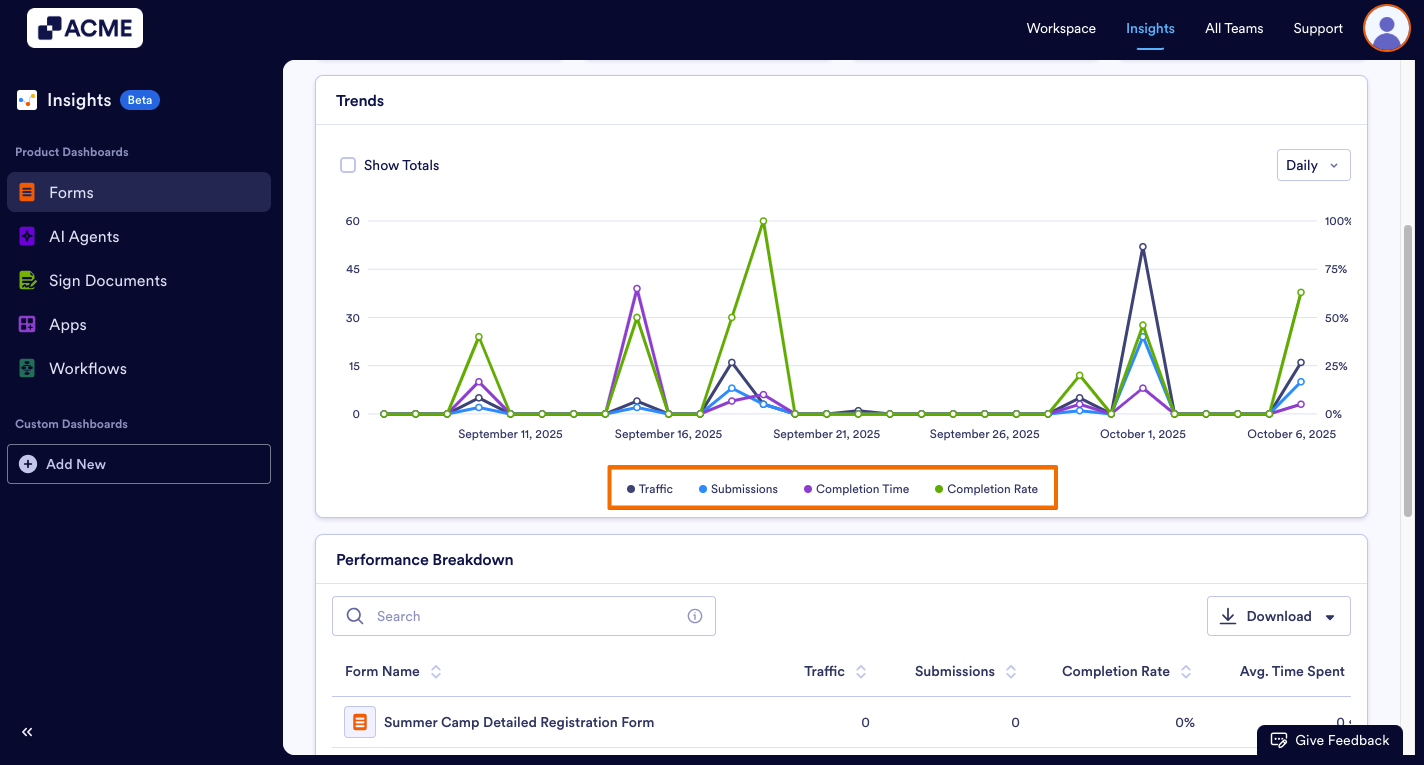
Trends
Want to see how submissions vary day-to-date within the selected date range? Using Trends, you can see a daily breakdown of each metric, and track any spikes or changes there.
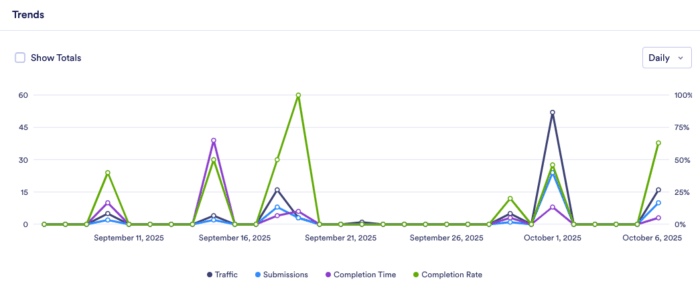
Trends, by default, shows all metrics in a daily breakdown, but you can customize this based on your needs.
- Add/Remove Metrics: Click on the metric name at the bottom of the chart to add or remove it from the chart.
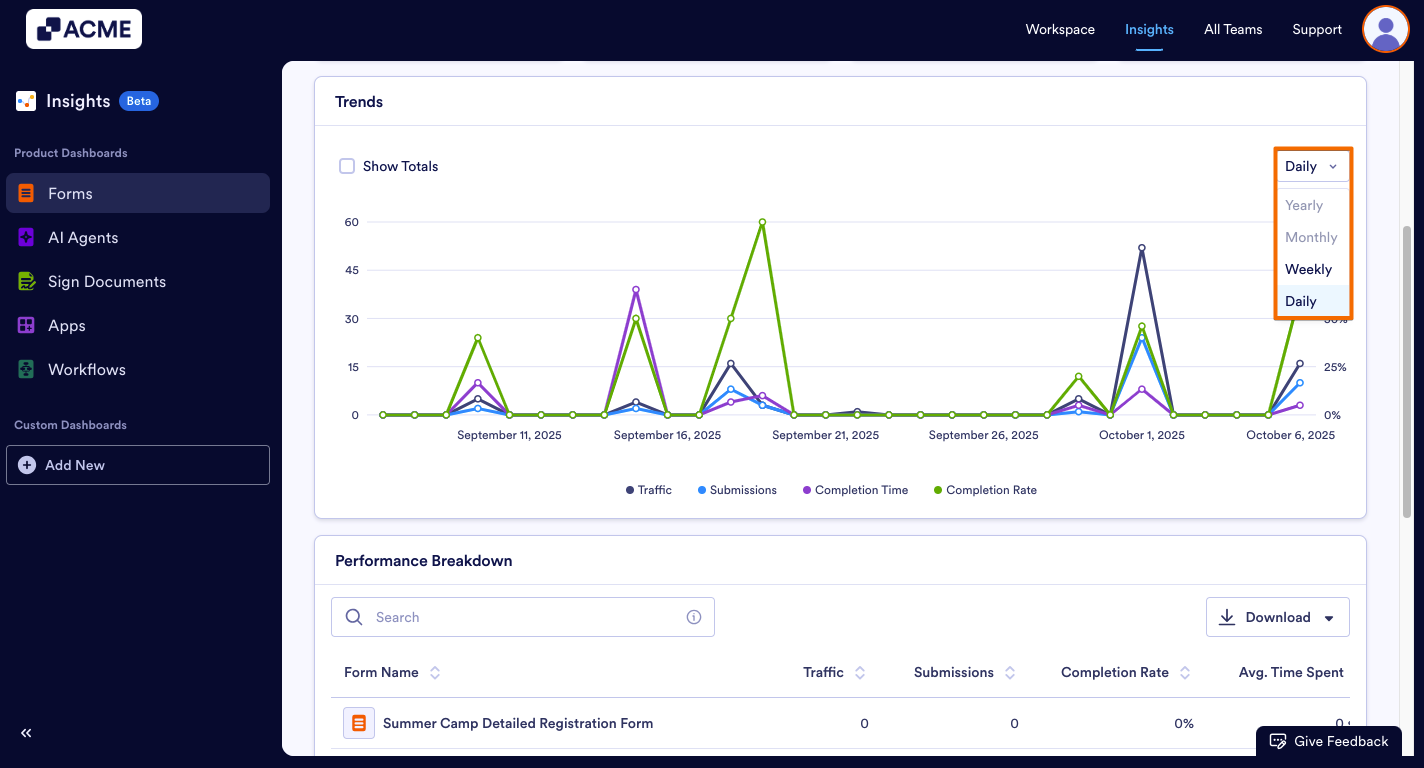
- Changing the Time Interval: Click on the drop-down menu at the top of the chart and select daily, weekly, monthly, or yearly.
- Depending on the date range you’ve selected, some options might not be available. For example, if your date range for the tab is set to last seven days, you won’t be able to select monthly or yearly.
Performance Breakdown
Need an even more detailed overview for each form? Within the performance breakdown list, you can view all forms in the selected date range along with their individual metrics. These metrics include: Traffic, Submissions, Average Completion Rate, and Average Time Spent.
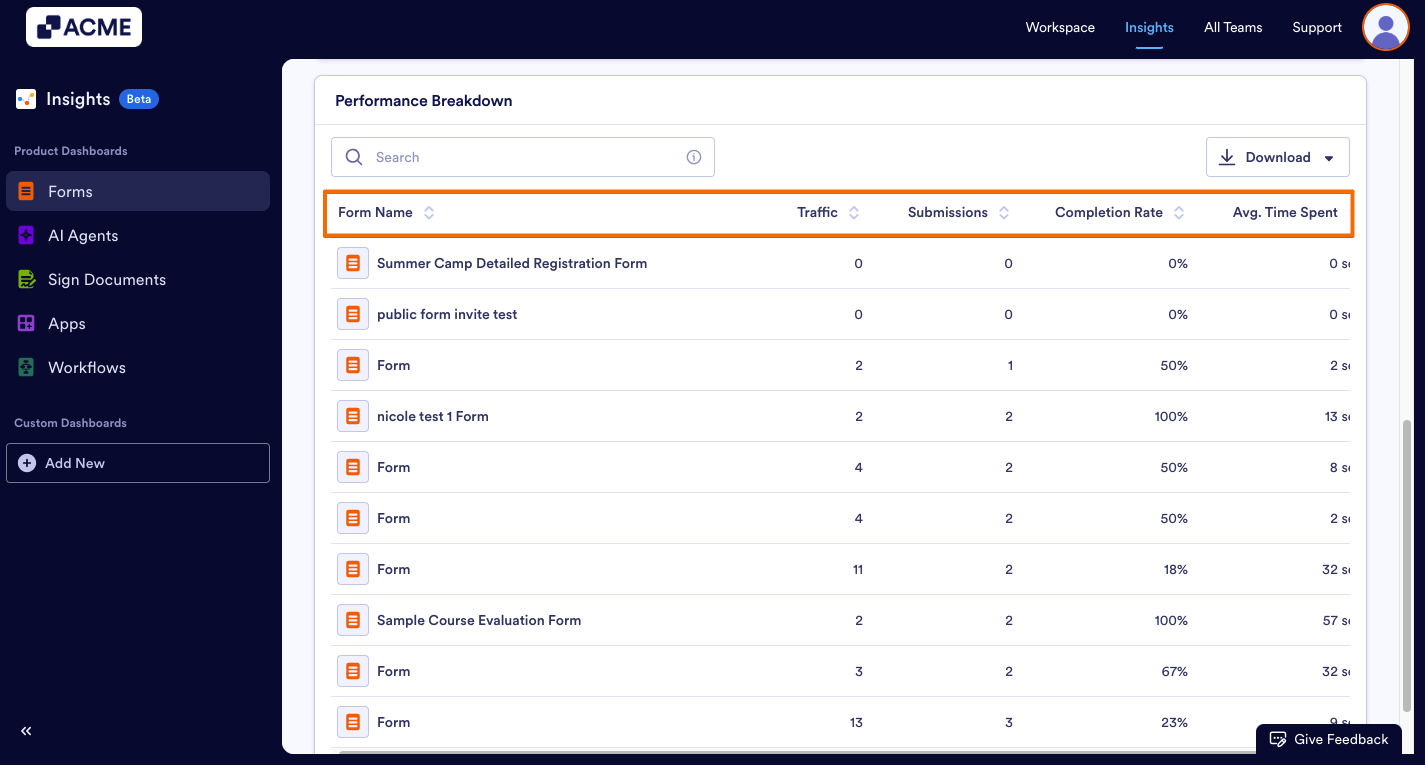
- These metrics are per form, and are specific to the date range selected at the top of the page.
- You can download the entire list by clicking the Download button on the right and saving it as a CSV or Excel file.
See Also:
How to Filter and View Form Metrics in a Specific Date Range in Insights?

Send Comment: