The Workflow Insights page provides detailed analytics with various metrics and breakdowns, allowing users to track the performance of their workflows. Users can analyze workflow activity across specific date ranges, compare key metrics, and explore trends to gain deeper insights into performance.
Accessing Workflow Metrics
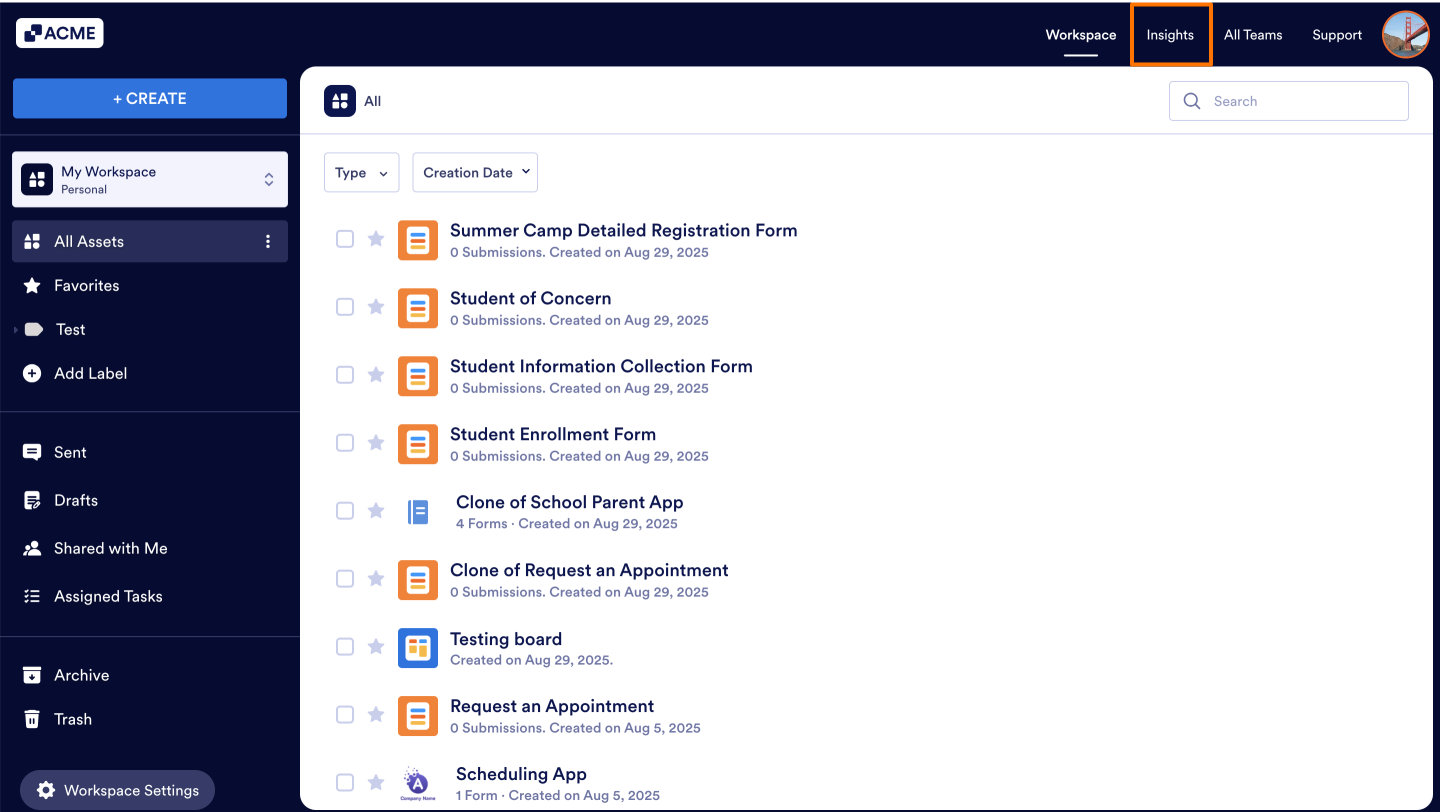
- In My Workspace, click on Insights in the upper right-hand corner of the page.
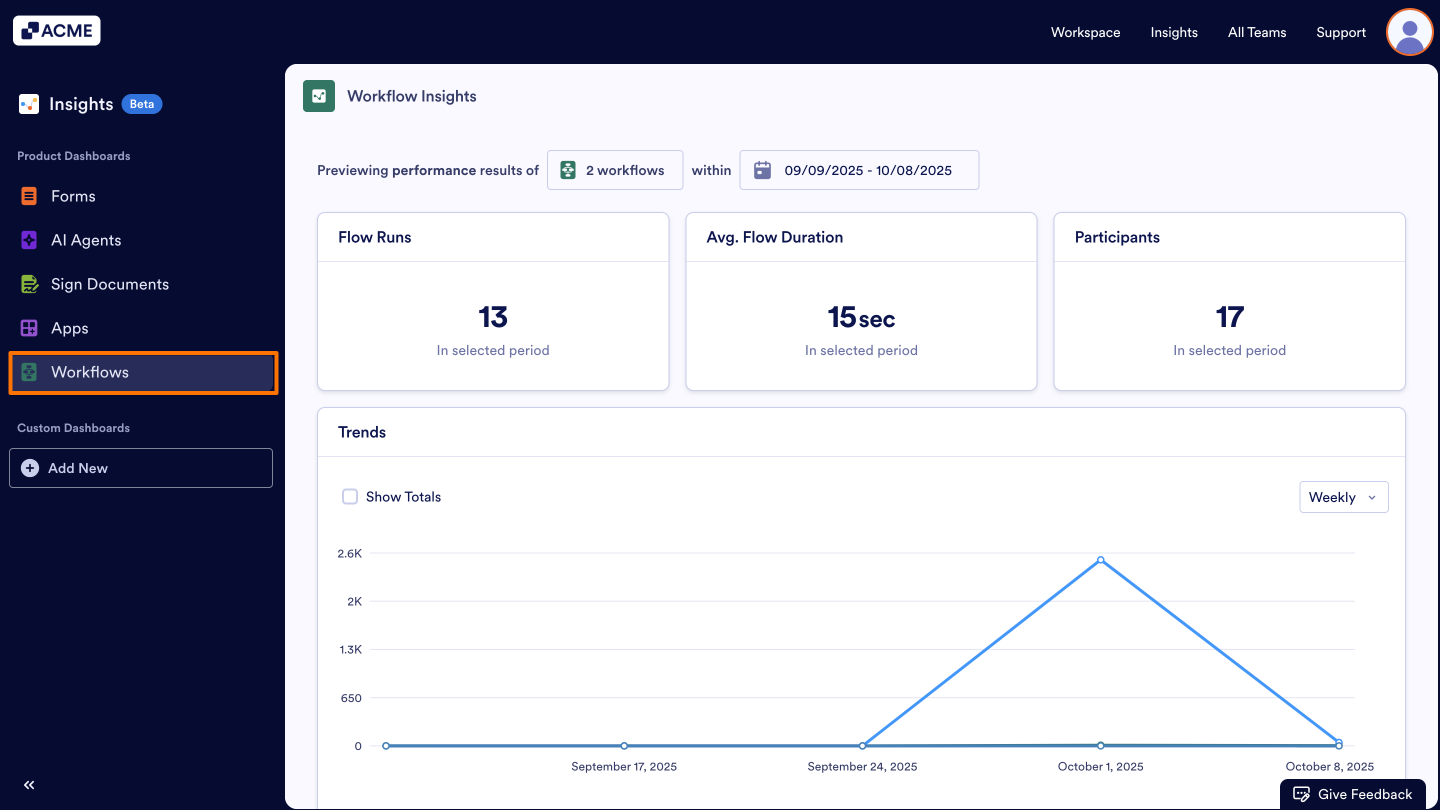
- Next, click on Workflows from the menu on the left.
What metrics do we provide?
All metrics on this page track Key Performance Metrics, such as Flow Runs, Average Flow Duration, and Participants. These metrics reflect data specific to the date range selected at the top of the page:
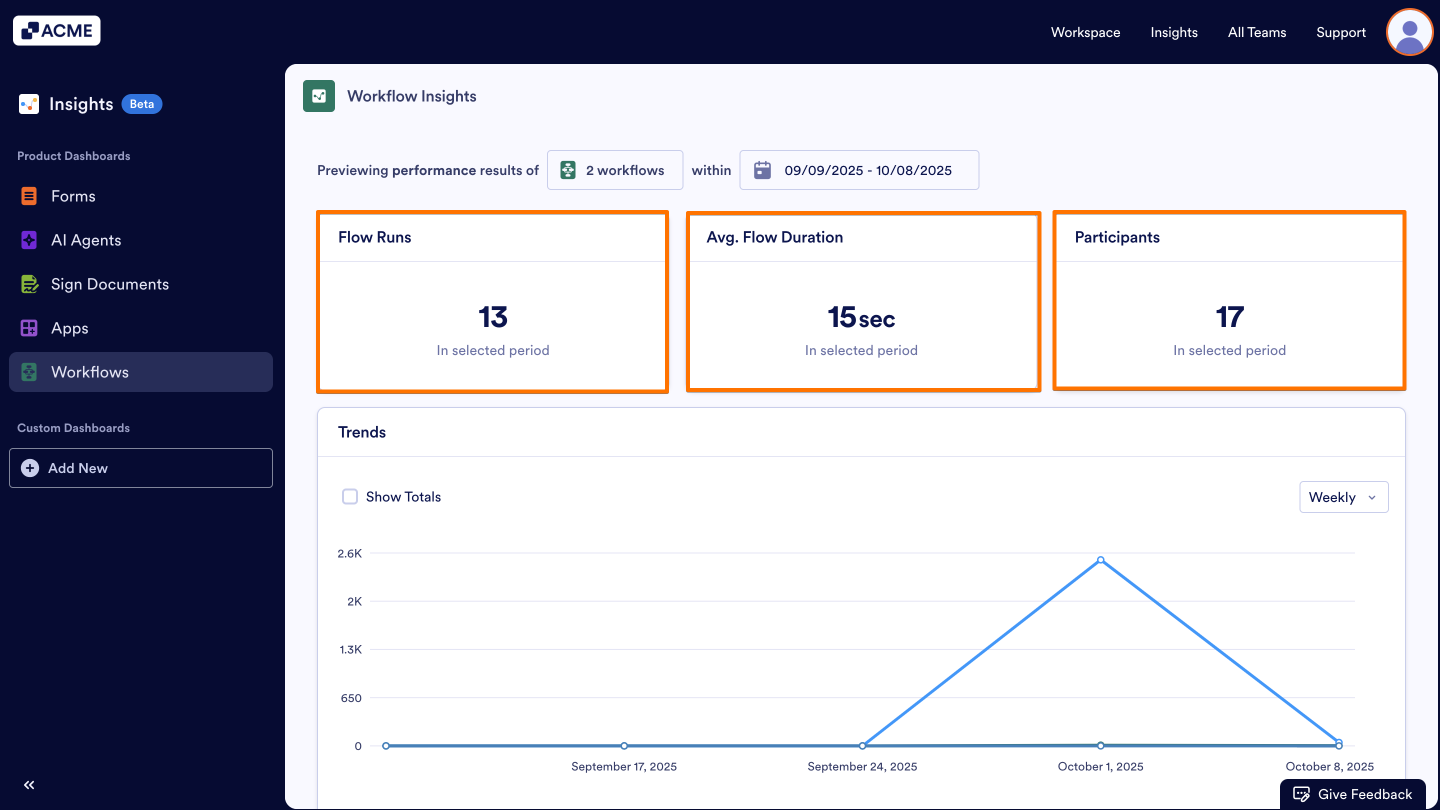
- Flow Runs: The number of times a workflow is triggered—counted each time the first form is submitted by a form filler within the selected date range.
- Average Flow Duration: The average time it takes for the workflow to be completed from start to finish within the selected date range.
- Participants: Participants are the individuals actively involved in each flow, including signers, approvers, task assignees, and others who interact with its steps within the selected date range.
Trends
Want to see a more detailed breakdown, day-to-day or month-to-month? Under Trends, you can view the above metrics in a line chart and based on a time interval you choose.
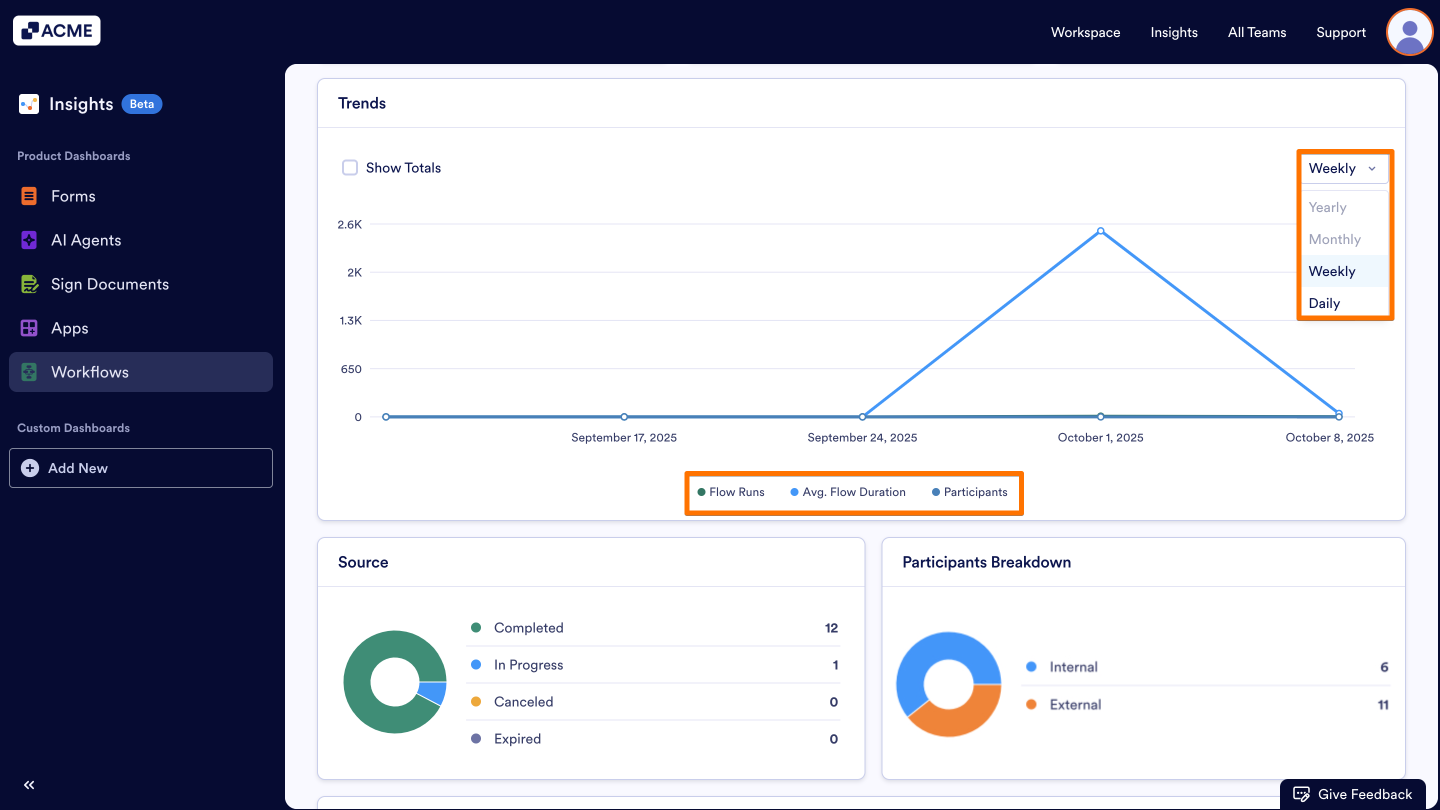
Trends, by default, shows all metrics in a daily breakdown, but you can customize this based on your needs.
- Add/Remove Metrics: Click on the metric name at the bottom of the chart to add or remove it from the chart.
- Changing the Time Interval: Click on the drop-down menu at the top of the chart and select daily, weekly, monthly, or yearly.
- Depending on the date range you’ve selected, some options might not be available. For example, if your date range for the tab is set to last seven days, you won’t be able to select monthly or yearly.
Other Cards Metrics
Source
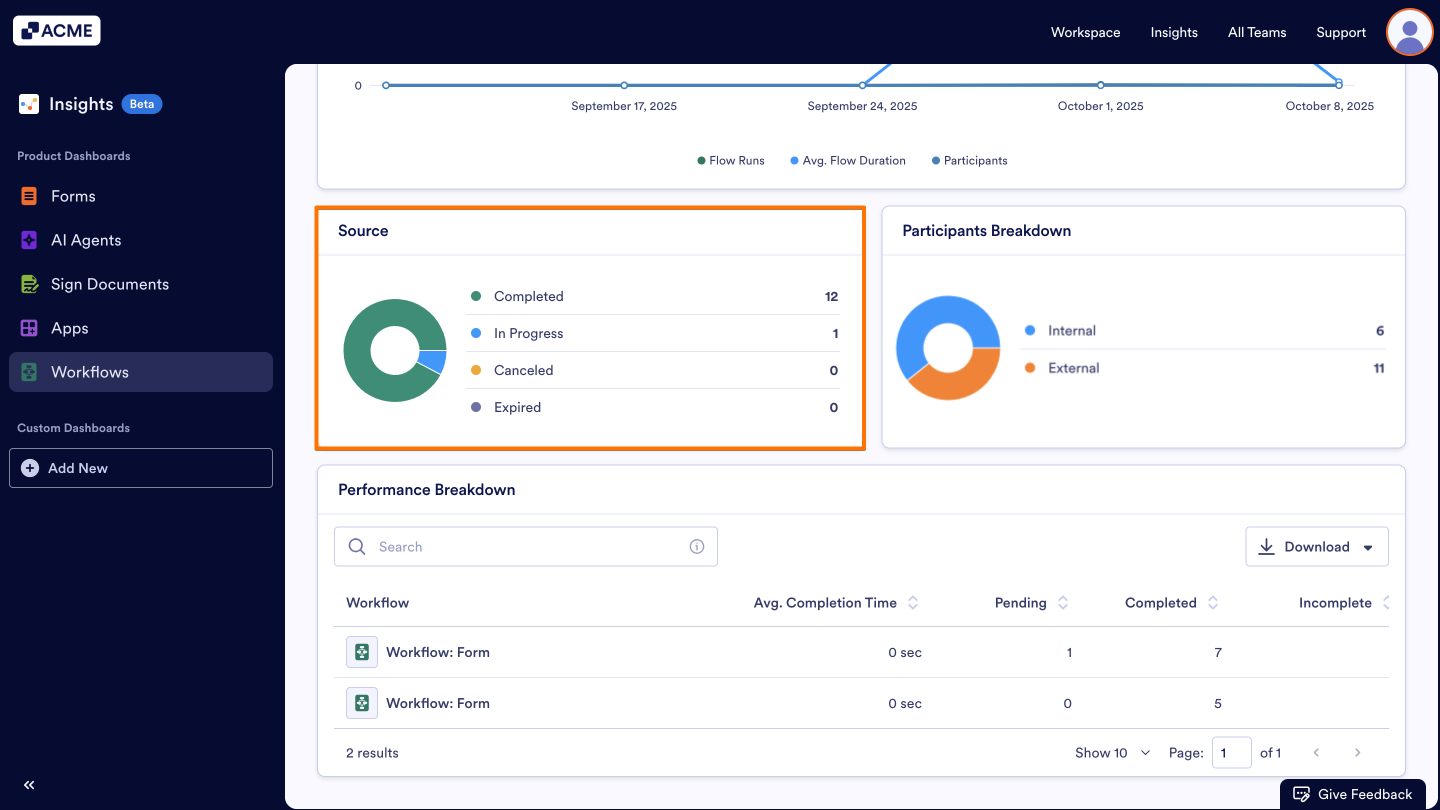
You can view the flow statuses (Completed, In Progress or Canceled) in the pie chart.
- Completed: The total number of Flows that have successfully finished all steps within the selected date range.
- In Progress: The total number of Flows that are currently running and have not yet completed all steps.
- Canceled: The total number of Flows that were manually or automatically stopped before completion.
Participants Breakdown
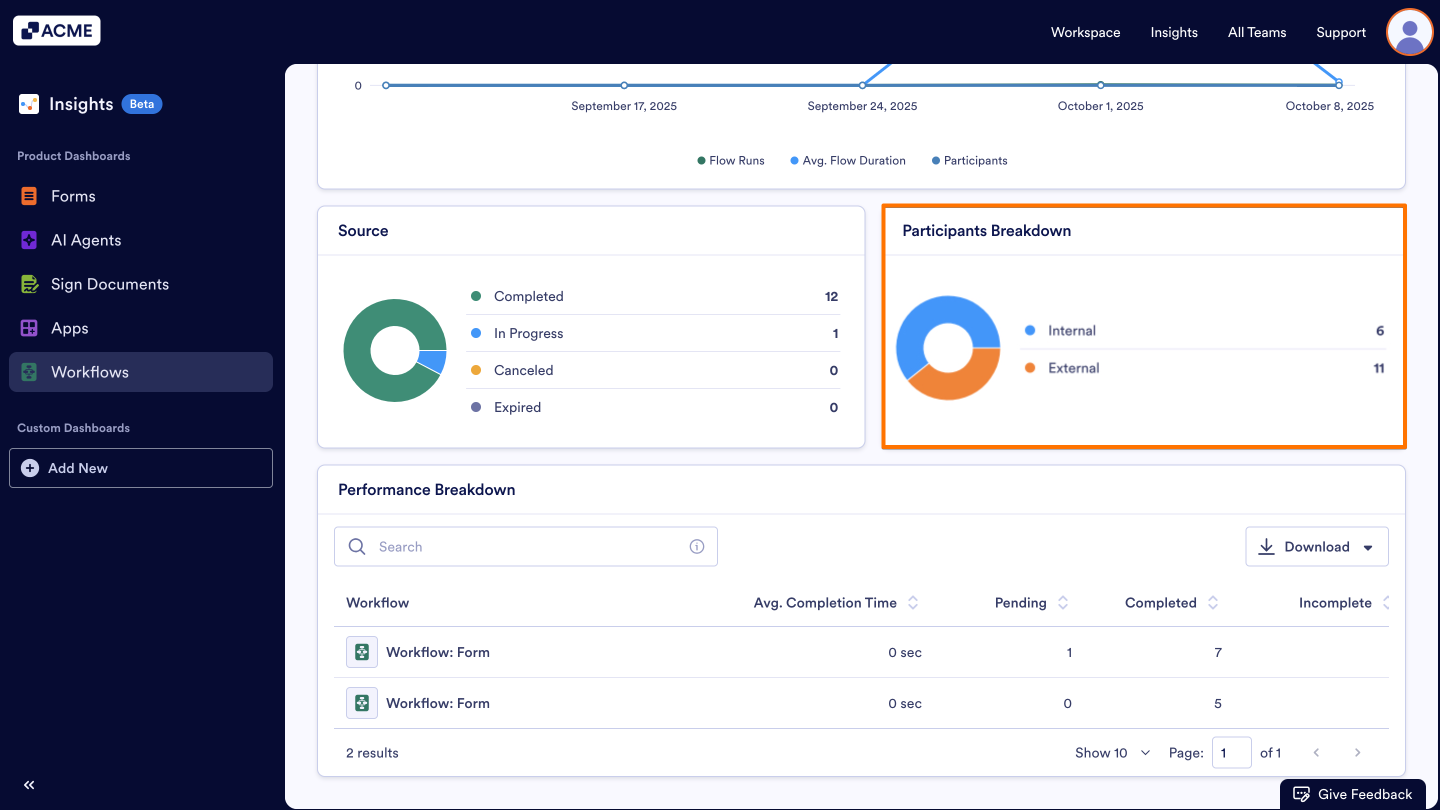
This chart displays the distribution of participants across the workflows as:
- Internal: Participants who belong to the organization (e.g. employees or team members).
- External: Participants outside the organization (e.g. customers).
Performance Breakdown
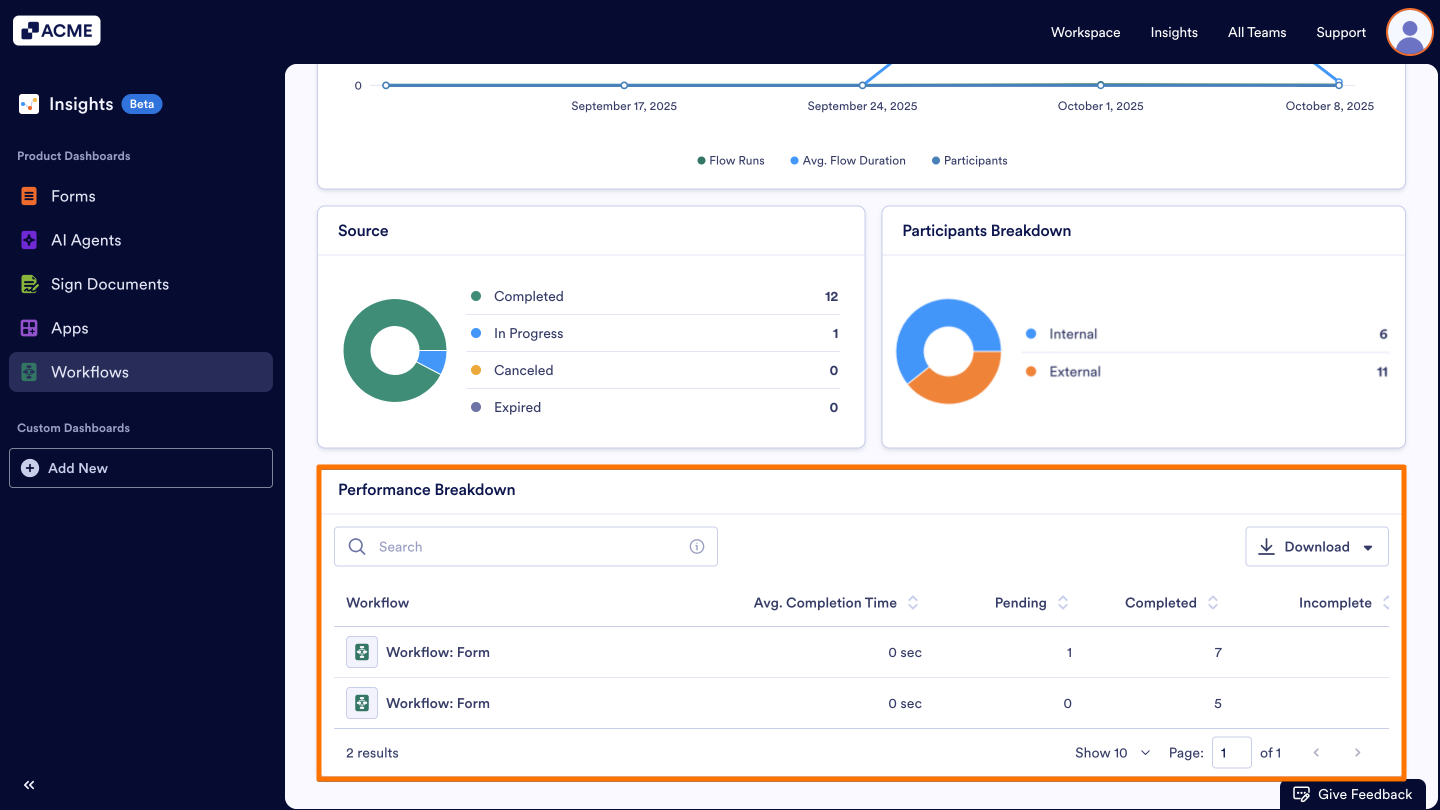
At the bottom of the page, there is a table where you can view performance-related metrics for all individual workflows. For each workflow, you can view metrics including Average Completion Time, Pending, Completed, Incomplete, Expired, and Participants.
- These metrics are per Workflow, and are specific to the date range selected at the top of the page.
- You can download the entire list by clicking the Download button on the right and saving it as a CSV or Excel file.
See also:
How to filter Workflow Metrics in a specific date range in Insights?

Send Comment: