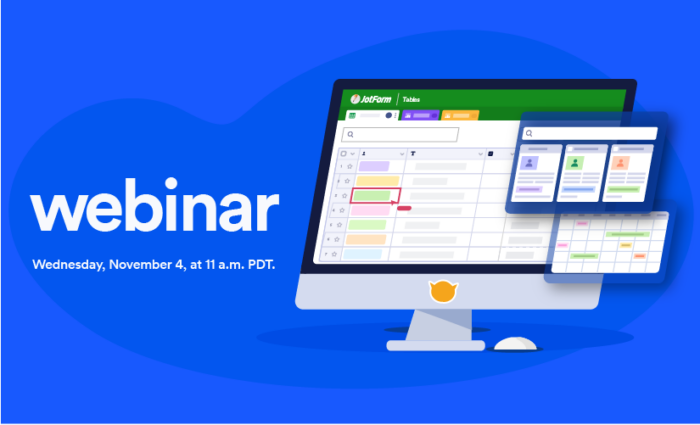
We’ll be honest. Here at Jotform, we’ve been eagerly anticipating the launch of Jotform Tables for months. Now that it’s finally here, we’re going all in on a live webinar to showcase its features, capabilities, and many uses!


Prepare to have more control over your submission data than ever before. Jotform Tables automatically transforms your data into an all-in-one workspace. And you get a multitude of organizational tools at your fingertips.
With an intuitive interface that allows you to search, sort, edit, calculate, filter, and categorize your data, you’ll be able to manage all aspects of your form responses in real time, on your terms. And when you’re done, share or export your results via CSV, Excel, or PDF file. It’s that easy.
There are dozens of potential use cases for Jotform Tables; we’ve listed a few below, but the only limit is your imagination:
- Inventory logs
- Project management sheets
- Task sheets
- Contact lists
- Attendance sheets
- Registration sheets
- Checklists
- CRM sheets
- Medical log sheets
- HR/payroll sheets
- Recruitment forms
Whether you’re dealing with a few form responses or hundreds (or even thousands), the ability to view, interact with, and seamlessly transpose all that data in moments is an invaluable time-saver. Oh, and did we mention it’s free to all Jotform users?
We’re convinced you’ll love Jotform Tables as much as we do, so we’re excited to show it to you. Watch our webinar for an in-depth look at this robust data management and organizational tool in action. We look forward to seeing you then!
Introducing Jotform Tables
Elliott: Hey everyone! It’s Elliott and Chad from Jotform here again, with another webinar we’re bringing you, this one introducing our launch of Jotform Tables. Now, of all our product lineup this year, it’s safe to say this is the one we’ve been most looking forward to for the many months it’s been in development. We really think Jotform Tables revolutionizes the user experience for our platform and the ways you can engage with your data on multiple new levels. So, we’re really excited to show you guys this and walk you through it, let’s not wait any longer and dive straight in.
Goals for webinar
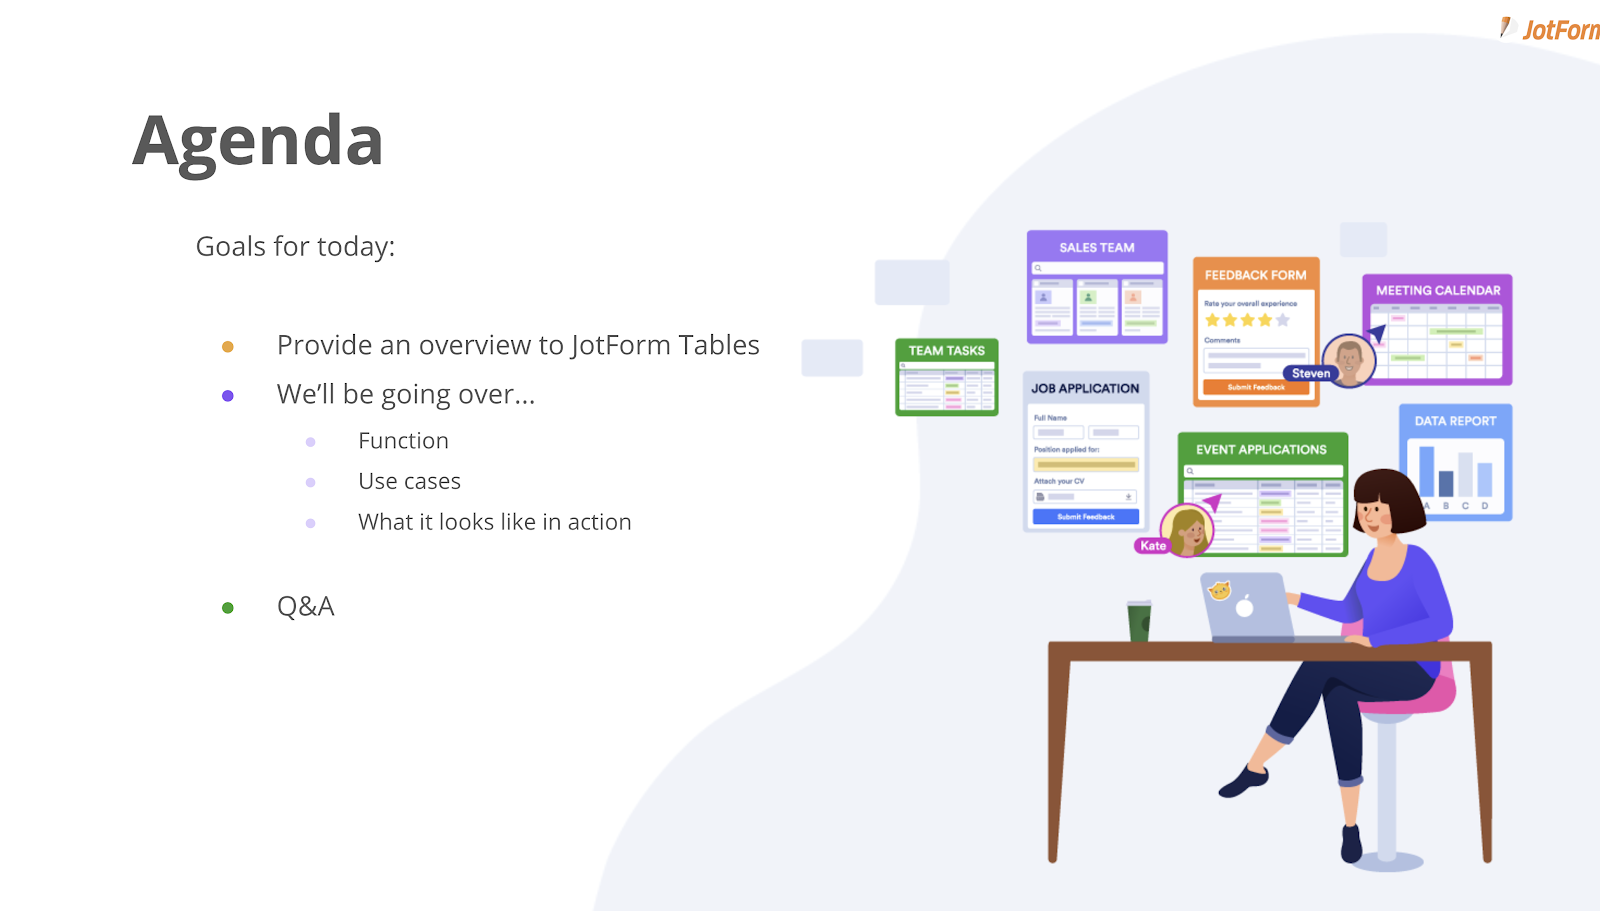
What we want to do today is provide a broad overview to Jotform Tables as a whole, introduce you to its function and what it does, how it works — when you can use it, and of course demonstrate it in action. This is an incredibly robust tool, and there’s so much to show, we won’t spend too much time on a presentation because beyond introducing its basic functionality and use cases, the demo will be the valuable take-away here, and we’re excited to get to it. So, we’ll go over some of the important things to know and then kick that off ASAP. I do want to call out we’ll host a Q&A session to fill the remainder of our time after the demo today, so if you do have a question, you’ll see a button on your screen that says “Q&A,” you can just click on that and type in your question and send it our way any time during the presentation — we have Dave on hand monitoring the chat to respond to what he can in real-time, and we’ll address some of your questions at the conclusion of our live demo.
Overview
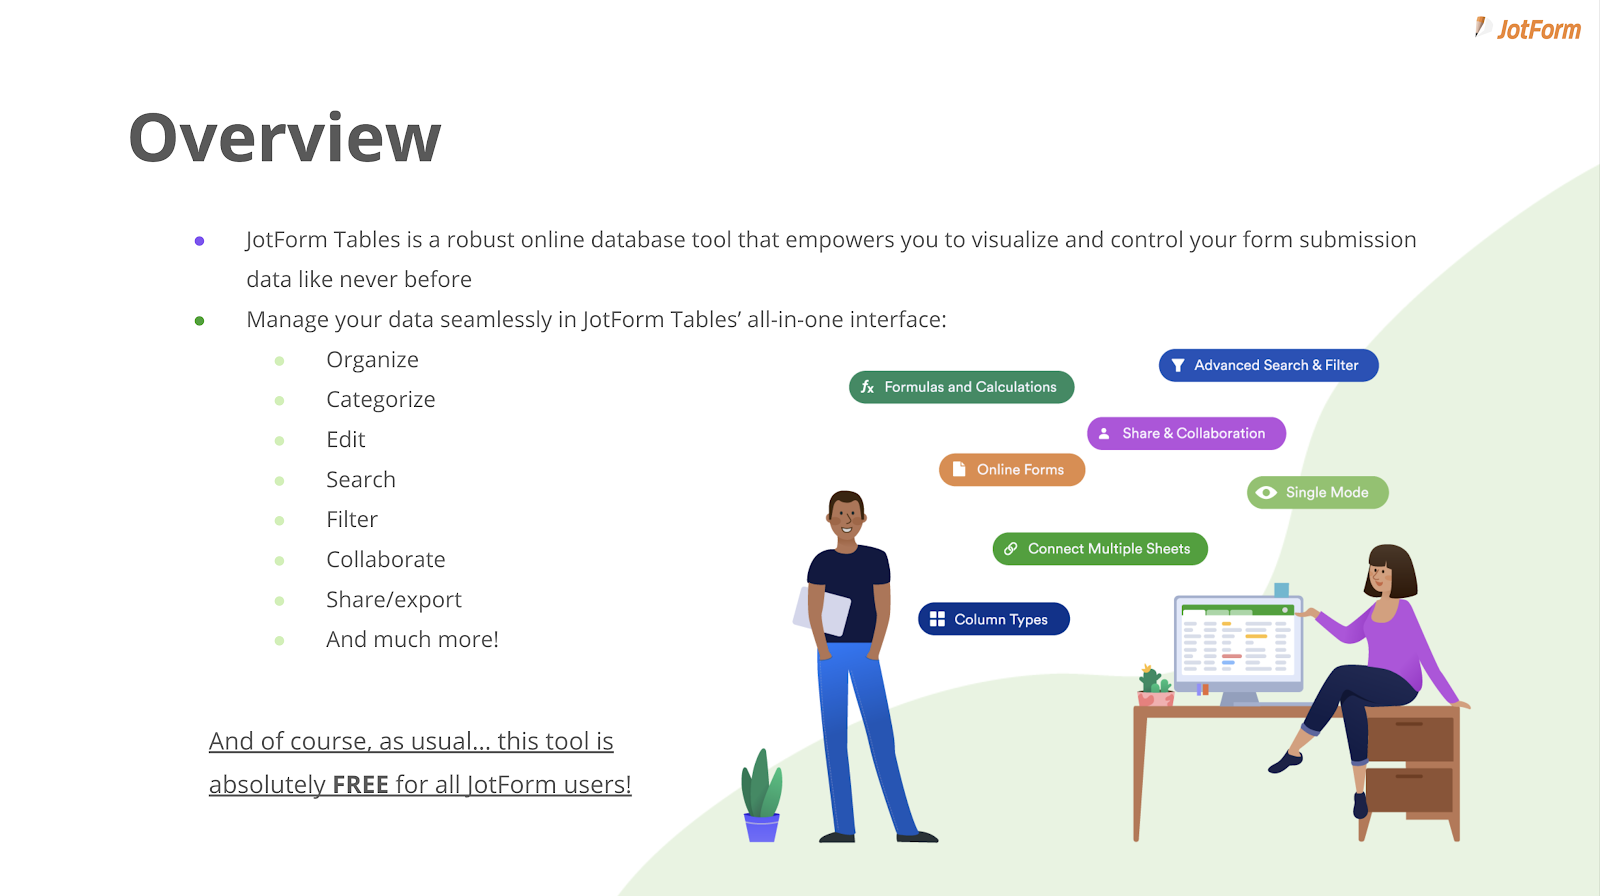
So, speaking high-level, Jotform Tables is an online database tool that lets you practically reimagine every aspect of your data management. We designed its interface to be intuitive and simple in visualizing and controlling your information your way, but also sophisticated enough to give you an array of more advanced functions and options to choose from, so whatever you need to get out of your data management, Jotform Tables has a solution. Whether you need to reorganize, categorize, sort, edit, filter, search by keyword, share your data, or collaborate on projects, you can do it all and more with Jotform Tables. And before we go any further, I’ll just say that as usual, Jotform Tables is included 100-percent free for all tiers of Jotform users, there’s zero additional cost to making use of this resource.
How Jotform Tables works
So all that’s great, but how does it actually work? Well the tool takes any data that’s been submitted to one of your JotForms and converts it into sort of an all-in-one table interface. Now from here, you can interact with the data how you’re normally used to doing in any fully-featured spreadsheet, but it doesn’t stop there.
In addition to those more standard functions I listed, Jotform Tables has a lot of other features up its sleeve to give you more options with your data than ever before. These include progress trackers to keep live tabs on projects, you can integrate function calculators, rating scales, notes and comments. You can also connect to other forms and link their data on a new tab, you can automatically generate a calendar for time-related submissions such as sign-ups or registrations, and you can open in Report Builder, which creates a ready-to-present deck with your form data, complete with graphs and charts. Or, convert to our Cards view if you want a streamlined information flow. Not to mention you can collate full lists at the click of a button for distribution, whether that’s a contact list, inventory, whatever it is, you can take all the data in a table like email addresses and export it to a CSV file in moments, which is actually how I entered the email registrants on Zoom from Jotform for this very webinar. And of course, maybe most important, you can share your Tables with others and collaborate live with members of your team on a project simultaneously. We’ll of course show you all this and more in just a moment.
And I should note here, you don’t actually need a form or any submitted form data as a gateway to access Jotform Tables and all its great features straight away. But we’ll get to that in the demo.
Use cases
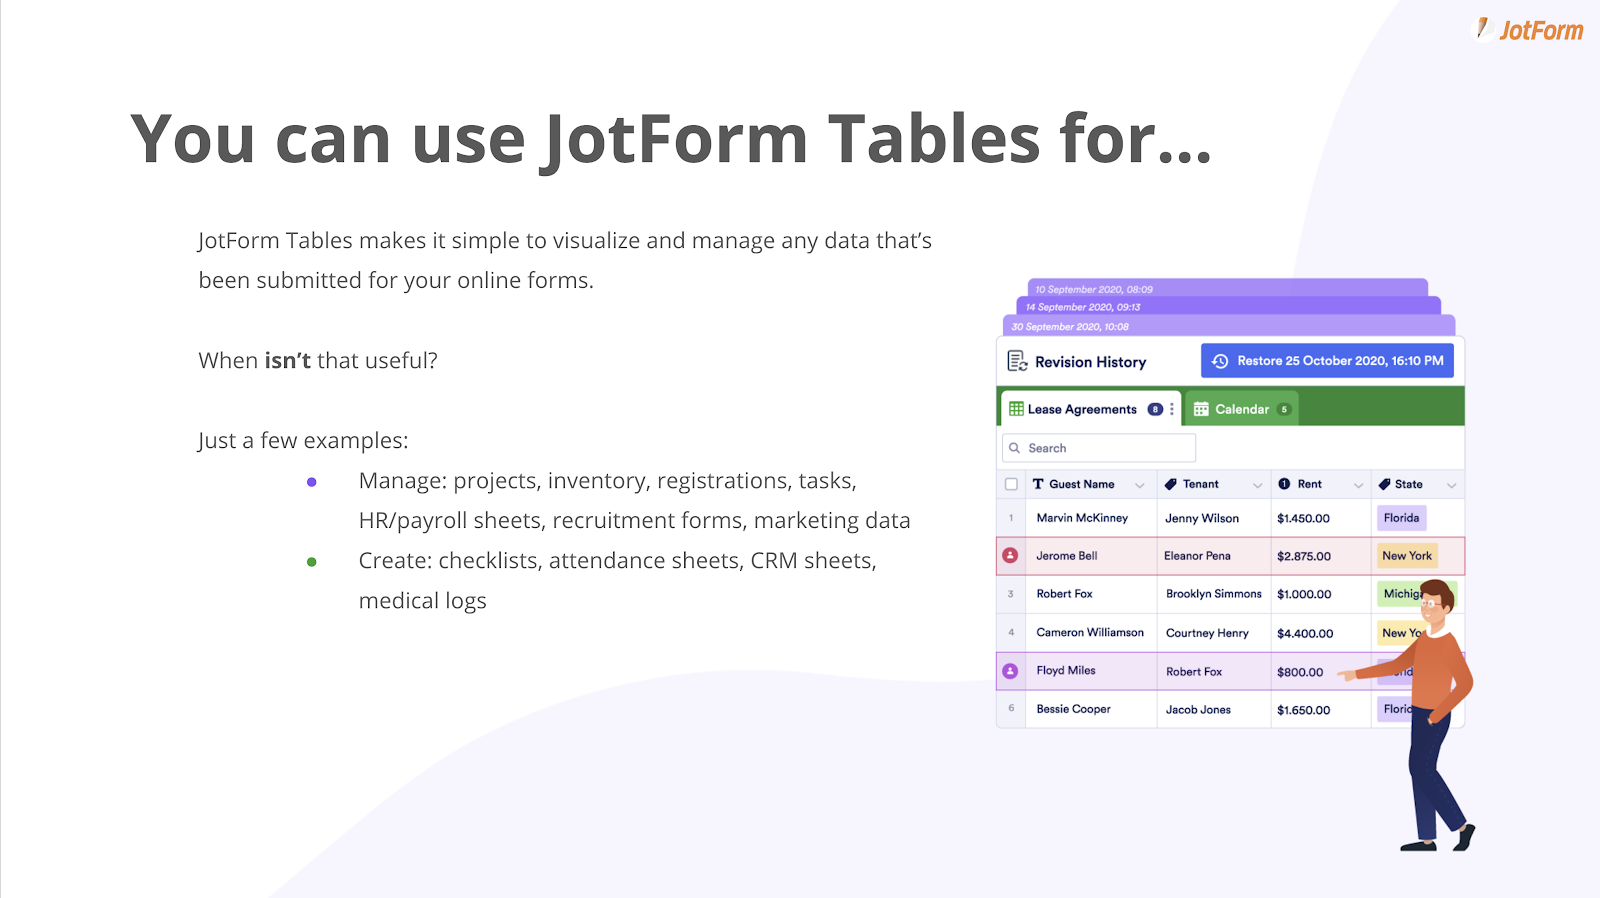
Let’s talk about what comes first, which is determining when Jotform Tables can actually be useful for you, whatever your use case may be. Now this is a little easier said than done not because there’s so few use cases, but really because it’s sort of universal when it comes to managing your data, honestly a bit tricky to imagine scenarios when Tables ISN’T an added benefit when doing so, there are just so many applications of it. If you receive more than one or two submissions for a form, then I’d say, Jotform Tables is going to make your life easier. To break it down though, I’ve separated out some use case examples into two broad categories, one is active data management, and the second is what you can actually create using Tables as sort of an end deliverable.
The first helps with managing or visualizing something you’re collecting data for in real-time. That can be related to inventory, client registration, various projects or tasks, HR-related items, Payroll sheets, onboarding or recruiting, also surveys or marketing data, you name it. Tables will help you keep all this information organized and accessible and trackable for however you need to manage it. The second category demonstrates how you can collate important data for distribution, so whether that’s compiling a checklist, a sheet for attendance or registration, CRM, medical or inventory logs, you can collate and create those lists in CSV, PDF or Excel formats at the click of a button. Again, I used that function to create the email list for this webinar that I uploaded into Zoom, and I think making that data collection easy and shearable is a really important benefit to this tool.
Getting started with Jotform Tables
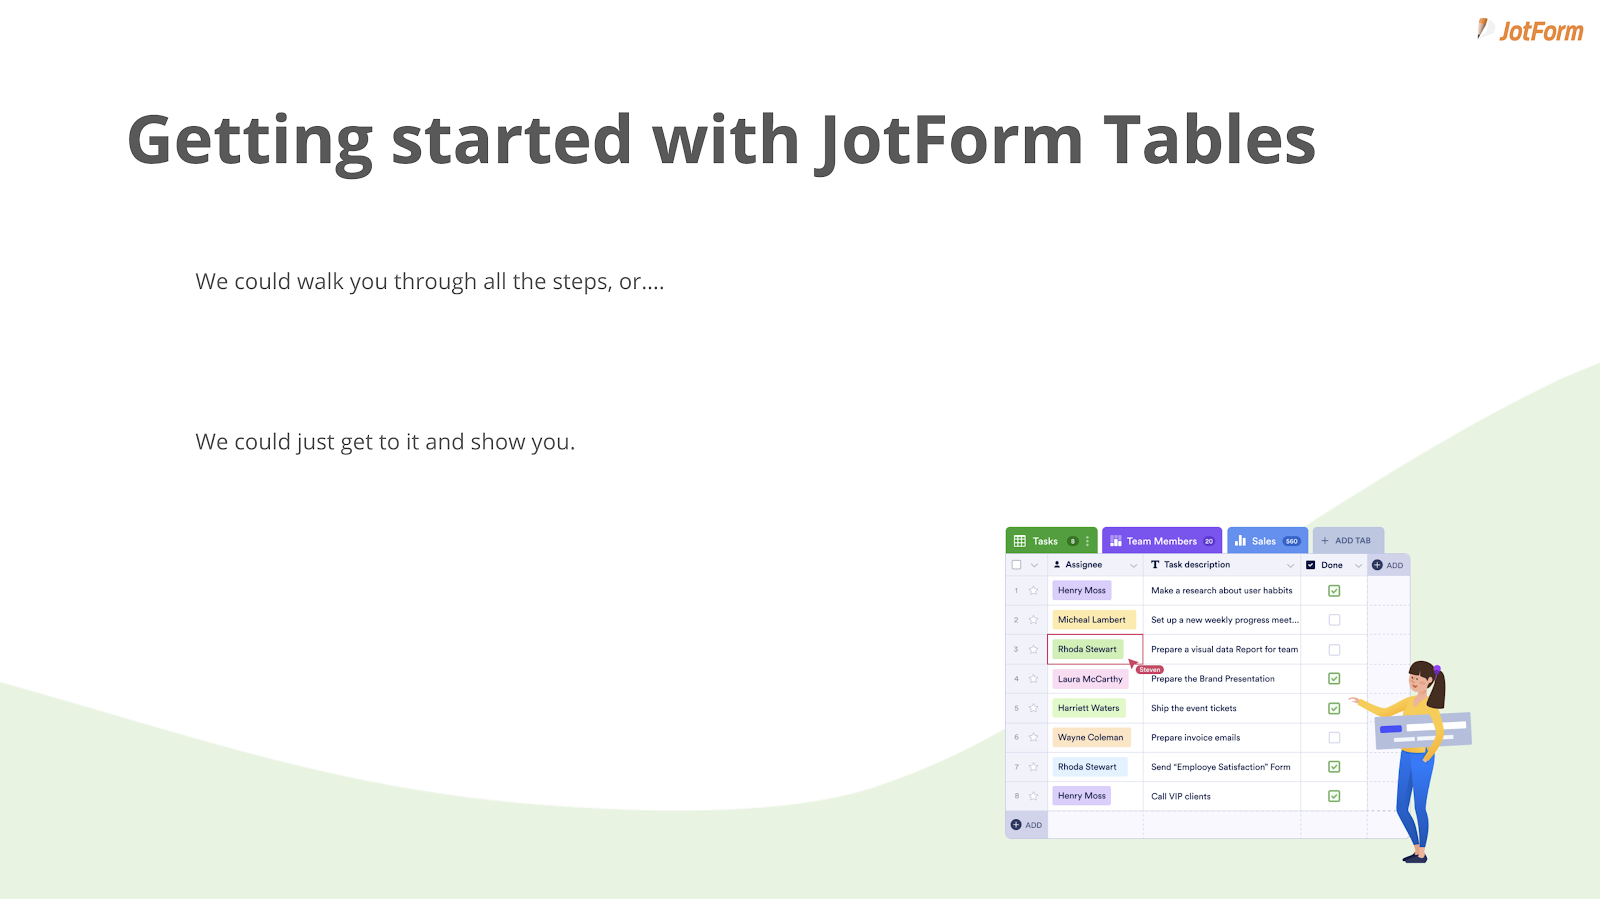
Slide 6 – Getting started with Jotform Tables
But enough talking, let’s get down to showing you how to actually use the product and get set up with it. I could post all the steps here and walk you through them individually, but because it’s really simple, I’d rather cut to the good stuff and just start showing you. For that, with no further ado, I’m going to first pass it over to my colleague, Chad Reid, to walk you through a live demo of Jotform Tables in action. Chad, you can take it away.
Live demo
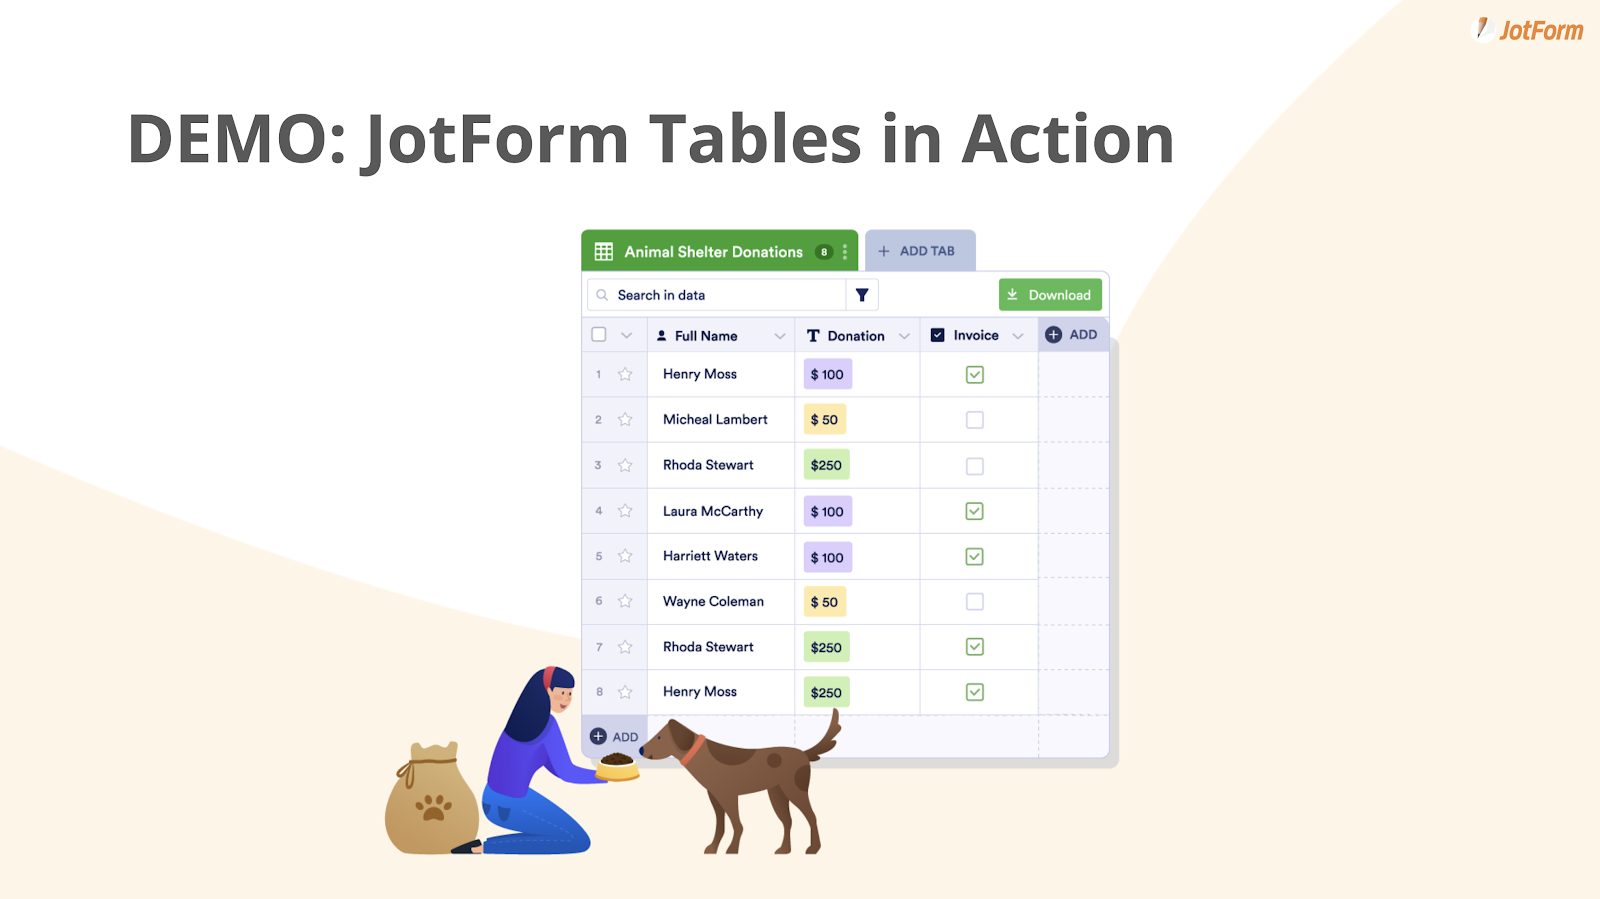
Chad: Awesome, thank you Elliott. Alright everyone, so let’s see how this looks. Some of you may have noticed something new in your My Forms dashboard. And that is up here you now have the option to select My Tables. So this is where we’re going to begin.From here you can create a table, we’ll go ahead and do that.
And you’ll see that we have the option to start with a blank table, use one of our templates (we have over 250 now), or import data from another source, but we’re going to go ahead and start with a blank one. To give you a real life example let’s just imagine that you’re a nonprofit, creating a table for all the projects that you’d like your volunteers to work on. So we’re going to go ahead and call this “volunteer projects.” Create table.
One of the interesting things about Jotform Tables is that you don’t actually need to connect a form to your table, it works completely independently if you’d like, but it does sync beautifully with your forms and we’ll show you that a little bit later. But meantime, let’s go ahead and explore Jotform Tables a little bit. I’m going to be making several different rows for this so we’ll go ahead and make them in advance. Just add those by clicking “Add.” Let’s go ahead and change this up a little bit. We’ll call this [column] “project,” and we’ll go ahead and add a column for project lead, and start filling these out.
Let’s say raking leaves, painting… kind of all over the board here. You get the idea. I’ll make myself the lead for the first couple. Let’s make Elliott the lead for a few.
Awesome, so it’s starting to take shape. After clicking the “Add” button on the far right, as you can see, there’s a number of options or ways to utilize this new column in your table. So let’s think about what we’re going to add to make this particular volunteer project table. We’ll go ahead and add a date, right there.
How about a checkbox to indicate that the project has been completed.
I’m going to show you this single selection option, I think this is really awesome. So imagine we want a time estimation on how long we figure the project is going to take. Let’s call this column “estimated time,” then we answer the options here manually. So, the first one will say one to three hours. We’ll do three to five hours. There we go. We’ll say five to eight hours, and eight plus hours.
We’ll create the column. We’ll go ahead and get rid of the notes.
Cool. You can see it’s already starting to take shape. I’ll go ahead and populate this with some dates. There we go. Adjusting the column width is super easy, just drag it from the top. Make a few of these a little bit more narrow.
All right, now I want to show you something really cool. So imagine you want to populate volunteers to this table using information that you’ve already collected using a different form. So in this case, imagine something like a volunteer application form. So let me pop over to a form that we actually created earlier, and I’ll just kind of show you what we’re working with here.
Just a really bare-bones simple volunteer application. I’ll fill it out as well just for good measure, just to kind of show you what we’re dealing with.
All right, back to the volunteer project table. So we’re going to go ahead and create another column. We’re going to connect that same form that you just saw, we’ll just call this column “volunteer.” We can select from that same form right there. And then we choose which field we’d like to be able to select from. We’ll go ahead with “name.” Just like that, it’s completely connected. All right, now let’s go ahead and see the full roster of volunteers who have submitted this form.
See my entry at the very bottom there. If you want to select multiple, it’s configured to do that. We’ll go ahead and fill in these estimated times as well — I love how they pop with really great color, it gives your table a great look.
Just a couple more volunteers here. So you can see, this is really starting to take shape.
Just like that, we have a full table. As you can see, it just took a few minutes to create. The last thing I want to show you is the share feature. For something like this since it requires visibility and collaboration with other people, I’m going to go ahead and share it, and you can do that right here in the upper right hand corner. I’m going to share this back with Elliott.
There we go. And he’s going to get a notification right in his inbox, and he’ll have access to collaborate on the same doc. So, to show you more of the collaboration capabilities, I’m actually going to pass this back to Elliott, and he’ll show you how this looks when we’re both working on it simultaneously. So with that, Elliott, go ahead and take it away.
Elliott: Awesome, thanks Chad. Hey guys, so it’s Elliott here again, and as Chad just said, he shared this volunteer project table with me. This is the email that I got inviting me to collaborate. So I’m going to click in, and as you can see I have instant access to all the data on the table.
You can see that Chad is actually in the document right now, there’s his avatar, there’s his highlighted cell, and we’re able to collaborate on this simultaneously, which is pretty cool. So I’m going to go ahead and fill out a couple more items here… let’s just say I’ve got some more updates on the activities. So let’s say that raking leaves is completed, that’s awesome — and as you can see, yeah, we can both be in the document the same time making updates, and collaborating together on that.
So that’s one thing to show and I want to switch over to another table now to show you a different functionality of Tables. So here’s a different project, and as you can see, there’s a lot more going on here. This is an employee information chart for a medical facility, and there’s a lot more content here. And what I first want to show you is how we can view this in a different format. Right now, obviously it’s in a table. If we want to see it in, say, a report, we can do that using our Report Builder function that’s built into the tool.
All you have to do is click “Add tab,” and you get all these options for different ways to view your data. We’re going to go with Report View, and then click on the same chart. And we’re going to go with compact report.
And from here you get a premade report with graphs and charts to better and more quickly visualize certain takeaways from your data. You get a pie chart, with the breakout of department, job title, so that’s pretty handy. And there’s actually another way to do this if you go back into the original table — you can click into a column and select “Summarize with a chart.” And here you see the departments broken out in proportion to each other with a pie chart again, that’s just a click away. Their percentages are down here. I’m going to do the same thing with the job title — summarize with chart. And if we even want to change the chart we can, [let’s say a] donut column.
So you get a lot of options to view your data in different ways. That’s not all you can do with it though, I’m now going to take you through a different exercise that will show off some the project management capabilities of Jotform tables, along with how you can filter data to just get specific information and sort by the criteria that you want.
So let’s say for the purpose of this demonstration, for the general medicine and emergency department, everyone who works in those departments needs to take an assessment. Let’s just say this is a regular thing. So if we want to filter to just get those departments, all you have to do is click on the column, and then you click right here “Group by,” and it automatically groups into whatever is sorted in the department column. Okay so, we don’t need cardiology, we want emergency and general medicine.
Again, let’s say that everyone who works in these departments needs to take an assessment, and I need to keep track of who has done it, and what stage they’re at in the process. What I’m going to do is actually add a column here, and I’m going to integrate a multiple selection. We’re going to call this “assessment tracker.” And then you can enter the options you want to toggle in the multiple selection drop down. So we’re going to do completed, registered, and not registered.
Right, now we have it broken out into emergency general medicine, and if we want to denote that someone has completed their assessment, we can just click into this column right here. And we’ll say they’ve completed it. Let’s say that Perl has simply registered. And we can go down the list like this.
So this is a really cool way to keep real-time tabs on a project as it goes, and I can share this actually with Chad, which I’m going to do. Let’s say this is to demonstrate how I’ve set this up and now I’m going to pass it off to my IT staff at the hospital, for instance, who’s going to be in charge of making sure that everyone has completed their assessment. So Chad is going to finish filling out the general medicine department and making sure that everyone here has undergone the assessment.
So with that, to again showcase the collaboration abilities, I’m just going to share this with Chad. He will be my “IT” in this instance. We’re going to share as a collaborator, that’s important, and then send the invitation. He’ll get access to this chart that I’ve made, and he’ll be able to update in real-time this assessment tracker as I need him to.
So again, this kind of showcases the project management capabilities, along with how you can filter large quantities of information by a certain criteria, as we’ve shown. So with that, I’m going to pass it back over to Chad, actually, so he can show you filling this out from his end, and then he has one more demonstration to show you guys. So Chad, you can take it away.
Chad: Awesome. Thank you, Elliott. Now we’re going to take a look at the employee information table that was just shared with me, and we’re going to complete the assessment tracker.
I’ll find the general medicine grouping, and we’ll find the assessment tracker column on the right. Just a few clicks, and you can indicate progress for each of these rows. This is good to go.
So just one last thing. We received a few questions in advance asking about the calendar function. So I want to show you how that looks on a different table.
We had this great hairstyling appointment scheduler table created from an appointment form, and it has dates scheduled in advance from hypothetical clients. So if we click “Add tab” on the top, we’ll be presented with a number of view options, we’re going to go ahead and select calendar view. We’re going to connect it to that same form right there, and here you can see all of the scheduled appointments, displayed on a calendar as colorful boxes that you can also click on to get more details.
There you have it. So that concludes the demo portion of our webinar today, and I’m going to pass it back to Elliott to kick off our QA.
Questions and Answers
Elliott: Great, thank you, Chad. As he said we’re now going to switch to the Q&A portion of our webinar, this will be your last chance to submit a question if you haven’t done so already. We’ve already got a couple in the queue, I see. So we’re just going to take the remainder of our time today and answer a few questions that have come in.
Already in advance, Derek asked if you’d be able to use this data with his existing forms. The answer to that is yes, if we didn’t make it clear in the demo you can access the data using tables from any existing or previous forms, you don’t need to make a new form since [before] Tables was integrated into our platform to be able to use the tool. It will work with any historical form you have in your account.
Emily looks like asked if she doesn’t want her entire committee having access to her Jotform account, is there a way for them to only see and edit the Jotform table itself. Also yes to that, as we showed briefly in the demo, you can share with only specific people and email addresses. When you offer someone to collaborate with you on the document, you don’t actually share your account, you just share that particular table with the particular people that you want to. Or you can toggle to share with an organization, and then anybody with whatever end email addresses like @JotForm.com will be able to share — or you can just toggle specific people. So the answer that is certainly yes.
Joanna asked if it’s possible to analyze data by gender number, age — aka country pull data from forms completed by her students, for example, if she wants to know how many students are males versus females. So the answer to that is also yes. Again, as we kind of showed in the demo, you can toggle by group by on the column and then you can single out whatever criteria you want to filter by. So if you just want to find those that are male or filter out by gender, number, age, it’s super easy to do that using the “Group by” action on the column, which is a really great integration with our tool.

Send Comment:
8 Comments:
April 20, 2022
Olá achei muito criativa e eficiente está ideia de formatar e deixar pré pronto para o usuário e diversas áreas de negócios
April 4, 2021
How is JotFrom better than TypeForm?
November 2, 2020
Is the event in English?
October 29, 2020
thank you very much
October 28, 2020
WOW.
October 28, 2020
Current issue - why is it that Jotforms when clicked by user - open on landing page instead of link? We have many issues with this and recipients receive message that site is unreliable and unsafe to open. Given this what confidence should we have that new product will be reliable given the investment required to learn?
Will there be solid in person support?
Thank you
October 28, 2020
Thanks for time
October 27, 2020
Will there be a recording for those who can't make it? Looks like the webinar is at 3am Singapore time.