Which one is right for you?
- Choose Google Sheets: Sheets is the best option if you’re new to working with spreadsheets, want a free app, need to collaborate with multiple people, have easy-to-use sharing controls, and need deep integration with other Google Workspace apps, such as Forms or Docs.
- Choose Microsoft Excel: Excel works best if you work in finance, data analysis, or any role that handles large datasets and complex models; need advanced spreadsheet automation and data transformation; prefer to work offline; and need deep integration with the Microsoft 365 ecosystem.
When you create a new spreadsheet in Google Sheets or Excel, it’s full of possibility. The data is clean, and the formulas work. But as the file grows and the logic becomes more complex, each software may have limitations.
Google Sheets’s user-friendly interface hides performance limitations and lower analytical power for serious work. And although Excel has powerful functionality and a long-standing reputation, its collaboration experience requires careful setup and management, and its web version is a far cry from the desktop app.
By the end of this article, you’ll know exactly how each tool performs. For those using Google Sheets or Excel to gather data, automate tasks, or structure your workflows, we’ll also introduce you to Jotform. Its software suite handles these applications in a way that neither Excel nor Sheets can.


Google Sheets vs Microsoft Excel at a glance
Google Sheets | Excel | |
|---|---|---|
| Available on | Web, iOS, Android; same features everywhere | Desktop (Windows and Mac, all features), web (free but limited), iOS, Android |
| Free tier | All features (formulas, collaboration, version history, Apps Script automation, up to 10 million cells); no Gemini | Excel for the web: Core editing and coauthoring abilities; no Visual Basic for Applications (VBA), Power Query, Power Pivot, Python, or Analysis ToolPak; 50 megabyte (MB) file cap |
| Collaboration | Up to 100 simultaneous editors; link-based sharing; four permission tiers (owner, editor, commenter, and viewer); cell comments; full version history | Coauthoring via OneDrive and SharePoint only; two permission tiers (view and edit); version history for cloud-stored files only |
| Data and performance | Up to 10 million cells; performance degrades noticeably at hundreds of thousands of rows | Approximately 17 billion cells (theoretically); handles large datasets more efficiently |
| Analytical depth | Good analytical capabilities for day-to-day spreadsheet usage, unique internet-connected tools, unique functions (QUERY, GOOGLEFINANCE, and IMPORT family) | More powerful analytical capabilities with Power Query, Power Pivot and Data Analysis Expression (DAX), Python in Excel, LAMBDA and LET, and Analysis ToolPak |
| Offline access | Via Chrome only; requires manual setup | Native desktop app; no setup required |
| Pricing | Free (with a Google account); Business Starter plan ($8.40/user/month) | Free (Excel for the web, limited); Microsoft 365 Business Basic plan ($7.20/user/month); desktop Excel requires a Business Standard plan ($15/user/month) |
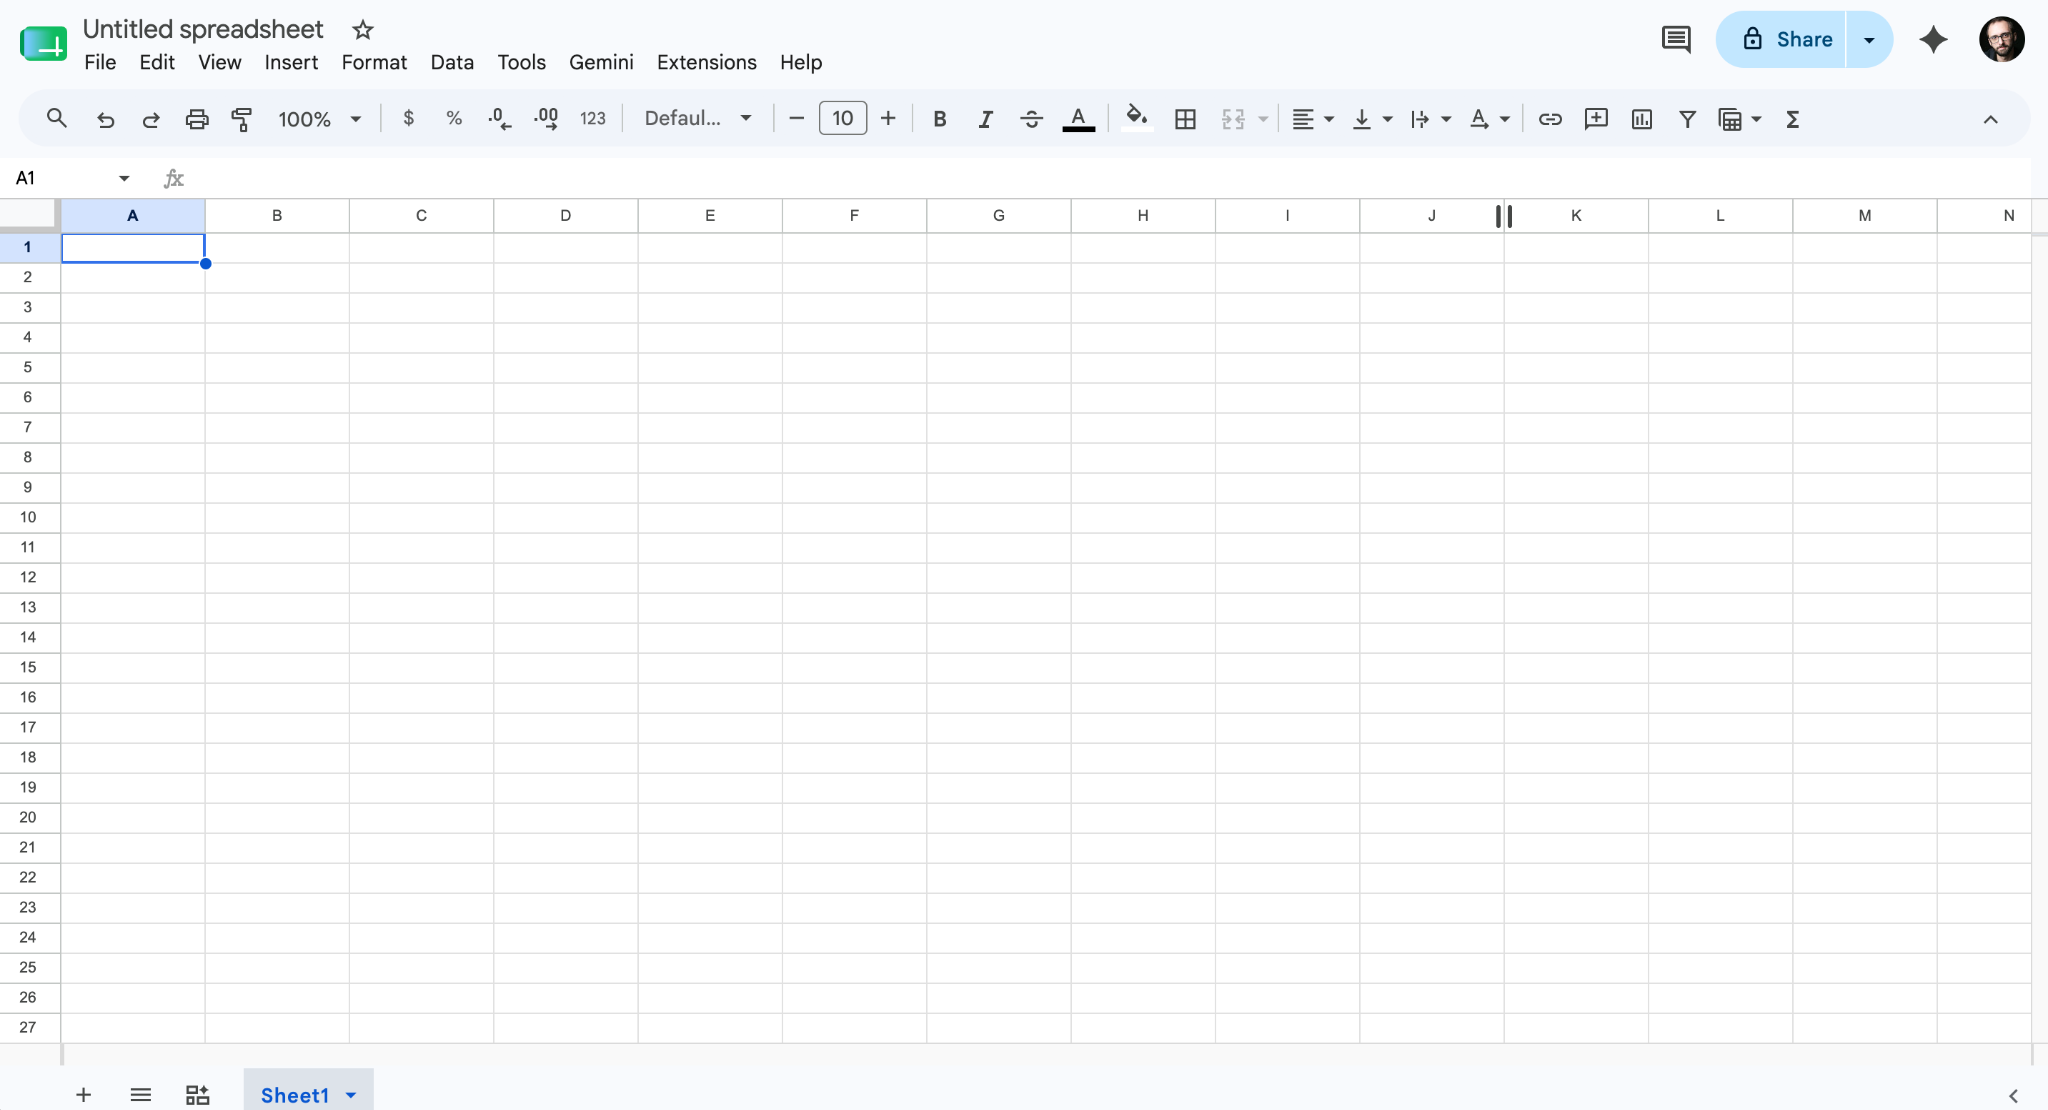
Google Sheets
Google Sheets is Google’s cloud-based spreadsheet app and part of the Google Workspace suite. Accessible via a web browser, it stores files automatically in Google Drive and allows multiple users to edit the same file in real time. It has all core spreadsheet calculation features, as well as internet-connected tools for gathering data and placing it in cells.
In 2006, 20 years after it was launched, Sheets is the default spreadsheet for many businesses. Google doesn’t publish exact numbers, but Google Workspace reported having 9 million paying businesses in 2023. The product has evolved since its early days. It has smarter formulas, its Looker Studio integration, and the Google Apps Script for automation. And Google recently built Gemini features into the sidebar and directly into cells.
Instantly populate your spreadsheets with form data
Stop playing mediator between your data and your spreadsheet. With the Jotform-Google Sheets integration, every form submission becomes a new row instantly. Whether you’re tracking leads or managing inventory, let your data organize itself so you can spend 2026 making decisions instead of inputting data.
What makes Google Sheets unique?
Cloud-native infrastructure: Sheets has no desktop app. It runs in the browser, so your file is accessible from any device, not trapped on your work laptop. Files live in Google Drive, and you can use Chrome to make them available for offline editing if necessary.
Real-time collaboration built in from the start: You can share a link to your file and set permissions for each user. Up to 100 people can edit at the same time. Other users’ edits are indicated by the colored outlines of selected cells, and changes appear instantly to everyone. You can attach a comment to any cell; notify a teammate by typing their name with the “@” symbol. The version history records every change with a time stamp and the author’s name; revert to any previous version if someone makes a mistake.
Deep integration with Google Workspace: If you’re already in the Google ecosystem (using Gmail and Google Calendar, Docs, and Drive), Sheets fits naturally. Google Forms feeds data directly into Sheets. Google Docs can embed live Sheets data.
Live web data and cloud automation: The IMPORT function family lets you pull data directly from HTML pages, XML feeds, and other spreadsheets. GOOGLEFINANCE gives you live stock prices and financial data inside a cell. Google Apps Script runs JavaScript-like automations entirely in the cloud (and they keep running even when your laptop is closed).
Google Sheets is hard to beat for a browser-first, collaborative spreadsheet experience, but you’ll feel its limitations as you add data and need more complex analyses. If you’re there already, explore more Google Sheets alternatives.
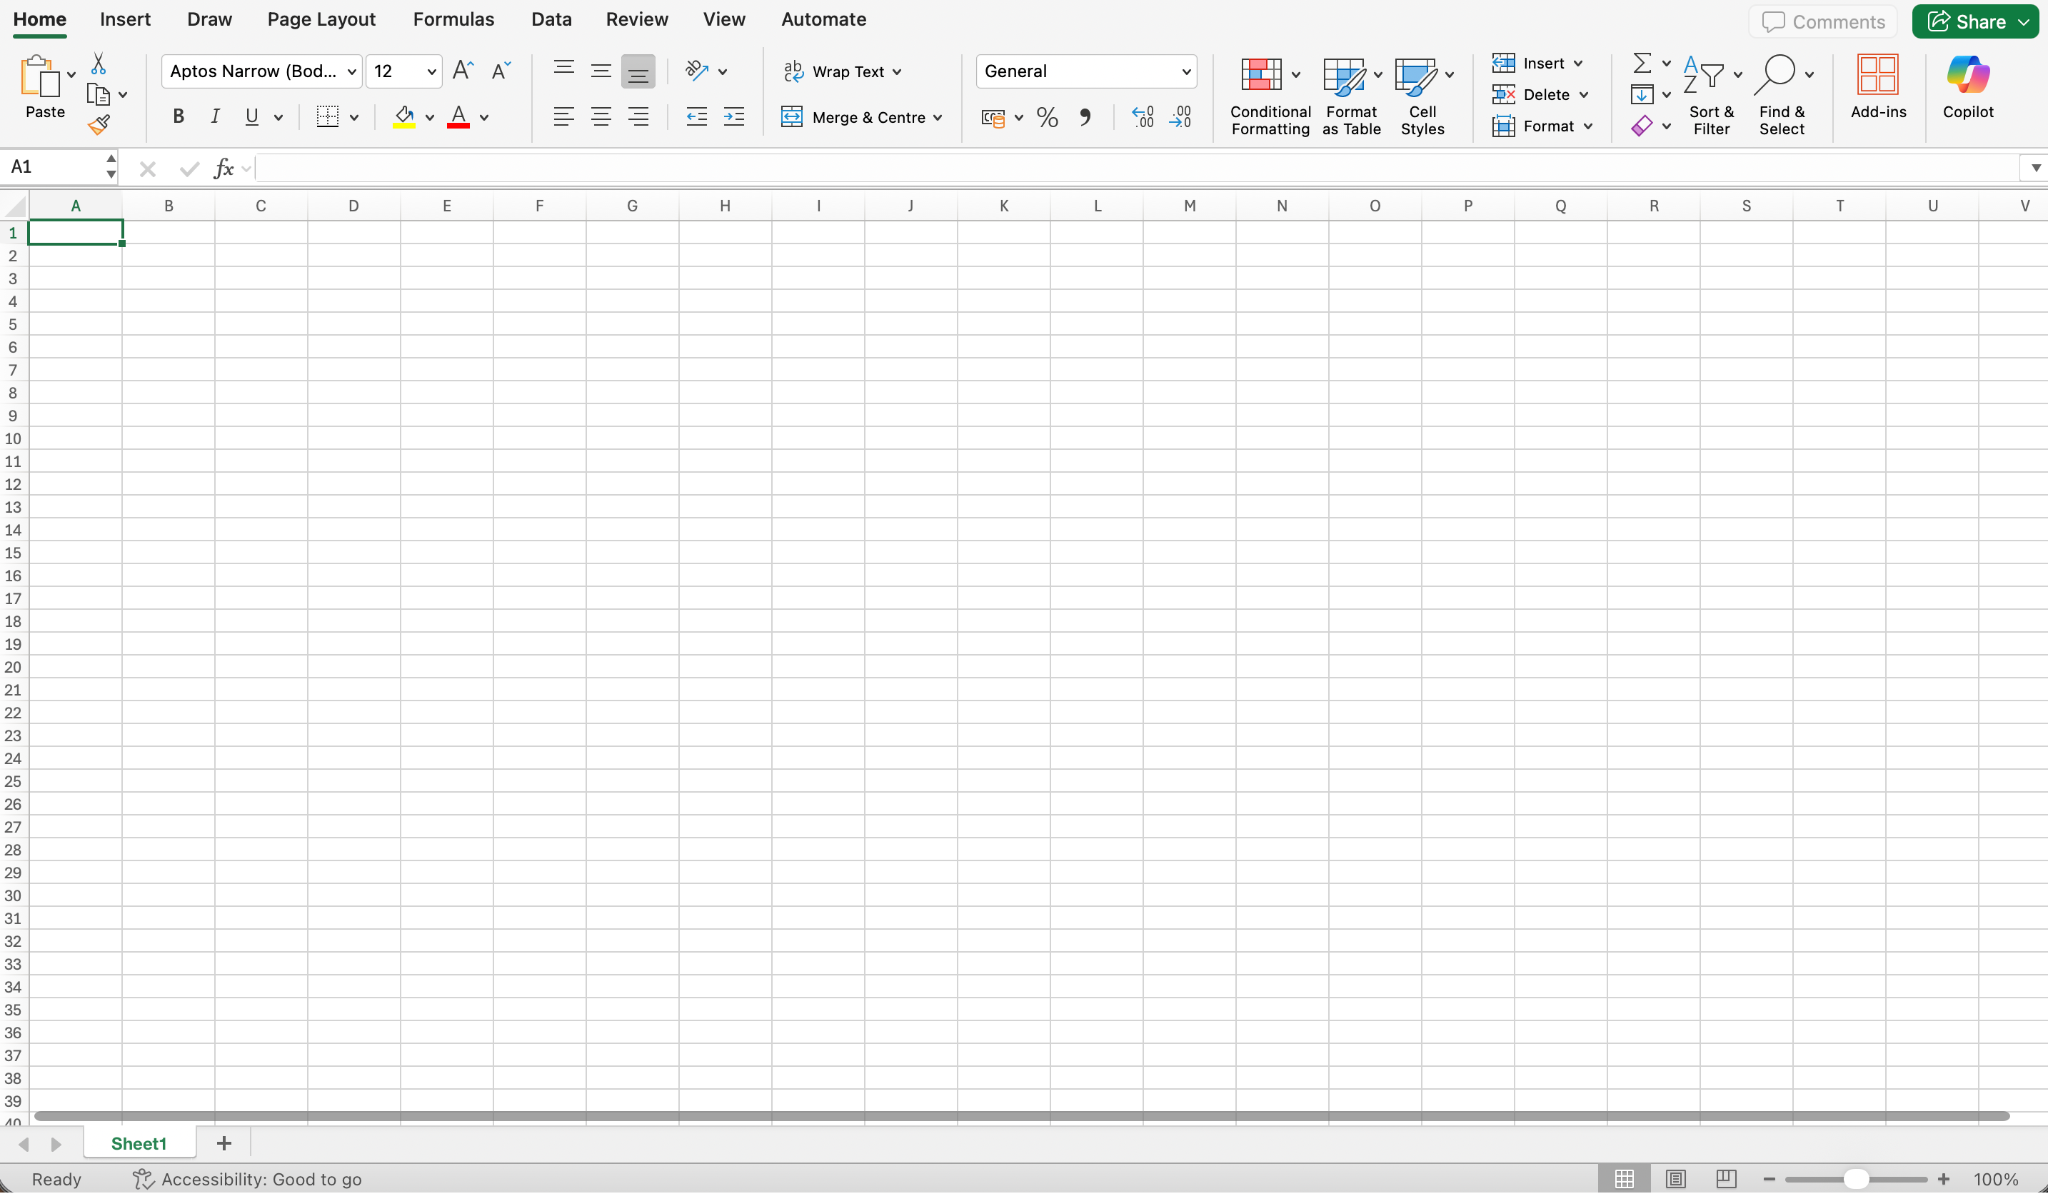
Microsoft Excel
Microsoft Excel is a spreadsheet application developed by Microsoft. Its analytical depth (strong data transformation, data modeling, and programmable automation) makes it a standard tool for finance, data analysis, and enterprise teams. You can use it as a desktop app on Windows and macOS, and cloud collaboration is available through OneDrive and SharePoint.
Excel launched in 1985 and is still the core spreadsheet tool of many large organizations that rely on VBA macros, Power Query pipelines, and financial models. It has accumulated an enormous amount of features across versions. Recent updates include Copilot AI integration, Python in Excel, and continued expansion of the Power Platform ecosystem connecting Excel to Power BI, SharePoint, and Azure.
Stop wasting hours on manual data entry
Create a seamless bridge between data collection and data analysis. With the Jotform-Microsoft Excel integration, your form responses flow directly into your spreadsheets in real time. Connect your form, and watch the rows fill themselves.
What makes Microsoft Excel unique?
Desktop-based power: The most powerful version of Excel runs natively on your machine. So you benefit from faster processing for large files, offline access without setup, and execution of heavy operations without having to power a browser. If you want to collaborate in the cloud, you can through OneDrive and SharePoint.
VBA and programmable automation: VBA is Excel’s built-in scripting language. Since its release in 1993, it’s still the most powerful tool for automating repetitive spreadsheet work, such as custom functions, interactive dashboards, report generation, and batch processing.
Power Query and Power Pivot: These two tools change what “spreadsheet work” means. Power Query connects to more than 200 data sources, importing, cleaning, and reshaping data without formulas. Power Pivot lets you model that data, connecting multiple tables with defined relationships; after using Power Pivot, you can write DAX formulas for analytical calculations such as year-over-year growth, running totals, and custom key performance indicators.
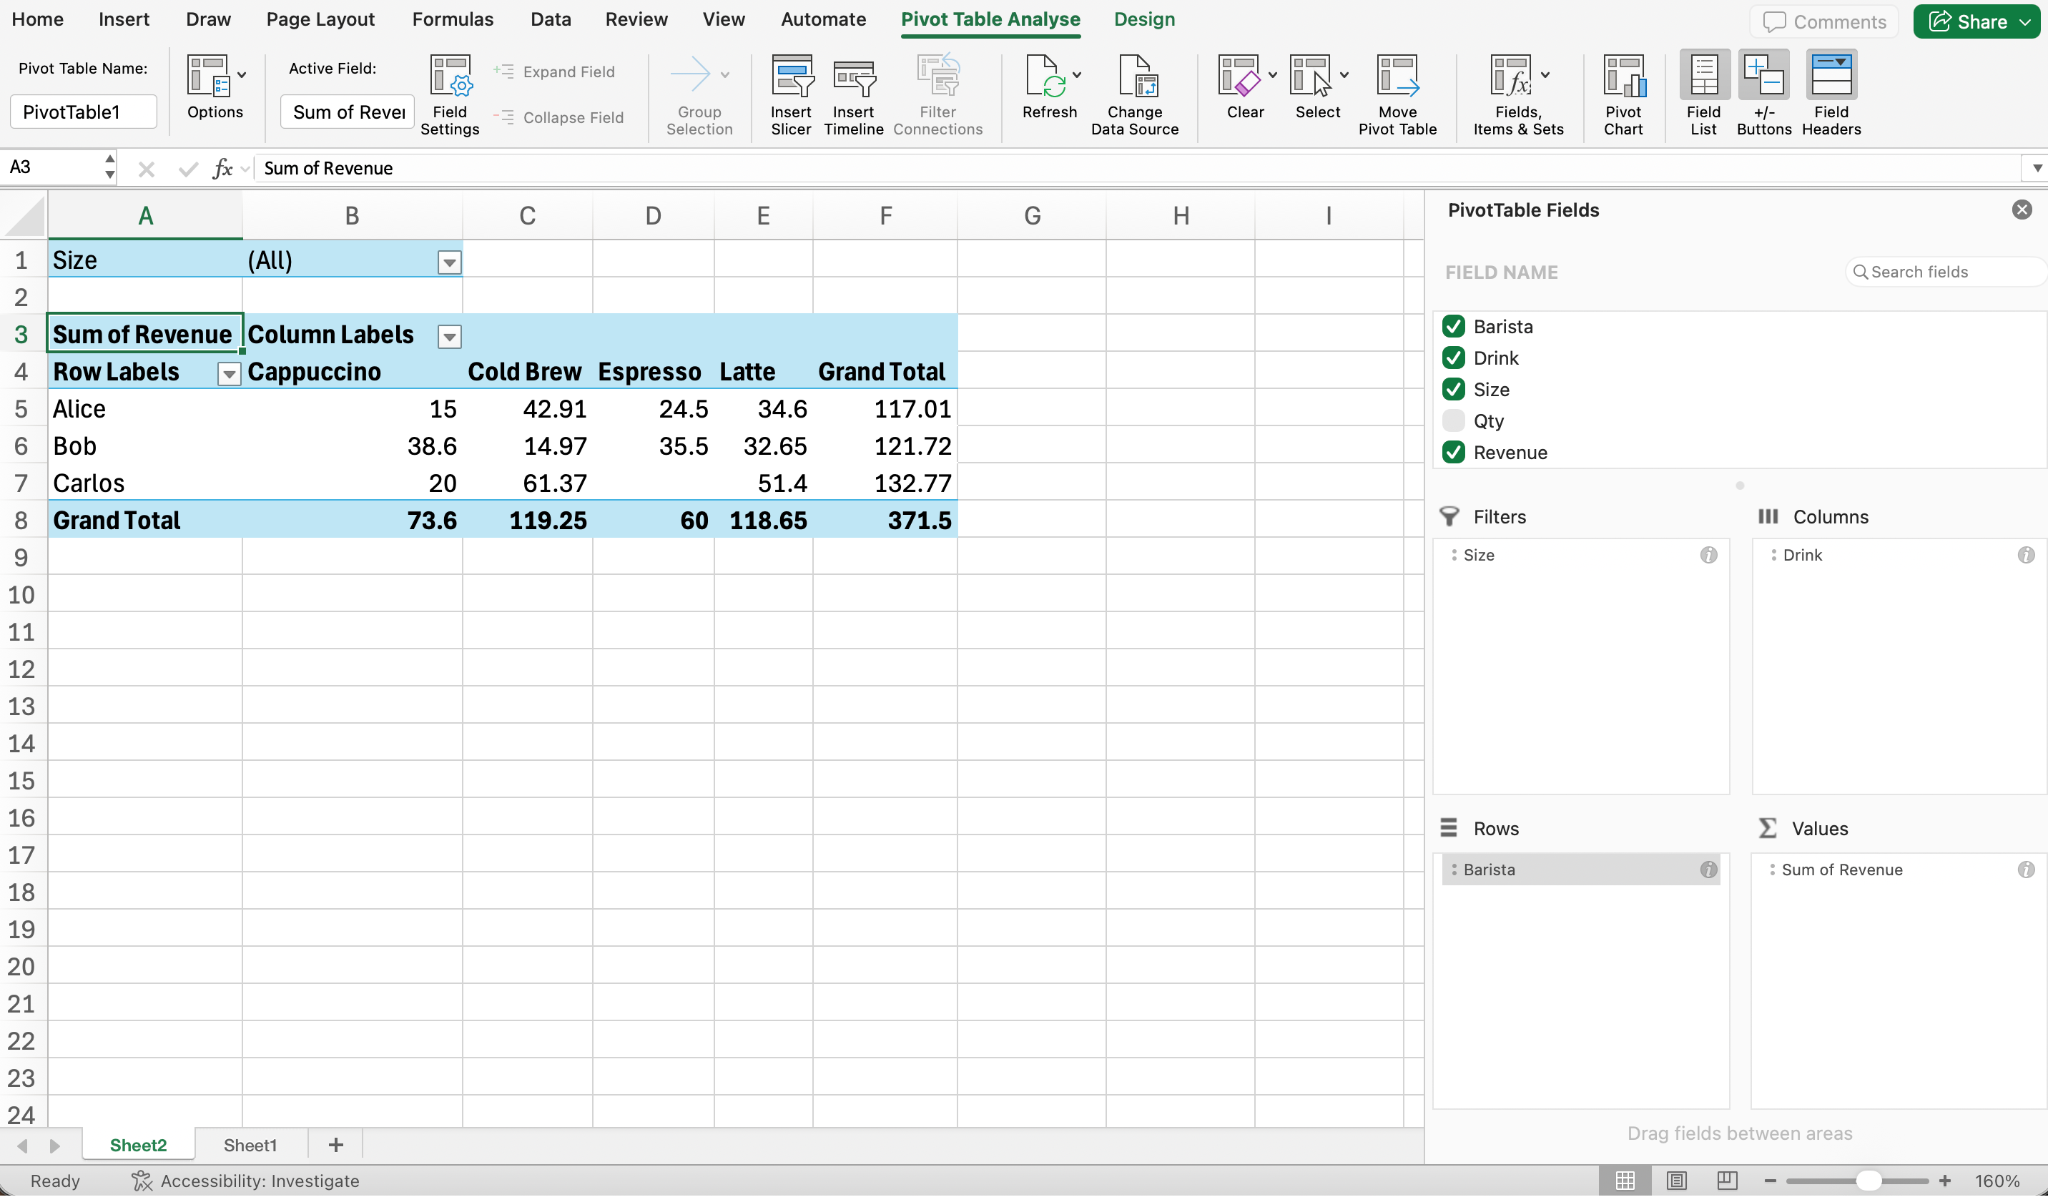
Pivot tables: Excel’s pivot tables summarize, group, filter, and cross-tabulate large datasets interactively and give you a high level of control over your data and its presentation.
Microsoft ecosystem integration: Excel connects natively to Power BI for data visualization, SharePoint and OneDrive for collaboration, Azure for cloud data, and external databases. Current use of Microsoft infrastructure (and most enterprise IT businesses are using it) reinforces Excel’s benefits considerably.
Excel remains the spreadsheet to beat, but that doesn’t mean it’s the right fit for your workflow. If the cost and complexity don’t match your needs, there are plenty of robust Microsoft Excel alternatives worth looking at.
Excel desktop app vs Excel for the web: What’s the difference?
The feature set is different depending on where you use Excel. The free browser-based version (Excel for the web) is useful for viewing files, light editing, and collaborating with people who have paid plans and share files with you. However, it lacks the full capabilities of the Excel desktop app.
Excel desktop app (Microsoft 365) | Excel for the web (free) | |
|---|---|---|
| VBA macros | ||
| Power Pivot/Power Query | ||
| Python in Excel | ||
| Statistical tools (Analysis ToolPak) | ||
| File size limit | No hard cap | 50 MB |
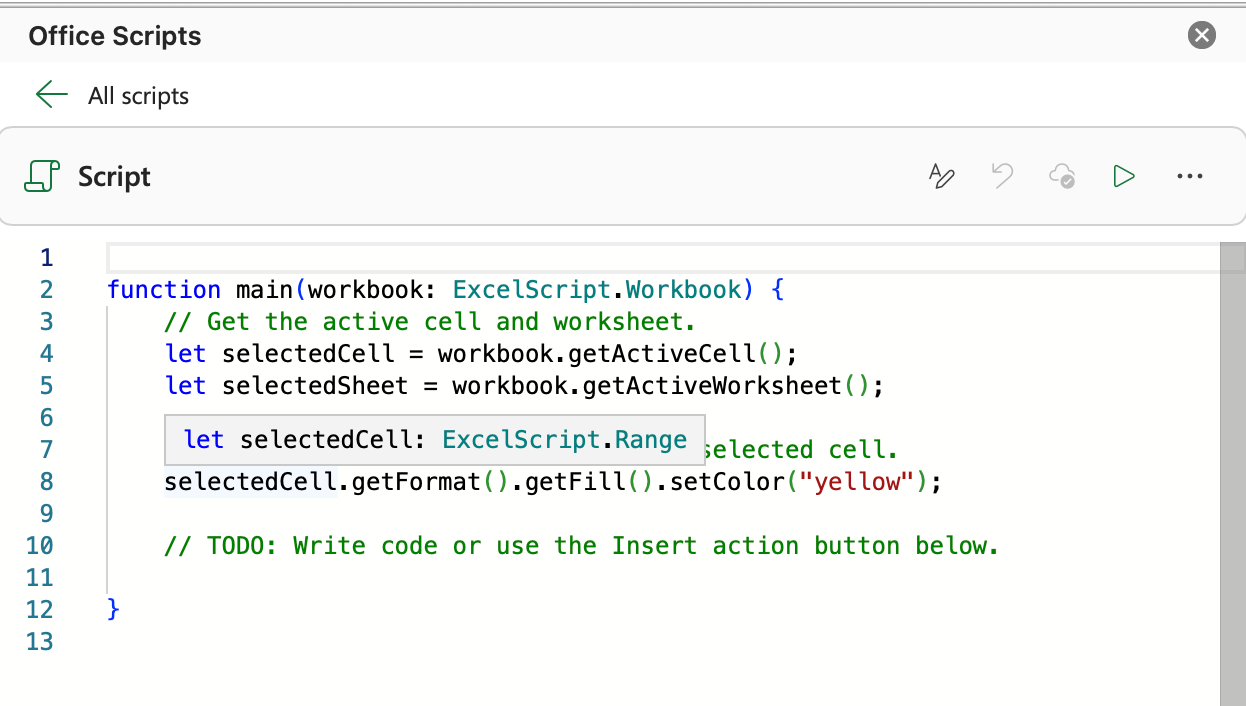
| Office Scripts (cloud automation) | Included in qualifying commercial Microsoft 365 plans | |
| Real-time coauthoring | ✓ (OneDrive/SharePoint) | ✓ (OneDrive) |
| Cost | $15/user/month | Free |
For the rest of this article, “Excel” refers to the desktop version, unless the text states otherwise.
Google Sheets vs Microsoft Excel: A head-to-head comparison
Jump to a section
Ease of use
On first impression, Google Sheets wins: All you have to do is open it in a browser, and even if you’ve never touched a spreadsheet before, you can be productive in minutes. The interface is clean, the toolbars are intuitive, and the dropdown menus are streamlined. Despite this smooth initial experience, you’ll still experience a learning curve if you want to use formulas and functions, and there aren’t a lot of keyboard shortcuts to accelerate your workflow.
Excel is more intimidating for new users. The Ribbon menu has a bad reputation: The tab changes, depending on what you’ve selected, so the button you need isn’t always where you last saw it. The Ribbon reflects Microsoft’s effort to combine many features into a single app over many decades.
That confusion doesn’t last, however. Once you’re past the initial learning curve, Excel is easy to learn. It has plenty of useful keyboard shortcuts, so power users can navigate the desktop app almost exclusively with keys, barely using the mouse.
Setting up templates in both alternatives can take time but make the tools easy to use. Excel wins on template amount, polish, and variety, but Sheets covers everyday needs better.
Bottom line: If you’re an absolute beginner, start with Google Sheets. If you’re coming back to Excel after years away, stick with it: Your muscle memory returns faster than you expect.
Free tier
Google Sheets’s free plan is essentially the full product, including formulas, collaboration features, version history, Google Apps Script automation, and up to 10 million cells. The only thing missing from the free tier is Gemini, which is bundled into paid Google Workspace plans.
Excel for the web is free, but it’s not the same as Excel desktop. It lacks most of the advanced features, such as Power Query and VBA. You get core formula work and real-time coauthoring, which are useful for viewing files and making light edits, but not for deep analysis.
Bottom line: For free spreadsheet work, Google Sheets is a clear winner. Excel for the web is not a standalone tool.
Mobile apps
Both tools treat mobile functioning as a companion to the desktop experience, not a replacement. This makes sense, because serious spreadsheet work on a mobile device isn’t possible. But mobile capability is great for viewing, making light edits, and staying on top of data when you’re away from a computer.
When it comes to user experience, Google Sheets has an edge over Excel. You can access formatting tools without hunting through menus, and making a file available offline is straightforward (Settings > Make Available Offline, or via Drive global settings). And you don’t need a paid plan to access anything.
However, Excel preserves complex formatting more accurately and handles formula editing a bit better. You can use the mobile app for free to create, view, and edit on devices with screens smaller than 10.1 inches. If you’re using a larger screen (such as a tablet or an iPad), you can view files, but you’ll need a Microsoft 365 subscription to edit them.
Bottom line: The mobile experience on Google Sheets and Microsoft Excel isn’t a deciding factor.
Collaboration and sharing
Google Sheets has a structural advantage here: When you create a file, it’s already in the cloud. All you have to do is share it via email or link and set the user’s permissions.
Sheets has four permission tiers: owner, editor, commenter, and viewer. Google Workspace account users receive warnings when sharing with external users, but this is a useful governance feature, especially if you’re working with sensitive files.
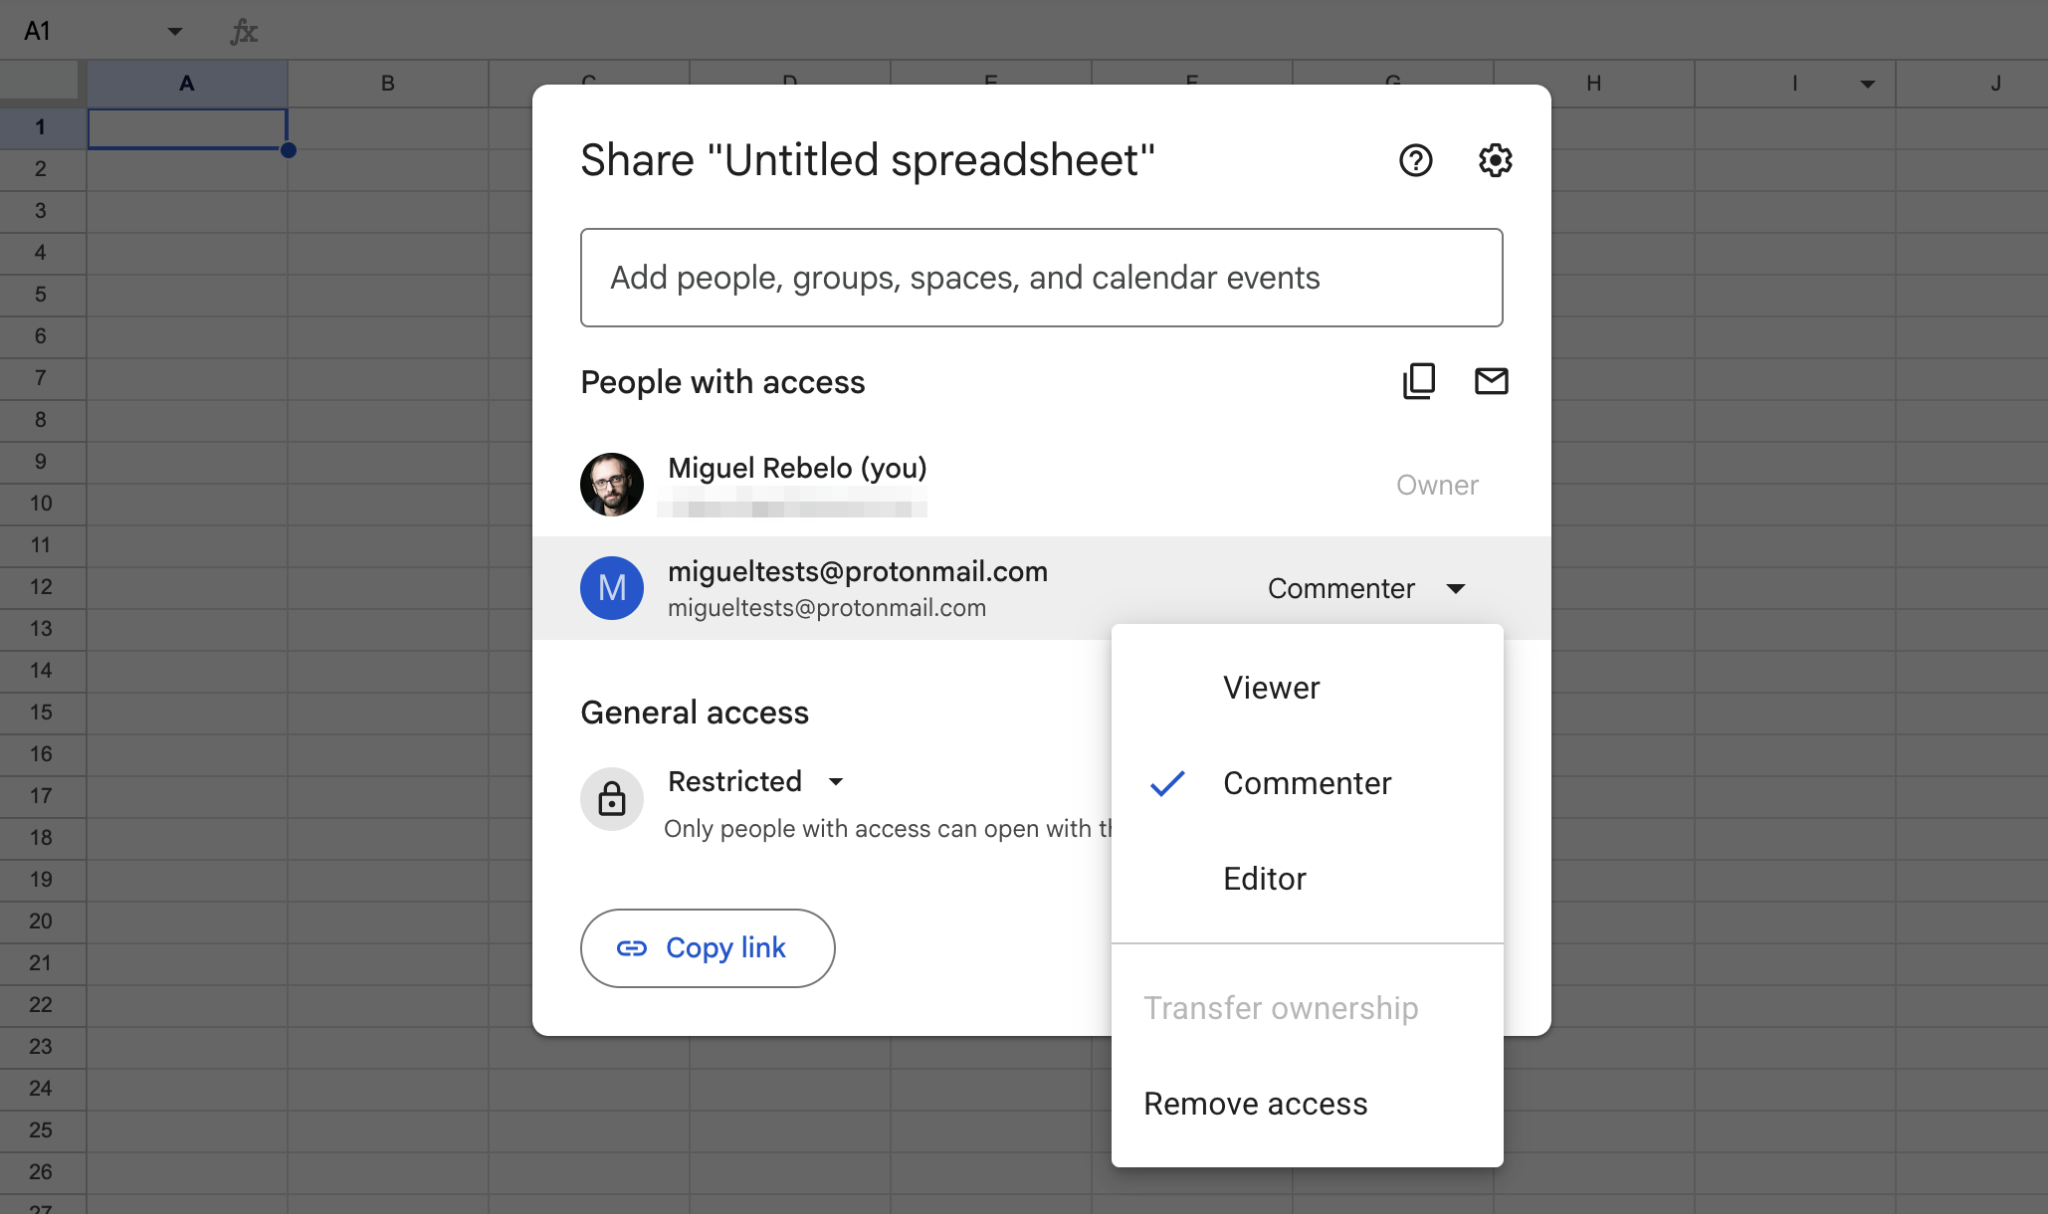
You can also name specific versions in version history, view the exact changes made in each, and reinstate any previous version. Comments attach directly to cells, and you can mention collaborators with the “@” symbol to call their attention to specific elements.
Excel also has collaboration features, but using them involves more friction. With local Excel files, collaboration is available to only one person at a time. To do so, you have to upload your file to OneDrive or SharePoint in a supported format, so you’d also have to remove password protection and any legacy ActiveX functionality first.
Your file is ready for multiplayer use once it’s in the cloud, but reported sync conflicts are more common than in Sheets. Sometimes a teammate’s edit doesn’t appear until you refresh the page. Version history is available only for cloud-stored files; local files have a crash recovery snapshot, but not a proper history.
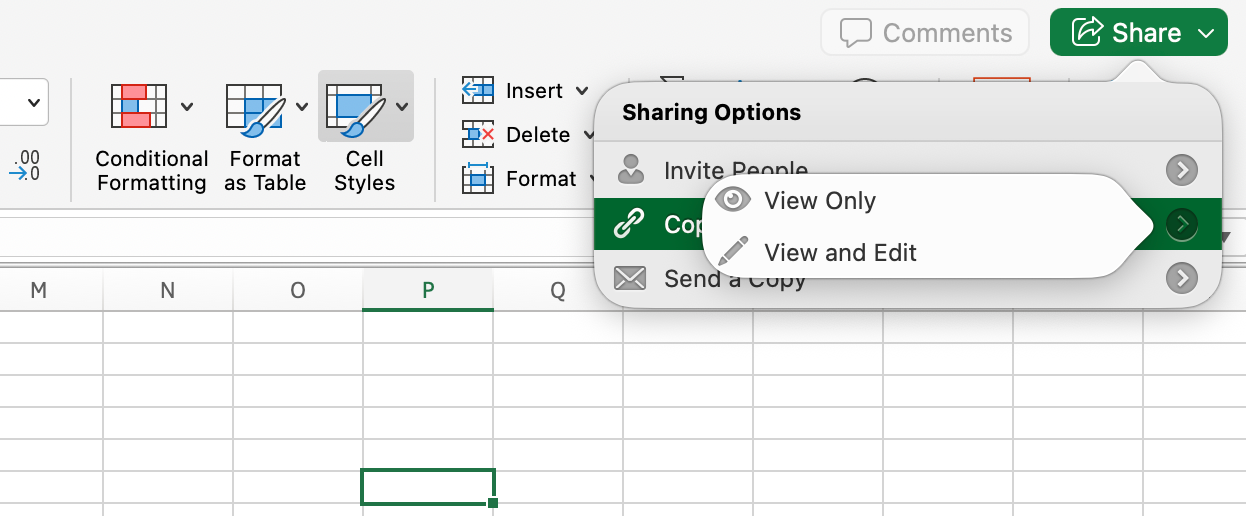
Excel has only two permission tiers: Can View and Can Edit. There’s no commenter-only role, as there is in Sheets.
Bottom line: For any collaboration that involves more than one person, Google Sheets is the better option. Excel’s cloud collaboration is functional, but Sheets was designed for it.
Formulas, analyses, and spreadsheet power
Both tools feature over 450 functions. Both cover the expected formulas: lookup, aggregation, conditional logic, and text manipulation. You’ll notice the gap between Sheets and Excel when you need to do serious analytical work. This is where Excel decisively pulls ahead.
Excel’s edges
- LAMBDA and LET: LAMBDA lets you build reusable custom functions without writing code. You can define the function once and then use it like a native formula anywhere in the workbook. LET names intermediate calculations within a formula, reducing repetition and making complex formulas easier to read. Sheets has no direct equivalents.
- Statistical and financial depth: Excel’s Analysis ToolPak adds native functions for analyses such as t-tests, z-tests, analyses of variance, and regression analyses. Again, Sheets has no equivalent.
- Power Query and Power Pivot: Power Query turns Excel into an extract, transform, load tool, helping you move data from multiple sources into a single data warehouse, so you can refer to it later as your single source of truth. Then you can use Power Pivot to model the data, add formulas to make calculations, and analyze it to track growth, profit, or running totals.
- Python in Excel: Run Python code directly inside cells with the formula =PY(). You can use NumPy, pandas, and the broader Python data science stack without leaving Excel.
Google Sheets’s edges
- QUERY: This SQL-like function lets you filter, group, sort, and aggregate data within a formula. It’s a great tool for reporting without pivot tables.
- GOOGLEFINANCE: You can pull live stock prices, exchange rates, and financial data, for example, directly into cells without using API keys or scripts.
- IMPORT family: IMPORTHTML, IMPORTXML, IMPORTRANGE, and IMPORTFEED let you pull data from web pages, XML feeds, other Sheets files, and RSS feeds. It’s a light web-scraping toolkit that you don’t need to write code to use.
Despite these differences, both tools are slowly converging in functionality as they try to retain users and lock them into a single spreadsheet solution.
In terms of data limits and performance
- Google Sheets supports up to 10 million cells.
- Excel’s theoretical limit is around 17 billion.
In practice, performance is the more noticeable ceiling: Sheets starts slowing as files grow into the hundreds of thousands of rows, especially with complex formulas. Excel handles larger datasets more efficiently and degrades more gracefully before performance becomes a problem.
Bottom line: For most everyday business use, both tools get the job done. For large datasets, advanced statistical work, financial modeling, or multitable data analysis, Excel is stronger.
Automation and integrations
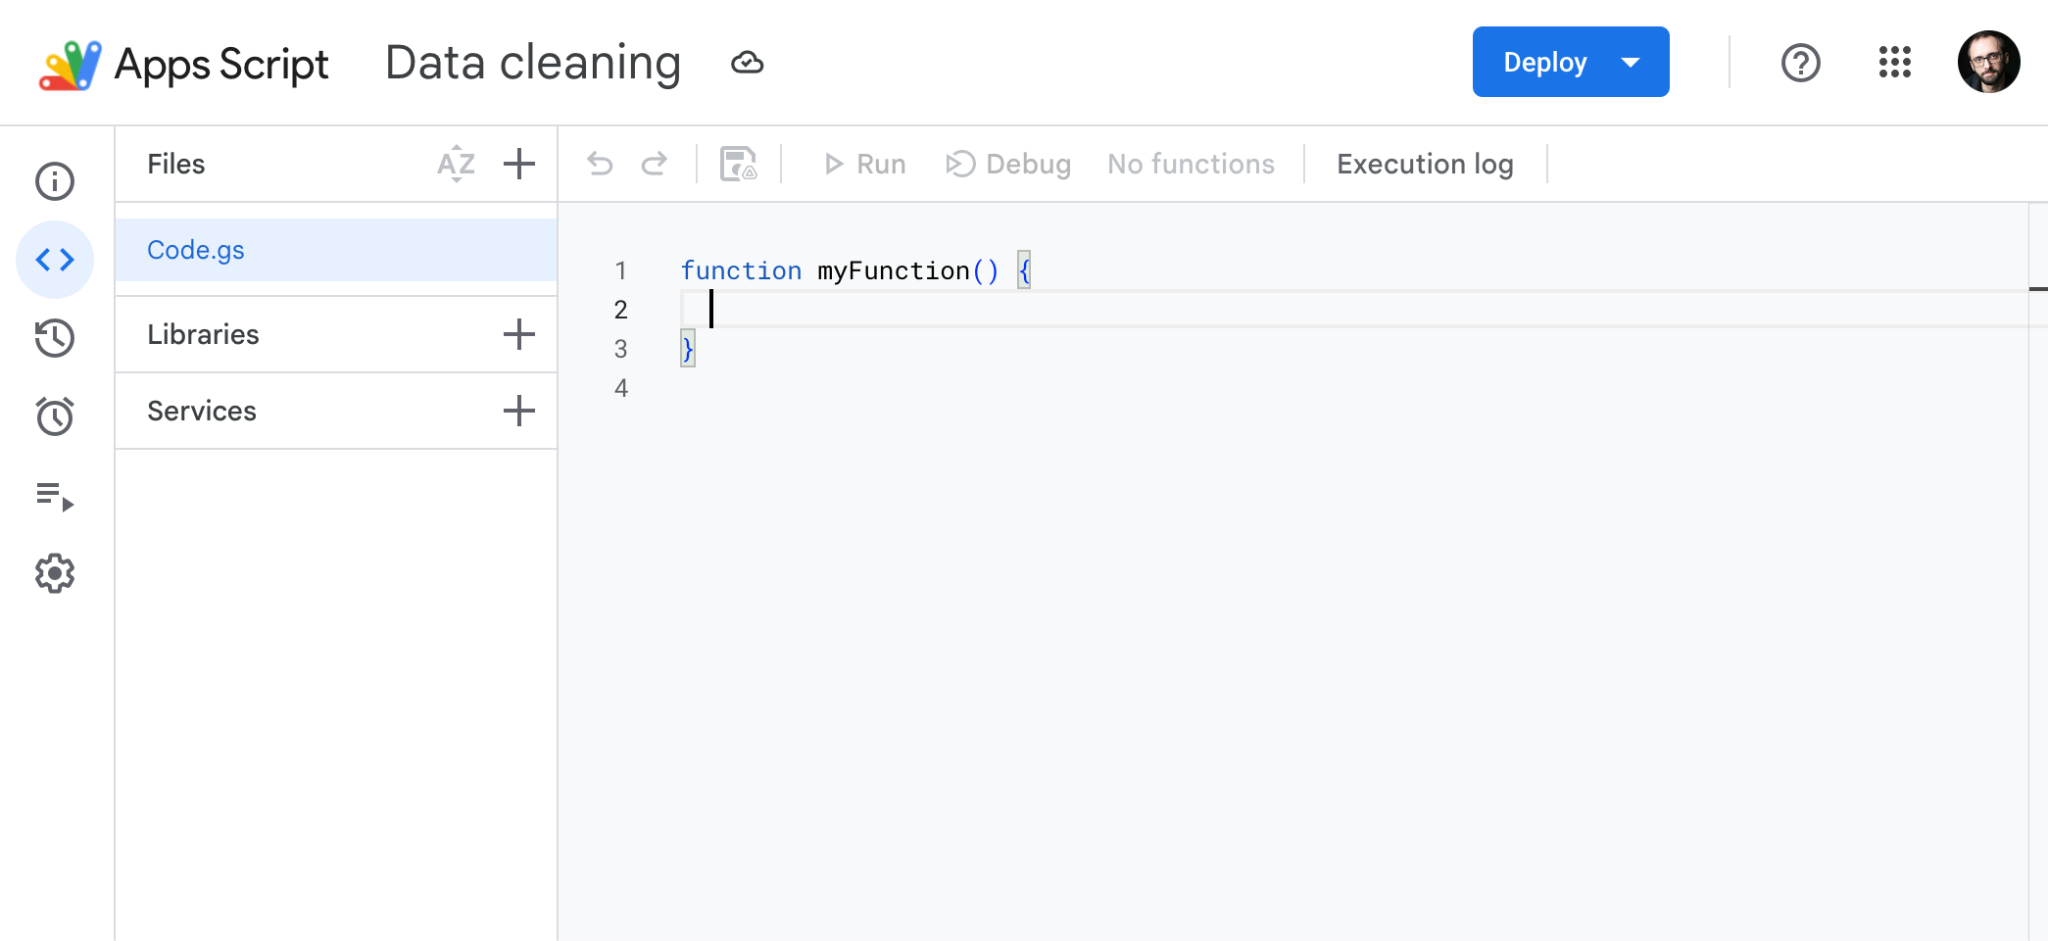
Google Sheets automates through Google Apps Script, a JavaScript-based scripting platform that runs in the cloud. Because it runs on the server side, your automations keep running even when your computer is off, and the code doesn’t touch your machine. Apps Script is free for light usage and can interact with other Google Workspace apps from a single script.
Excel’s automation is more powerful but more fragmented:
- VBA is the best option for spreadsheet automation. However, it runs locally, so it can execute only when your computer is on and the file is open.
- Office Scripts is the TypeScript-based cloud-scripting layer for Excel, a modern-day VBA. The catch: It’s available only on qualifying commercial Microsoft 365 plans (not personal or free plans). There’s no way to directly migrate VBA to Office Scripts, so you’ll need to rebuild the logic, which many teams are now doing with AI assistance. To run Office Scripts on a schedule, you have to connect them to Power Automate.
- Power Automate is included in most Microsoft 365 business plans, but the seeded tier is limited to standard Microsoft connectors (Outlook, Teams, SharePoint, Excel for the web) and personal use only. Sharing flows with teammates (or connecting to outside apps such as Salesforce or custom APIs) requires a standalone Power Automate Premium plan at $15 per user, per month. In addition, Power Automate’s Excel integration works only with cloud-stored files, not your local desktop files.
On integrations, both tools connect deeply with the rest of their respective ecosystems, and both offer API access for custom builds. No-code connector platforms, such as Zapier or Make, work with both as well.
Bottom line: On automation, the Excel-Google Sheets competition doesn’t have a clear winner. Sheets has the edge for lightweight, always-on cloud automation. It’s free and flexible and doesn’t need your computer to run. Excel’s VBA is more powerful for complex spreadsheet automation, but the existing cloud options come with licensing costs and more setup. For teams running serious automation at scale, Excel’s ecosystem eventually wins, but the barrier to entry is higher.
Reporting and dashboards
Excel has more visualization power. It offers nearly double the chart types of Sheets and includes 3D options and specialized finance charts. Pivot tables support calculated fields, slicers with visible values, timelines, and fine-grained layout controls.
For teams that need interactive dashboards beyond what’s possible in a spreadsheet, Excel connects directly to Power BI, transferring queries, data models, and reports cleanly. Power BI is free for individual use; you need a paid plan to share reports with others.
This visualization power is backed by Excel’s ability to handle larger datasets without slowing down, which matters when your dashboard is pulling from a file with hundreds of thousands of rows.
Google Sheets is more accessible and more convenient, especially for teams without dedicated data analysts.
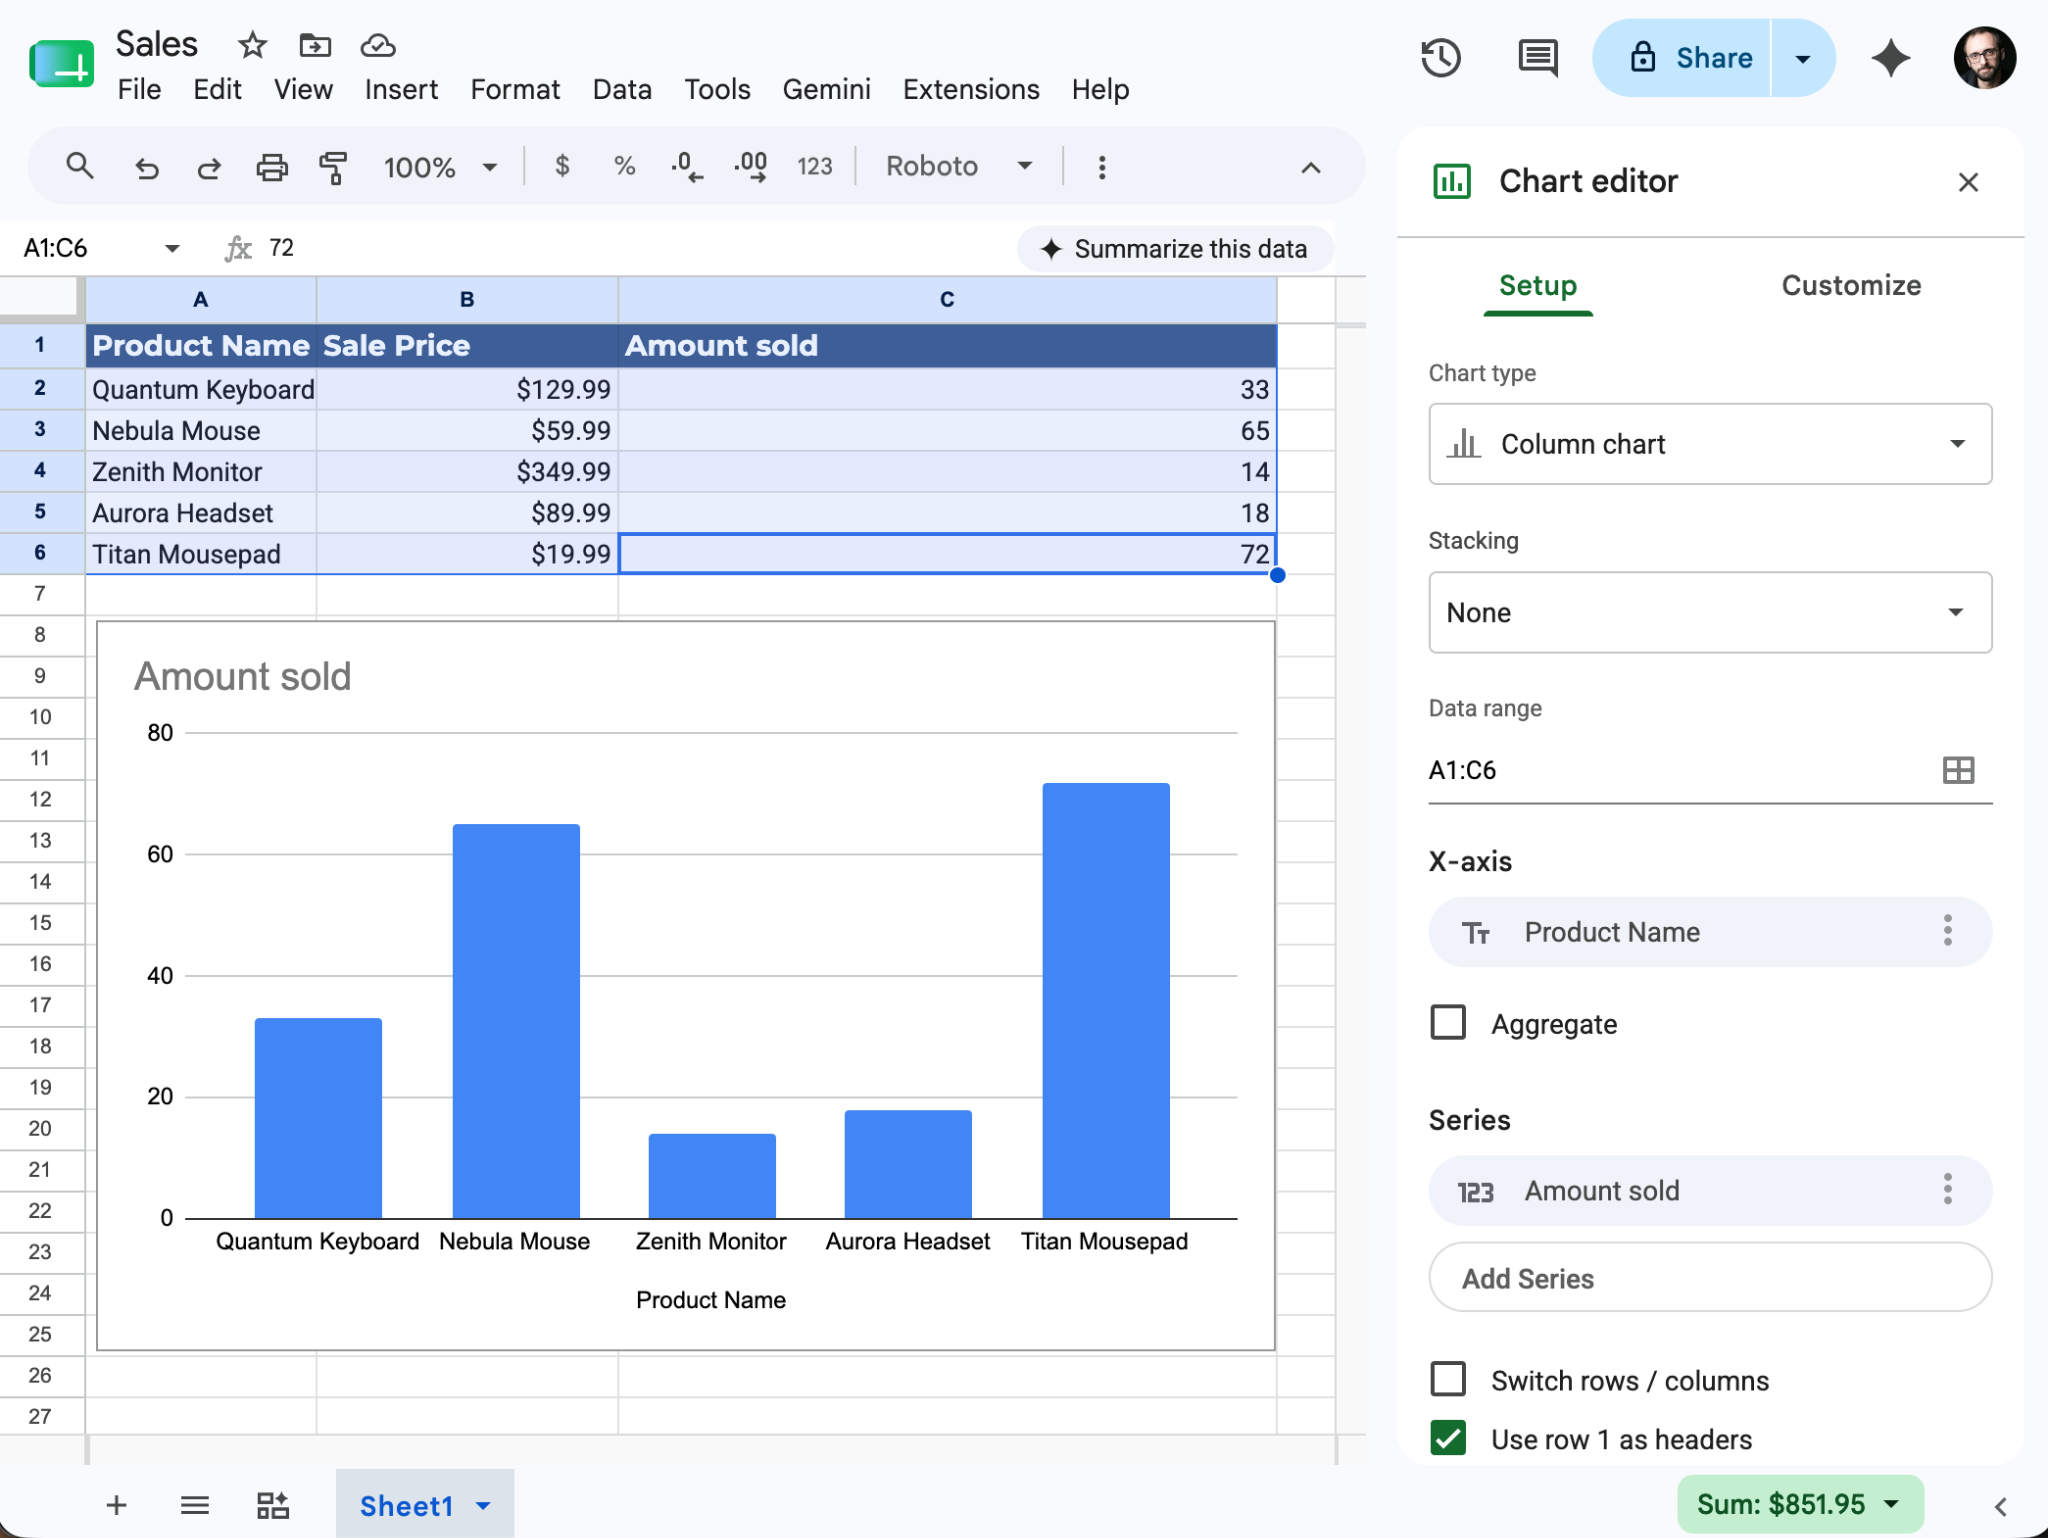
Sheets offers 32 chart types, fewer than Excel, but they cover most common use cases. Its pivot tables feature a Suggestions panel that recommends analysis options based on the dataset, a nice touch for users who don’t always know what they’re looking for. There’s also an Aggregate Data toggle that automatically groups similar values in a chart; doing the same in Excel requires extra configuration.
Sheets has clear limitations, however. Its dashboard layouts are fiddly: Elements overlap, and it takes a lot of work to get things to look clean. The tool also lacks powerful automation: Adding data to the source sheet doesn’t automatically update pivot tables or dashboards. You have to refresh manually.
The better option for Sheets users who need dashboards is to connect to Looker Studio, Google’s free data visualization tool. Looker Studio refreshes automatically whenever the connected spreadsheet changes and offers more layout control. You can share reports without giving someone access to your raw data.
Bottom line: For serious reporting and dashboards, use Excel for depth and for the Power BI integration. For teams that want a usable dashboard without a steep learning curve, Sheets combined with Looker Studio is a practical and free path.
AI features
AI in spreadsheets is still finding its footing. Both tools have added ambitious features in the past two years, but the results are mixed: AI can save time on low-stakes tasks that you can easily verify, but it can also produce confidently wrong results on other tasks, obscuring the truth about your data. Always verify the outputs, especially for critical values, formulas, and logical operations.
In terms of user experience, both Google’s Gemini and Microsoft’s Copilot appear in an AI sidebar and can generate formulas from natural language, interact with your spreadsheet data, build pivot tables and charts, and pull context from other apps on your account. Both support multistep agentic editing, chaining several actions from a single prompt, and both make an action plan that you can approve.
Here’s the main difference: Gemini in Google Sheets includes a unique cell-level formula: =AI(“prompt”, cell_range) runs AI operations directly inside cells (e.g., bulk text generation, summarization, categorization, data extraction, and Google Search). This formula is super-useful for tasks such as generating content, categorizing free-text responses, and pulling structured data from unstructured inputs.
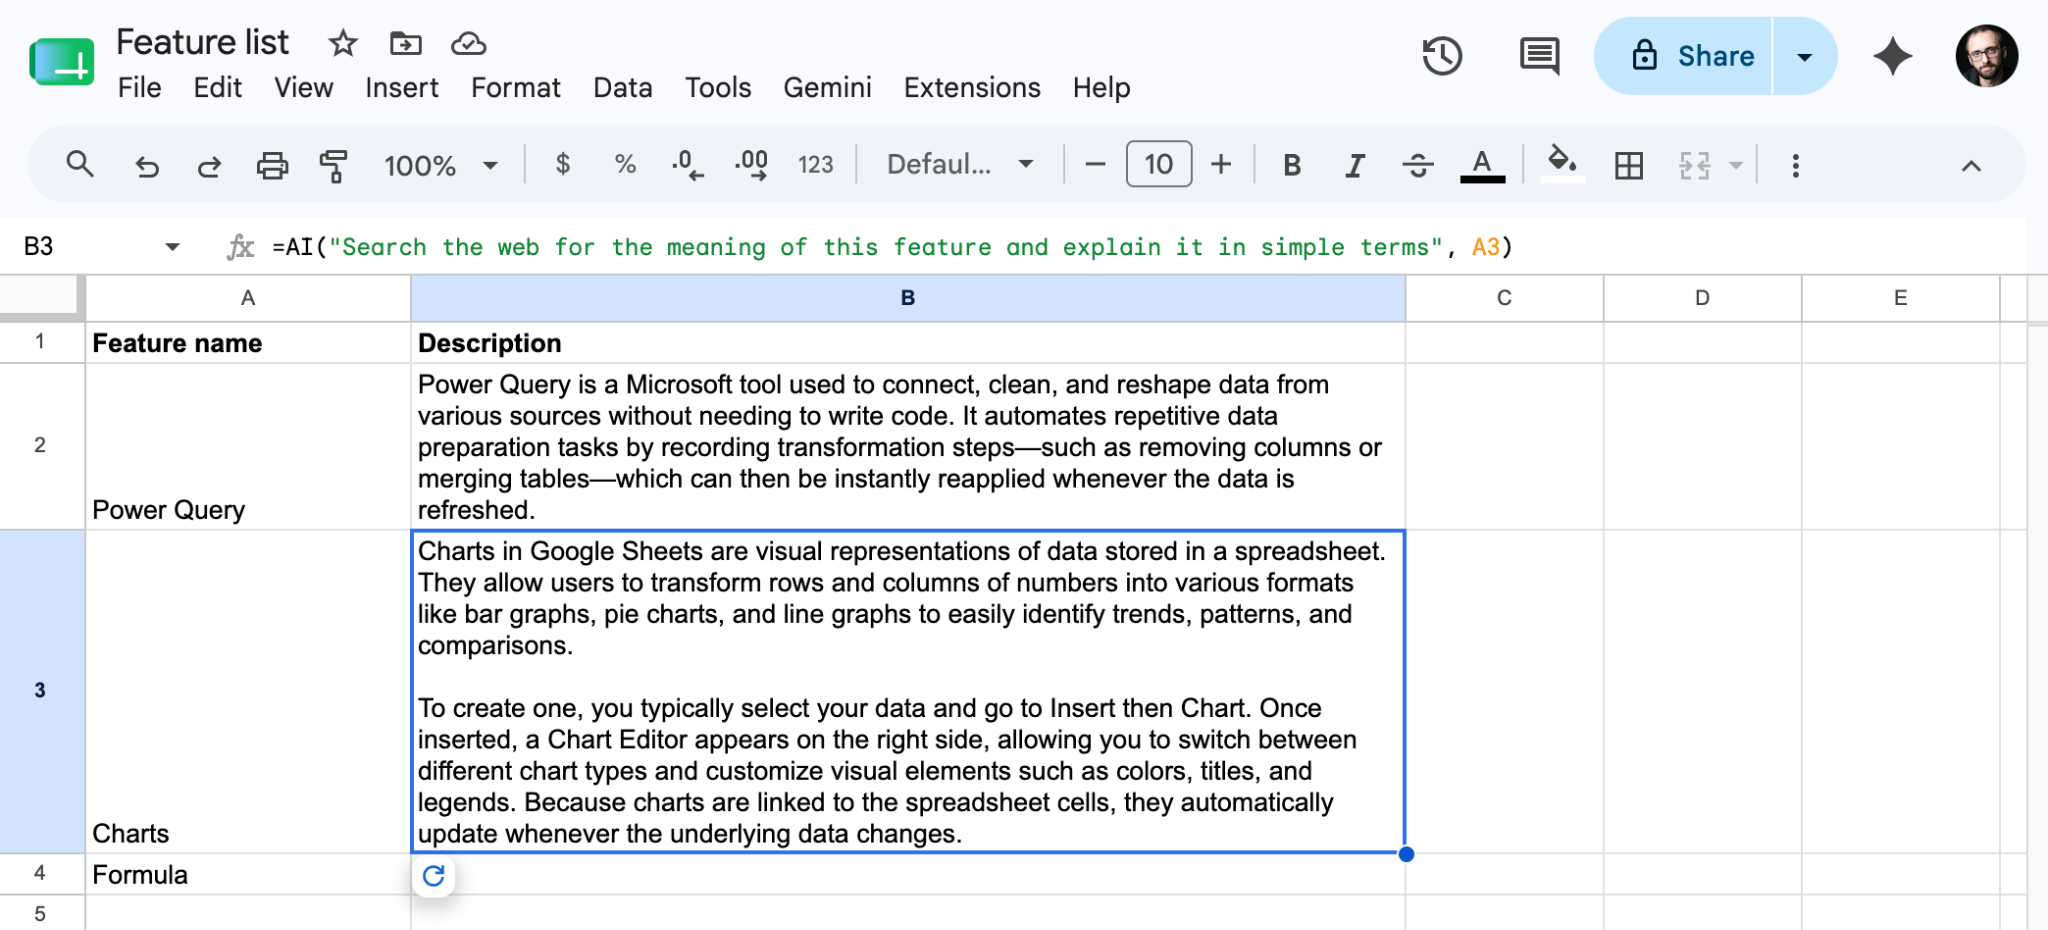
However, there are some limitations to be aware of: The AI function handles 200 cells per operation; if you assign too much work in one cell, it stalls. Long or complex prompts get refused or result in incomplete outputs. The Undo function deletes the response but leaves the formula in place. The Redo function regenerates rather than restores the previous output, so you may get a different answer each time. You also can’t choose the AI model that processes your request.
Microsoft is developing a competing =COPILOT() cell formula for Excel. It’s currently in the Windows Insider Program in beta.
Bottom line: With its cell formula, Gemini for Sheets is slightly more developed than Copilot and is a better match for research-adjacent and non-analytical workflows. Copilot integrates better with Excel’s advanced features for data work. Both will keep evolving, so the gap may shift in the coming months. No matter which one you use, always verify the outputs.
Security and compliance
For most users and small teams, both platforms are secure enough. In cloud files, both tools encrypt your data in transit and at rest, and a login is required for access. There’s a catch, however, for your local Excel files: You must encrypt them manually with a password. Otherwise, anyone who gains access to the file can easily open it.
For those working in regulated industries or at companies with strict IT governance requirements, both tools have the major security and compliance frameworks, including HIPAA (with a business associate agreement) and GDPR compliance features, SOC 2 attestation, ISO 27001 certification, and PCI DSS certification.
Excel pulls ahead with its granular data residency controls, which feature multiple add-ons and settings to let you securely store your data in different regions. Its data loss prevention is also more robust, with tools that detect and block sensitive data from being shared outside your organization. Most of these advanced features live in separate Microsoft products, such as Azure, Purview, and Defender, requiring a skilled IT team to set up and manage them. While Google has similar features, they are not as comprehensive.
Microsoft falls behind on two fronts: Google’s four file-level permission roles (owner, editor, commenter, viewer) offer more control compared with Excel’s view and edit permissions. In addition, malicious VBA macros embedded in Excel files serve as an attack vector for hackers, whereas Google’s Apps Script’s sandboxed cloud runs are more secure.
Bottom line: If you’re not operating in a regulated industry, both tools are secure enough, as long as you understand the file-level permissions and potential VBA threats. For the most demanding regulated environments, Excel and Microsoft 365 have a deeper compliance and governance toolkit.
Best use cases
Google Sheets
- Content calendar: A four-person marketing team tracks every piece of content (e.g., blog posts, social media posts, email, and video) in a single shared spreadsheet with status dropdowns and conditional formatting. When someone in Berlin marks a post as “Scheduled” at 9 a.m., the content director in New York sees it before their first meeting. There’s no need for emails or Slack pings.
- Form-to-sheet intake pipeline: A nonprofit coordinator builds a form in Google Forms for volunteer signups. Every submission lands instantly as a new row in a connected spreadsheet, ready for the coordinator to filter by availability and assign roles. The same pattern works for HR onboarding, event RSVPs, and client request queues.
- External collaborator tracker: An agency shares a project tracker with a client via a link with comment-only permissions, so the client can flag questions on specific cells without touching the data. The agency receives status updates the moment something changes, and the client doesn’t need to install the tool or pay for licenses.
Microsoft Excel
- Financial planning and analysis (FP&A) budget vs actuals: At the end of every month, an FP&A analyst refreshes a Power Query connection to the general ledger, merging actuals against the approved budget, and runs SUMIFS variance calculations automatically. Anything over $50,000 or 5 percent off gets flagged. Each department head receives a standardized view of their numbers. (Most FP&A teams run some version of this workflow.)
- VBA automation: A manufacturing operations team used to spend eight hours every week manually consolidating production reports from 15 department files. They would copy data, reformat data, build charts, and email the output. A VBA macro now does the entire process in five minutes. It opens each file, pulls the data, validates it, generates the formatted report, and emails the report.
- Financial modeling: An investment banking analyst builds a three-statement model, including an income statement, balance sheet, and cash flow. All three are linked, so a change to a single revenue growth assumption ripples through the entire model instantly. A what-if data table runs the same model across 20 combinations of revenue and margin, showing how operating income shifts under each scenario.
Google Sheets vs Microsoft Excel: Pricing
Google Sheets | Microsoft Excel | |
|---|---|---|
| Free | Spreadsheets, 15 gigabytes (GB) of shared storage, up to 10 million cells, real-time collaboration, revision history, Apps Script automation; no Gemini | Excel for the web: light editing, coauthoring, 5 GB of OneDrive storage; no VBA, no Power Pivot, no external data connections, 50 MB file cap |
| Business | Business Starter: $8.40/user/month; Business Standard (includes Gemini): $16.80/user/month | Microsoft 365 Business Basic: $7.20/user/month (web only, no desktop app); Business Standard: $15/user/month (includes desktop app); Microsoft 365 Copilot add-on: $21/user/month in addition to Basic or Standard price |
| Trial | Free tier is permanent; paid plans offer a 14-day free trial | Thirty-day free trial |
| Style | Free + per-user monthly subscription; no perpetual license option | Free web version + per-user subscription or one-time perpetual license ($179.99–$249.99, no updates or cloud features) |
One note: Google Sheets’s lowest paid plan is more expensive per user than Microsoft’s equivalent, but it comes with the full feature set. The Microsoft 365 Business Basic plan (the cheapest paid plan) includes only the more limited web versions of Office apps. You’ll have to buy the Business Standard plan to get the full Excel desktop app.
Working with both? Here’s what to expect
For many teams, this spreadsheet comparison ends not with a winner but with a division of labor: Using both tools is often the better option. You can take advantage of the strengths of each while avoiding their limitations.
- Google Sheets handles collaboration, data collection, and real-time visibility.
- Excel handles heavy analysis, modeling, and automation. (Finance teams are the most explicit about this divide.)
These workflows support both tools:
- Collect data in Sheets via Google Forms and then export it to Excel as an XLSX file for Power Query transformations, pivot tables, or modeling.
- Edit an Excel file without converting it: Upload the XLSX file to Google Drive and open it there. Changes save back to the XLSX file. (If you want a proper Google Sheets file, import it. Just make sure it actually saves in the right format, because this is a common source of confusion.)
- Use Power Query in Excel to pull data directly from a Google Sheet.
You may experience some breakdowns when you move files between both apps:
- Macros: VBA and Google Apps Script are completely incompatible.
- Power Query, Power Pivot, and data models: There are no equivalent functions in Sheets, so the logic is stripped on import.
- Tool-specific formulas: The GOOGLEFINANCE function returns an error in Excel; Excel-only statistical functions break in Sheets.
- Pivot tables: These partially convert, but calculated fields often need manual correction.
- Charts and embedded objects: These will frequently require rebuilding.
- Conditional formatting: Formatting can be lost or misinterpreted during conversion.
None of these are deal-breakers if you know about them in advance. Plan for the conversion friction, and your hybrid workflow can run smoothly.
Google Sheets or Microsoft Excel: Which one should you choose?
The Google Sheets vs Microsoft Excel decision comes down to two factors: collaboration depth and analytical depth.
Google Sheets wins on collaboration: When multiple people need to work together from different locations or devices, Sheets is the more natural choice. The sharing model is simpler, the permission controls are more granular, and the real-time experience is cleaner.
Excel wins on analytical depth: When you need to go deep on the data, Excel is the stronger tool. It holds more data and has more functions, more automation options, and more data visualization control.
Google Sheets is the better fit if you are
- An absolute beginner (There’s less interface friction, it’s free, and it works immediately.)
- A small business or budget-constrained team (The free plan will cover most of your needs.)
- A remote or distributed team with collaboration as its primary challenge
- A nonprofit, marketing team, or school (There is consistently high Sheets adoption in these areas.)
- A person who works with live web data, financial feeds, or light web scraping
- A person looking for the more economical option at the lowest paid tier
Excel is the better fit if you are
- Working offline regularly and not dependent on a browser or connection
- Processing several hundred thousand to millions of records in one file
- Building financial models, running accounting workflows, or analyzing enterprise data
- Depending on existing VBA macros or Power Query pipelines that can’t be easily replaced
- Investing deeply in the Microsoft 365 ecosystem already
- Working in a regulated industry with compliance requirements that favor the Microsoft stack
One more thing: If you’re evaluating these tools because your team is using a spreadsheet as an intake form, an approval tracker, or a reporting dashboard, Jotform is a better fit.
Turn spreadsheet chaos into structured workflows with Jotform
Spreadsheets are great for calculations, but they weren’t designed to run workflows. People use them as productivity tools, but the user experience isn’t as clean as it could be. In addition, if someone forgets to update a row, a formula breaks, or a new hire starts editing the wrong column, suddenly the spreadsheet maintenance turns into a three-hour debugging session.
When you need to support your work with survey data, Jotform is a better choice: It offers structured data collection, organized review, and connected workflows without a spreadsheet in sight.
Forms are the data collection layer. They replace the Slack message, the email thread, and the manual data entry and capture the right information in the right format every time. Responses are immediately available across the entire Jotform platform.
Jotform Tables gives you a spreadsheet-style view of your data, with more than just the classic rows-and-columns layout. Switch to Card View, Calendar View, or Gallery View, depending on what the work requires. Apply formulas, trigger actions per row, and filter by any field in real time. Incoming submissions appear instantly; live filters let you see exactly what’s just arrived, what’s pending, and what’s been completed.
Jotform integrates with Excel and Google Sheets. Bringing in your existing operational data is easy, and you can keep running connected workflows from there.
Jotform Workflows is the automation layer. A no-code tool for routing logic across forms, tables, and connected apps, it assigns tasks, requests e-signatures, collects payments, and sends notifications based on a trigger. Build the flow once; stop managing it manually.
Jotform Report Builder turns your data into shareable visual reports without the technical complexity of Excel dashboards. Customize charts with drag-and-drop tools. Share reports via a direct link, embed them on a website, export them as PDFs, or present your results in Slideshow mode.
Jotform Apps ties it all together. Build an internal or external-facing app that collects your forms, data views, and action buttons in one place and gives team members and clients a unified experience that doesn’t require them to navigate multiple tools or pages.
Jotform integrates with hundreds of platforms, making it easy to connect with the tools your team already uses. Whether you’re migrating from a spreadsheet system or adding a structured data layer on top of one, Jotform reduces the overhead so you can focus on the work that actually moves your business forward.
FAQs about Google Sheets vs Excel
Yes, Excel for the web is free with a Microsoft account. It handles core spreadsheet work: formulas, charts, and real-time coauthoring via OneDrive. Advanced features aren’t included.
Yes, but only in Google Chrome with Offline mode enabled in advance. You need to turn it on before you lose your connection: Go to Settings > Make Available Offline on the file, or enable it globally in Google Drive settings. Changes sync automatically the next time you reconnect. Other browsers don’t support Offline mode.
For most small business and operational work, yes. Google Sheets covers the formulas, pivot tables, and charts that the majority of users need each day. It falls short when it tries to handle very large datasets, advanced statistical and financial functions, and data modeling. If your work involves hundreds of thousands of rows, multitable data models, or DAX calculations, Excel is the stronger tool.
Yes, up to 100 people can edit in Google Sheets simultaneously. Each user’s selected cell appears in a distinct color in real time, and all participants see changes instantly, without a page refresh.
For most small businesses, Google Sheets is the better starting point. It’s free, requires no installation, makes sharing with external collaborators easy, and covers the spreadsheet work most teams actually do. Excel makes more sense if your team already runs on Microsoft 365, needs to process large datasets or complex financial models, or relies on VBA automation that it has built over time. If neither of these scenarios fits perfectly, there are purpose-built Excel alternatives worth considering for specific use cases, such as Jotform Tables for workflow-driven data management.
Google Sheets automates through Google Apps Script, a JavaScript-based scripting platform that runs entirely in the cloud. It’s free and accessible without an enterprise license. Excel’s primary automation tool is VBA, which is more powerful for complex spreadsheet operations but runs locally and can’t execute unattended. Excel’s cloud automation options (Office Scripts and Power Automate) require a qualifying commercial Microsoft 365 plan. They’re not available on the free web version or personal subscriptions.
Yes, and many teams do. Use Google Sheets to collaborate in real time, collect data, and share with external parties. Use Excel for heavy analysis, modeling, and automation. Files move between the two as XLSX file exports. If the back-and-forth between the two tools starts to feel like overhead, it’s worth looking at Google Sheets alternatives, such as Jotform Tables, that keep structured data, forms, and workflows in one place.
This article is for operations teams, finance teams, project managers, analysts, small business owners, and everyday business users comparing Google Sheets and Excel for collaboration, reporting, data analysis, and workflow management.


Send Comment: