Calculating standard deviation in Excel is straightforward once you know which formula to use. Excel has built-in functions that handle the math automatically, but many users get stuck choosing between the two formulas (STDEV.S vs STDEV.P) and often aren’t sure of the impact of each on their data.
This guide walks you through the standard deviation formulas in Excel, helps you choose the right formula for your situation, and provides a step-by-step workflow (with examples) for calculating standard deviation.
I’ve also mentioned Jotform’s online Form Builder, which helps teams collect cleaner, more structured data up front so that analysis in Excel gets significantly easier. And for instant standard deviation results, there’s also Jotform’s standard deviation calculator form. This free tool takes the formulas (and the headaches) out of calculating standard deviation.
What does standard deviation mean?
Standard deviation measures how spread out your data is from the average.
A small standard deviation means your values are clustered closely around the mean. A large standard deviation means they are scattered more widely.
For example, if you ran a test and most students scored between 78 and 82, your standard deviation would be low. If scores ranged from 50 to 99, it would be high.
How to calculate standard deviation in Excel step-by-step


Here’s how to find standard deviation in Excel in four simple steps. Included in this section is the workflow, with annotated screenshots, using an example of student exam scores in math, science, and English.
1. Enter your data into a column
First, type values into their own cells in a single column. Make sure no blank cells or headers are mixed in with your numbers.
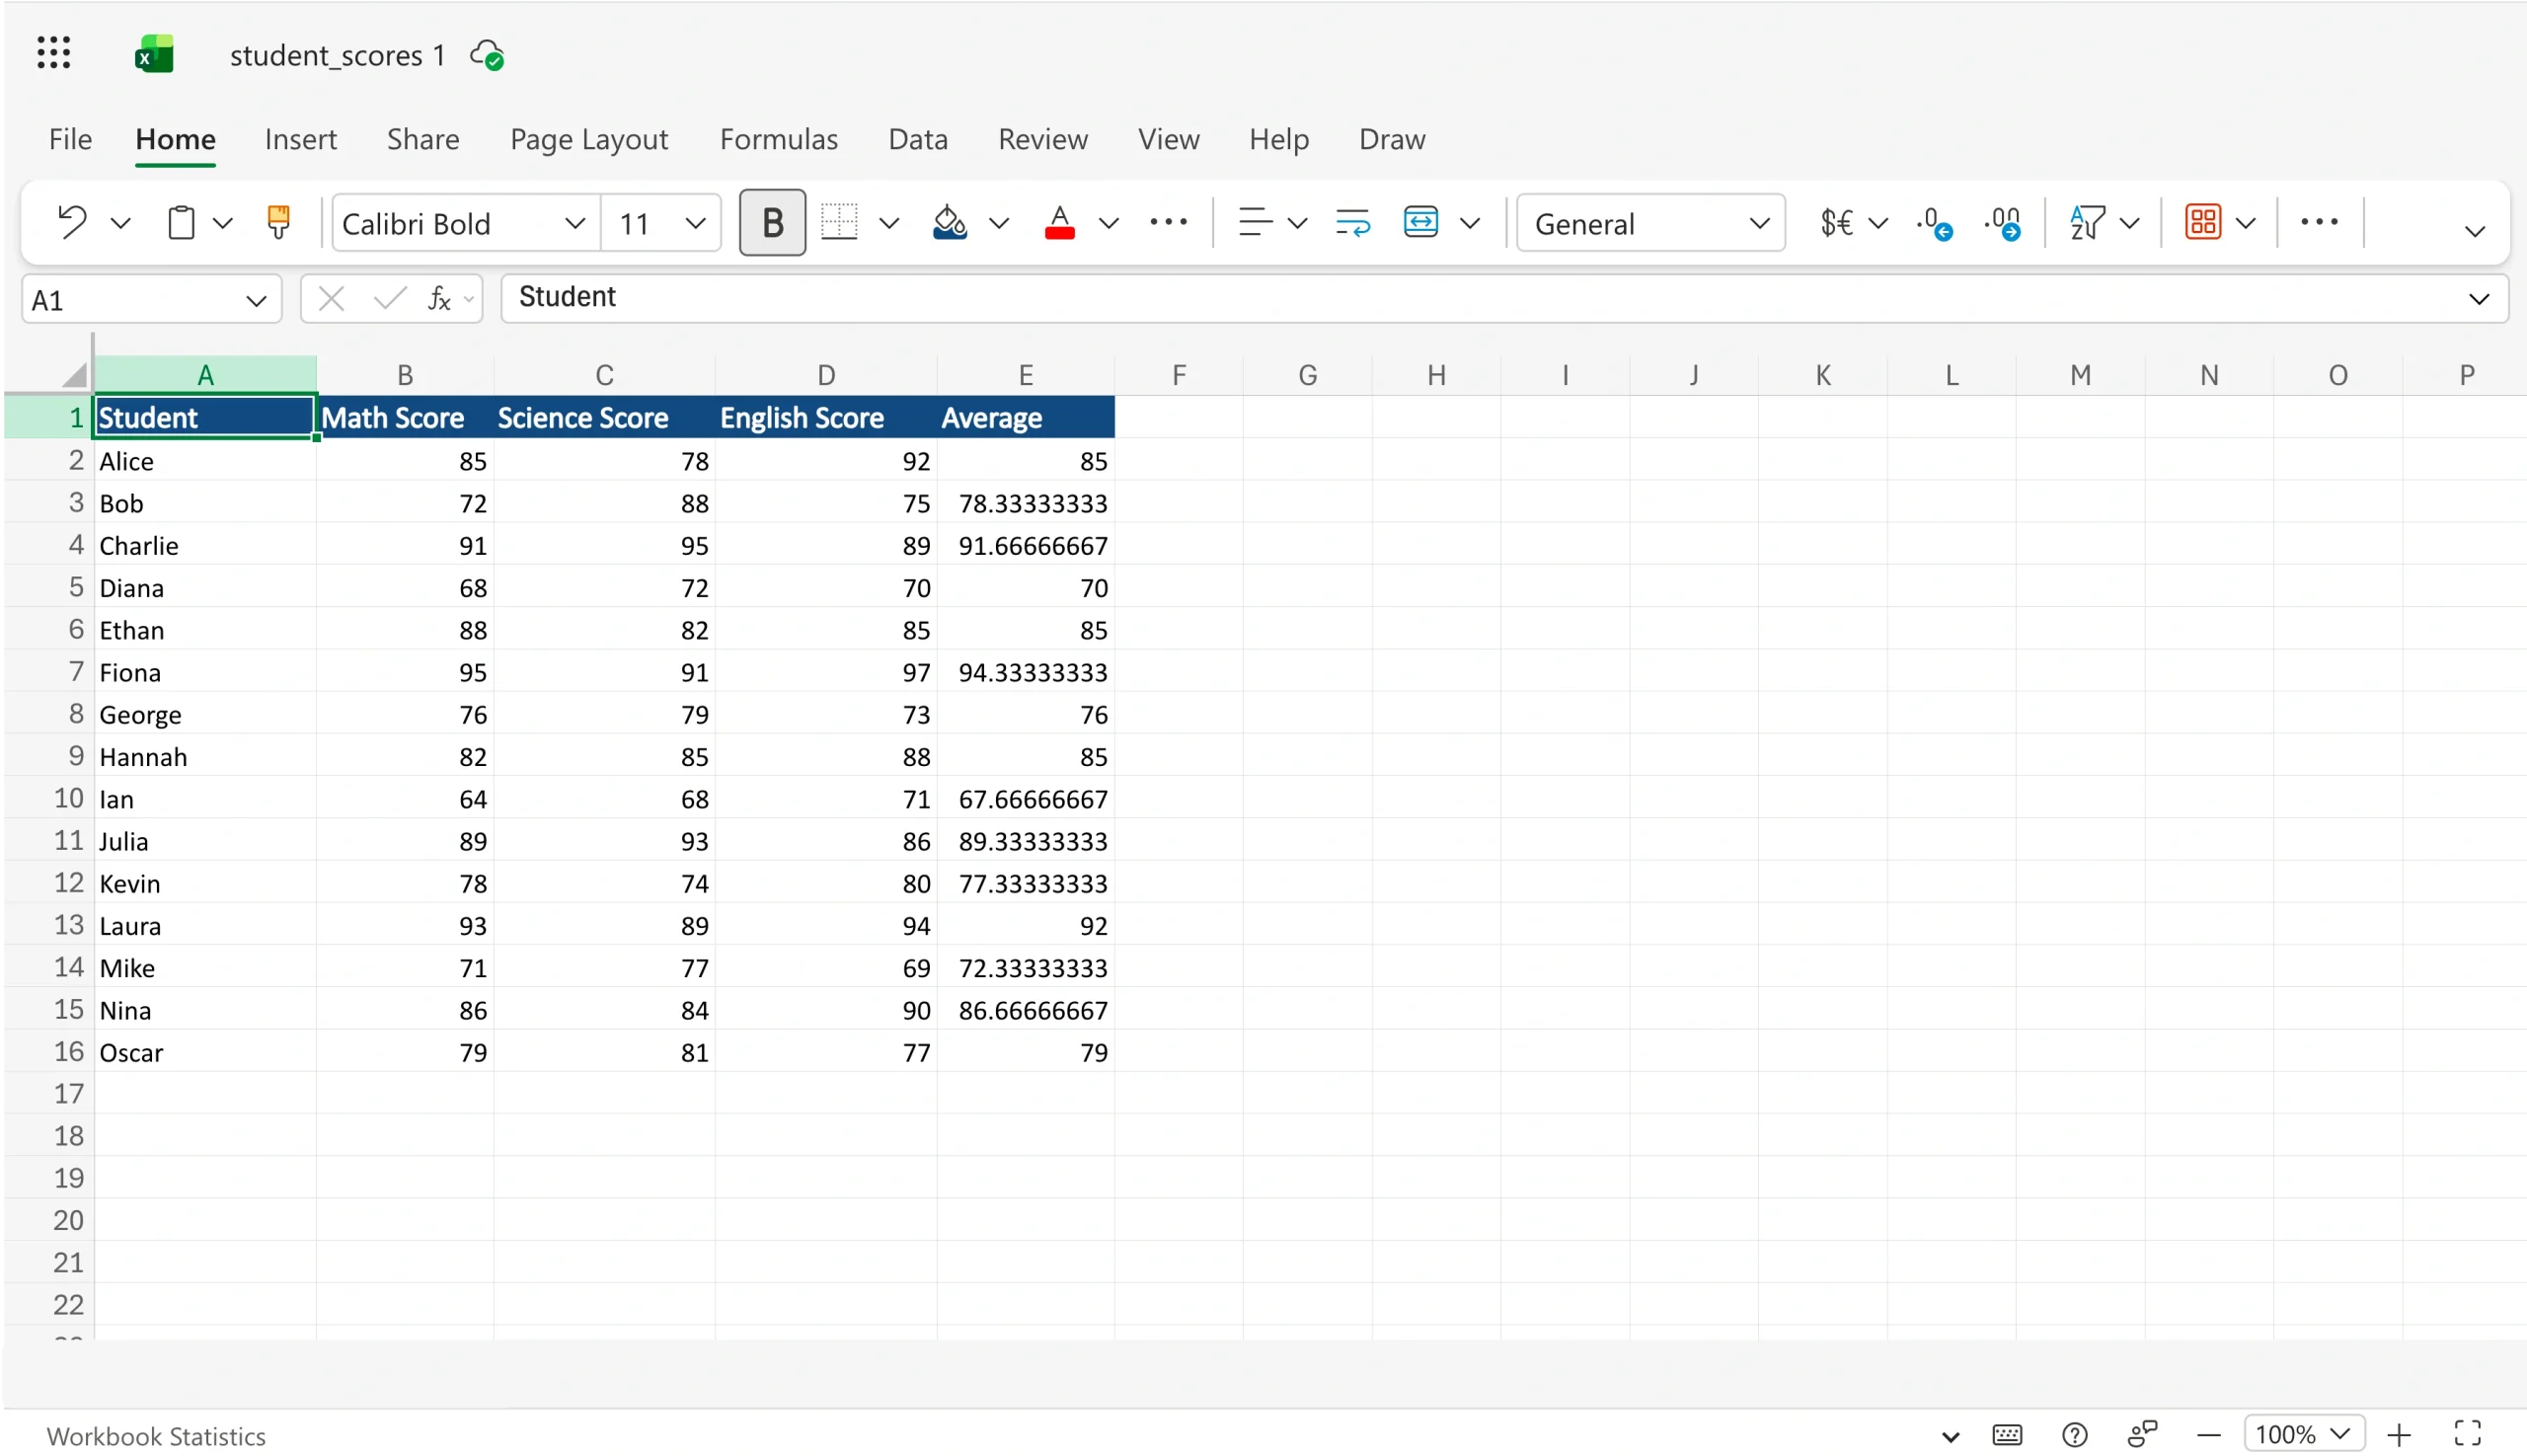
Here’s what my complete spreadsheet looks like:
2. Select an empty cell for the result
Click on the empty cell where you want the result to appear.
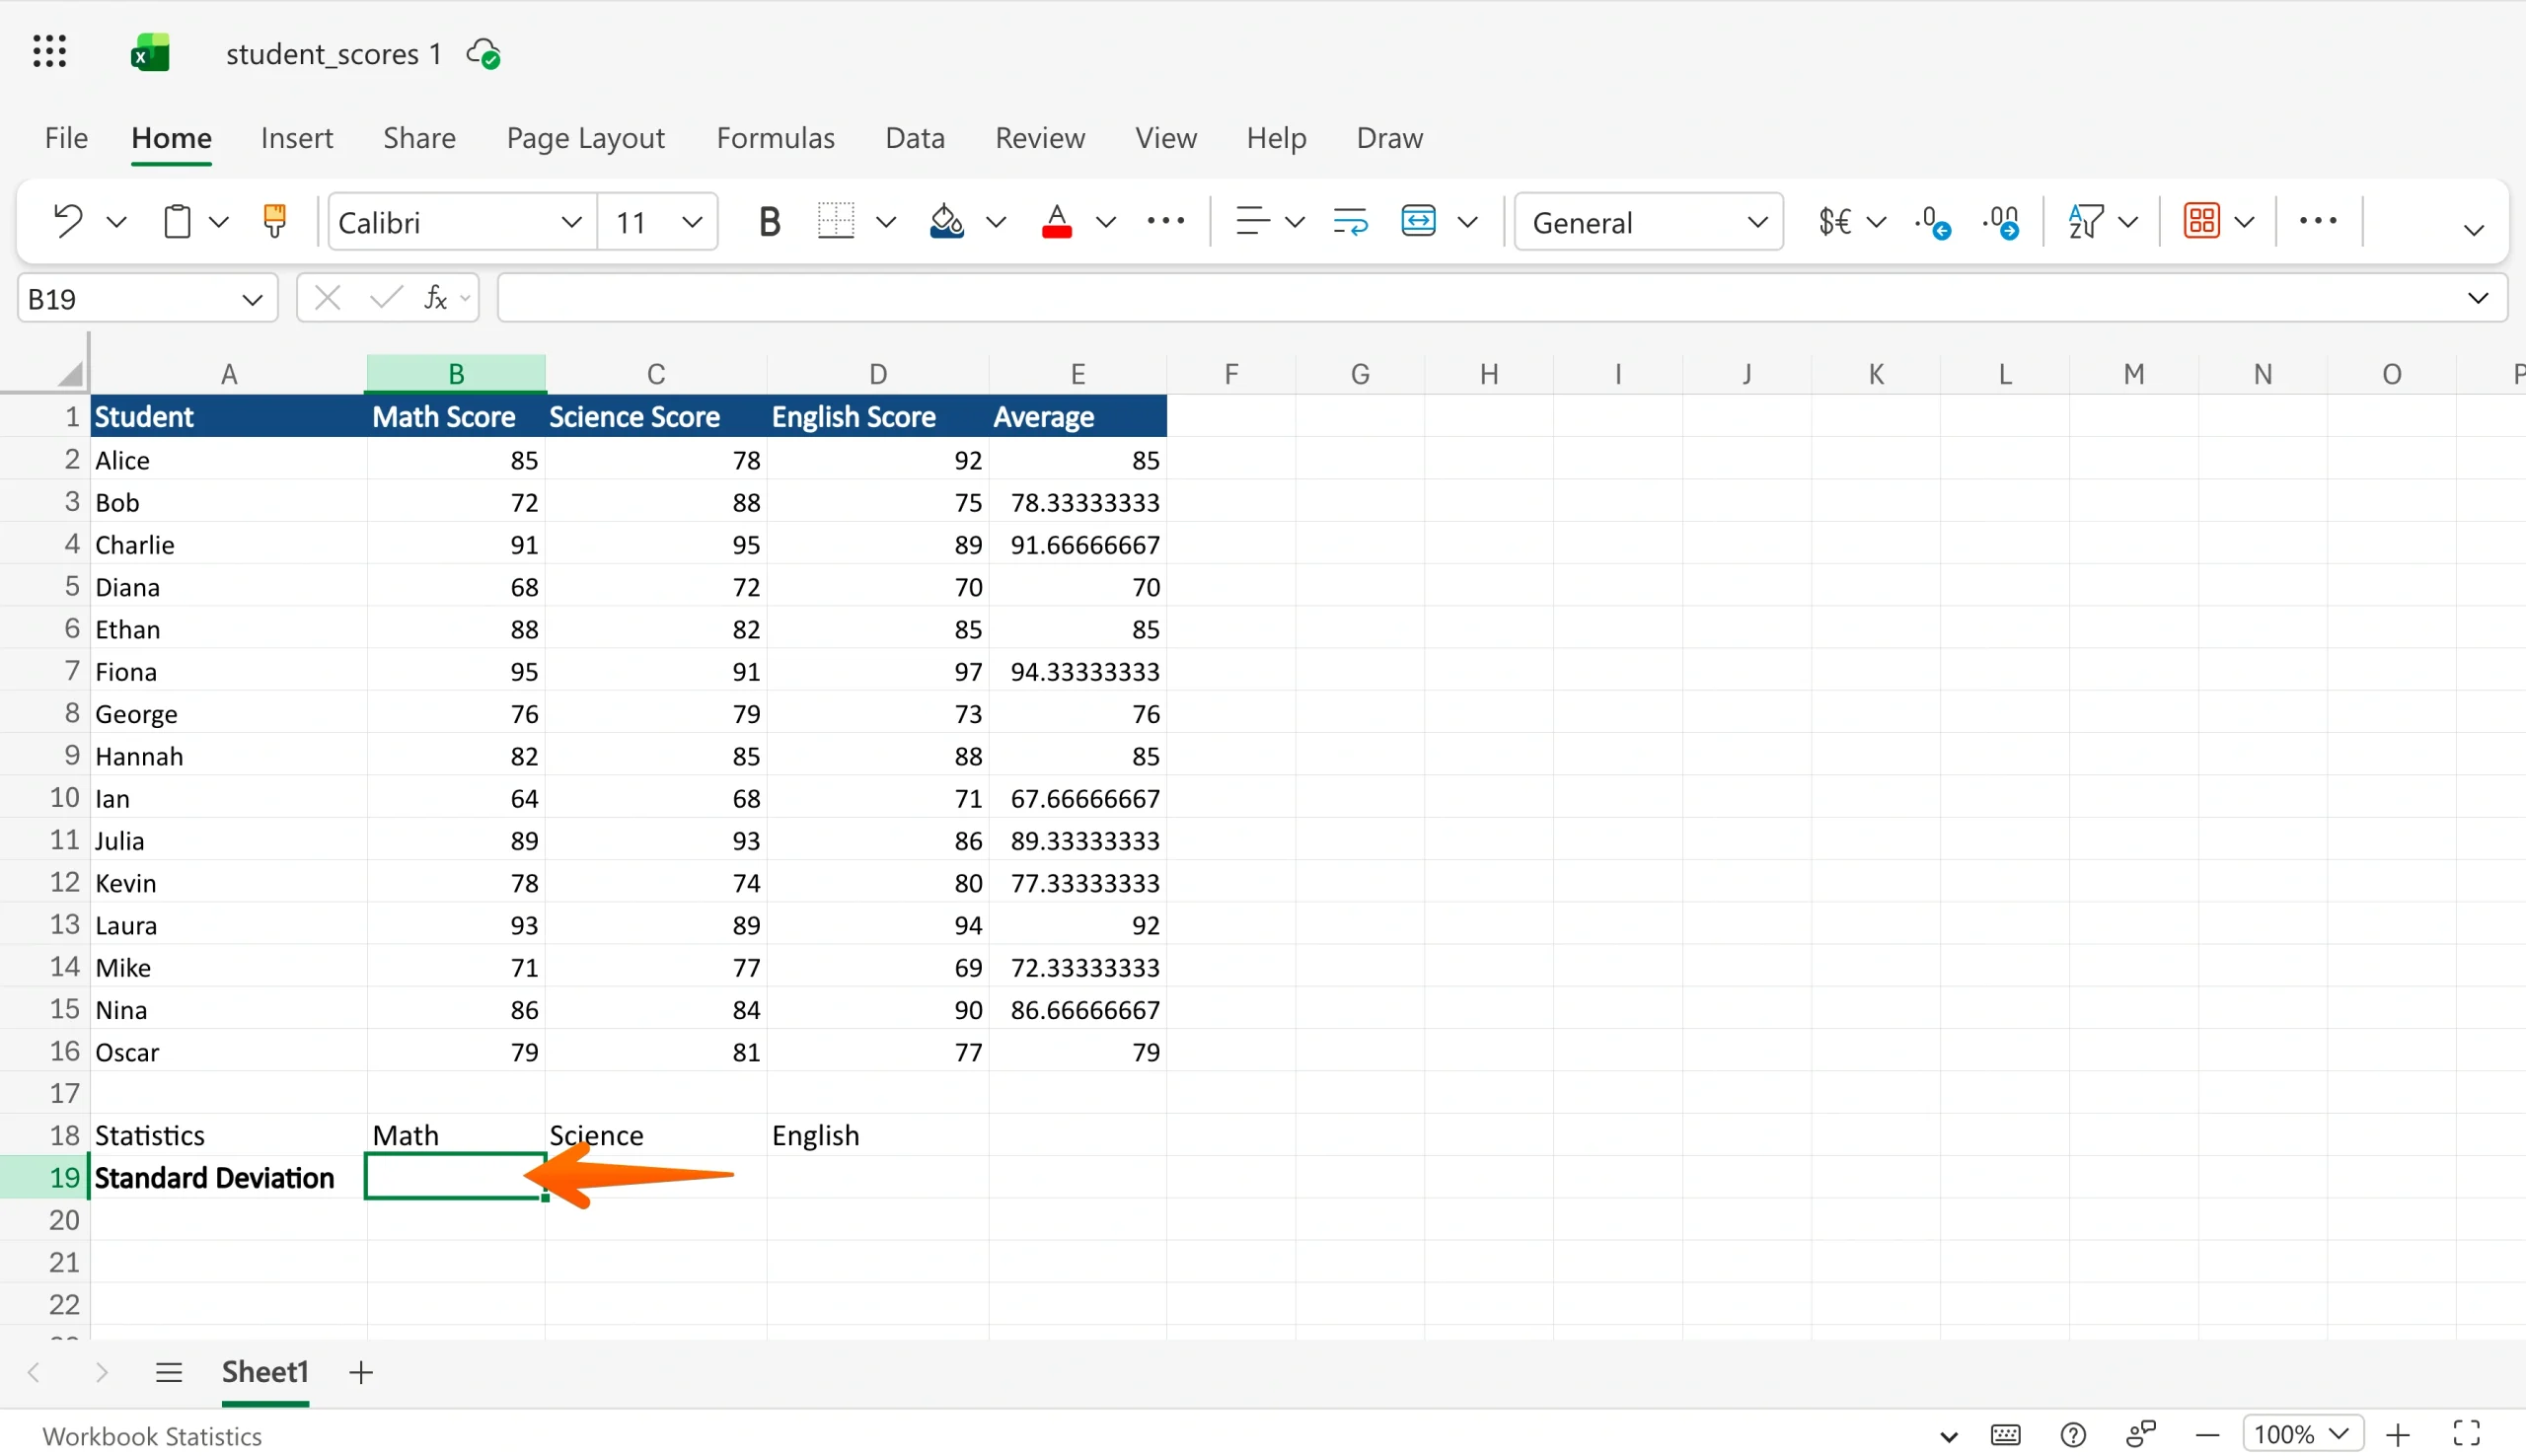
In my spreadsheet, I wanted the standard deviation for the math scores to show below the data in row 19, so I selected cell B19:
3. Enter the correct formula
Type your formula directly into the empty cell:
- If your data is a sample, type =STDEV.S(cell1, cell2…)
- If your data is a population, type =STDEV.P(cell1, cell2…)
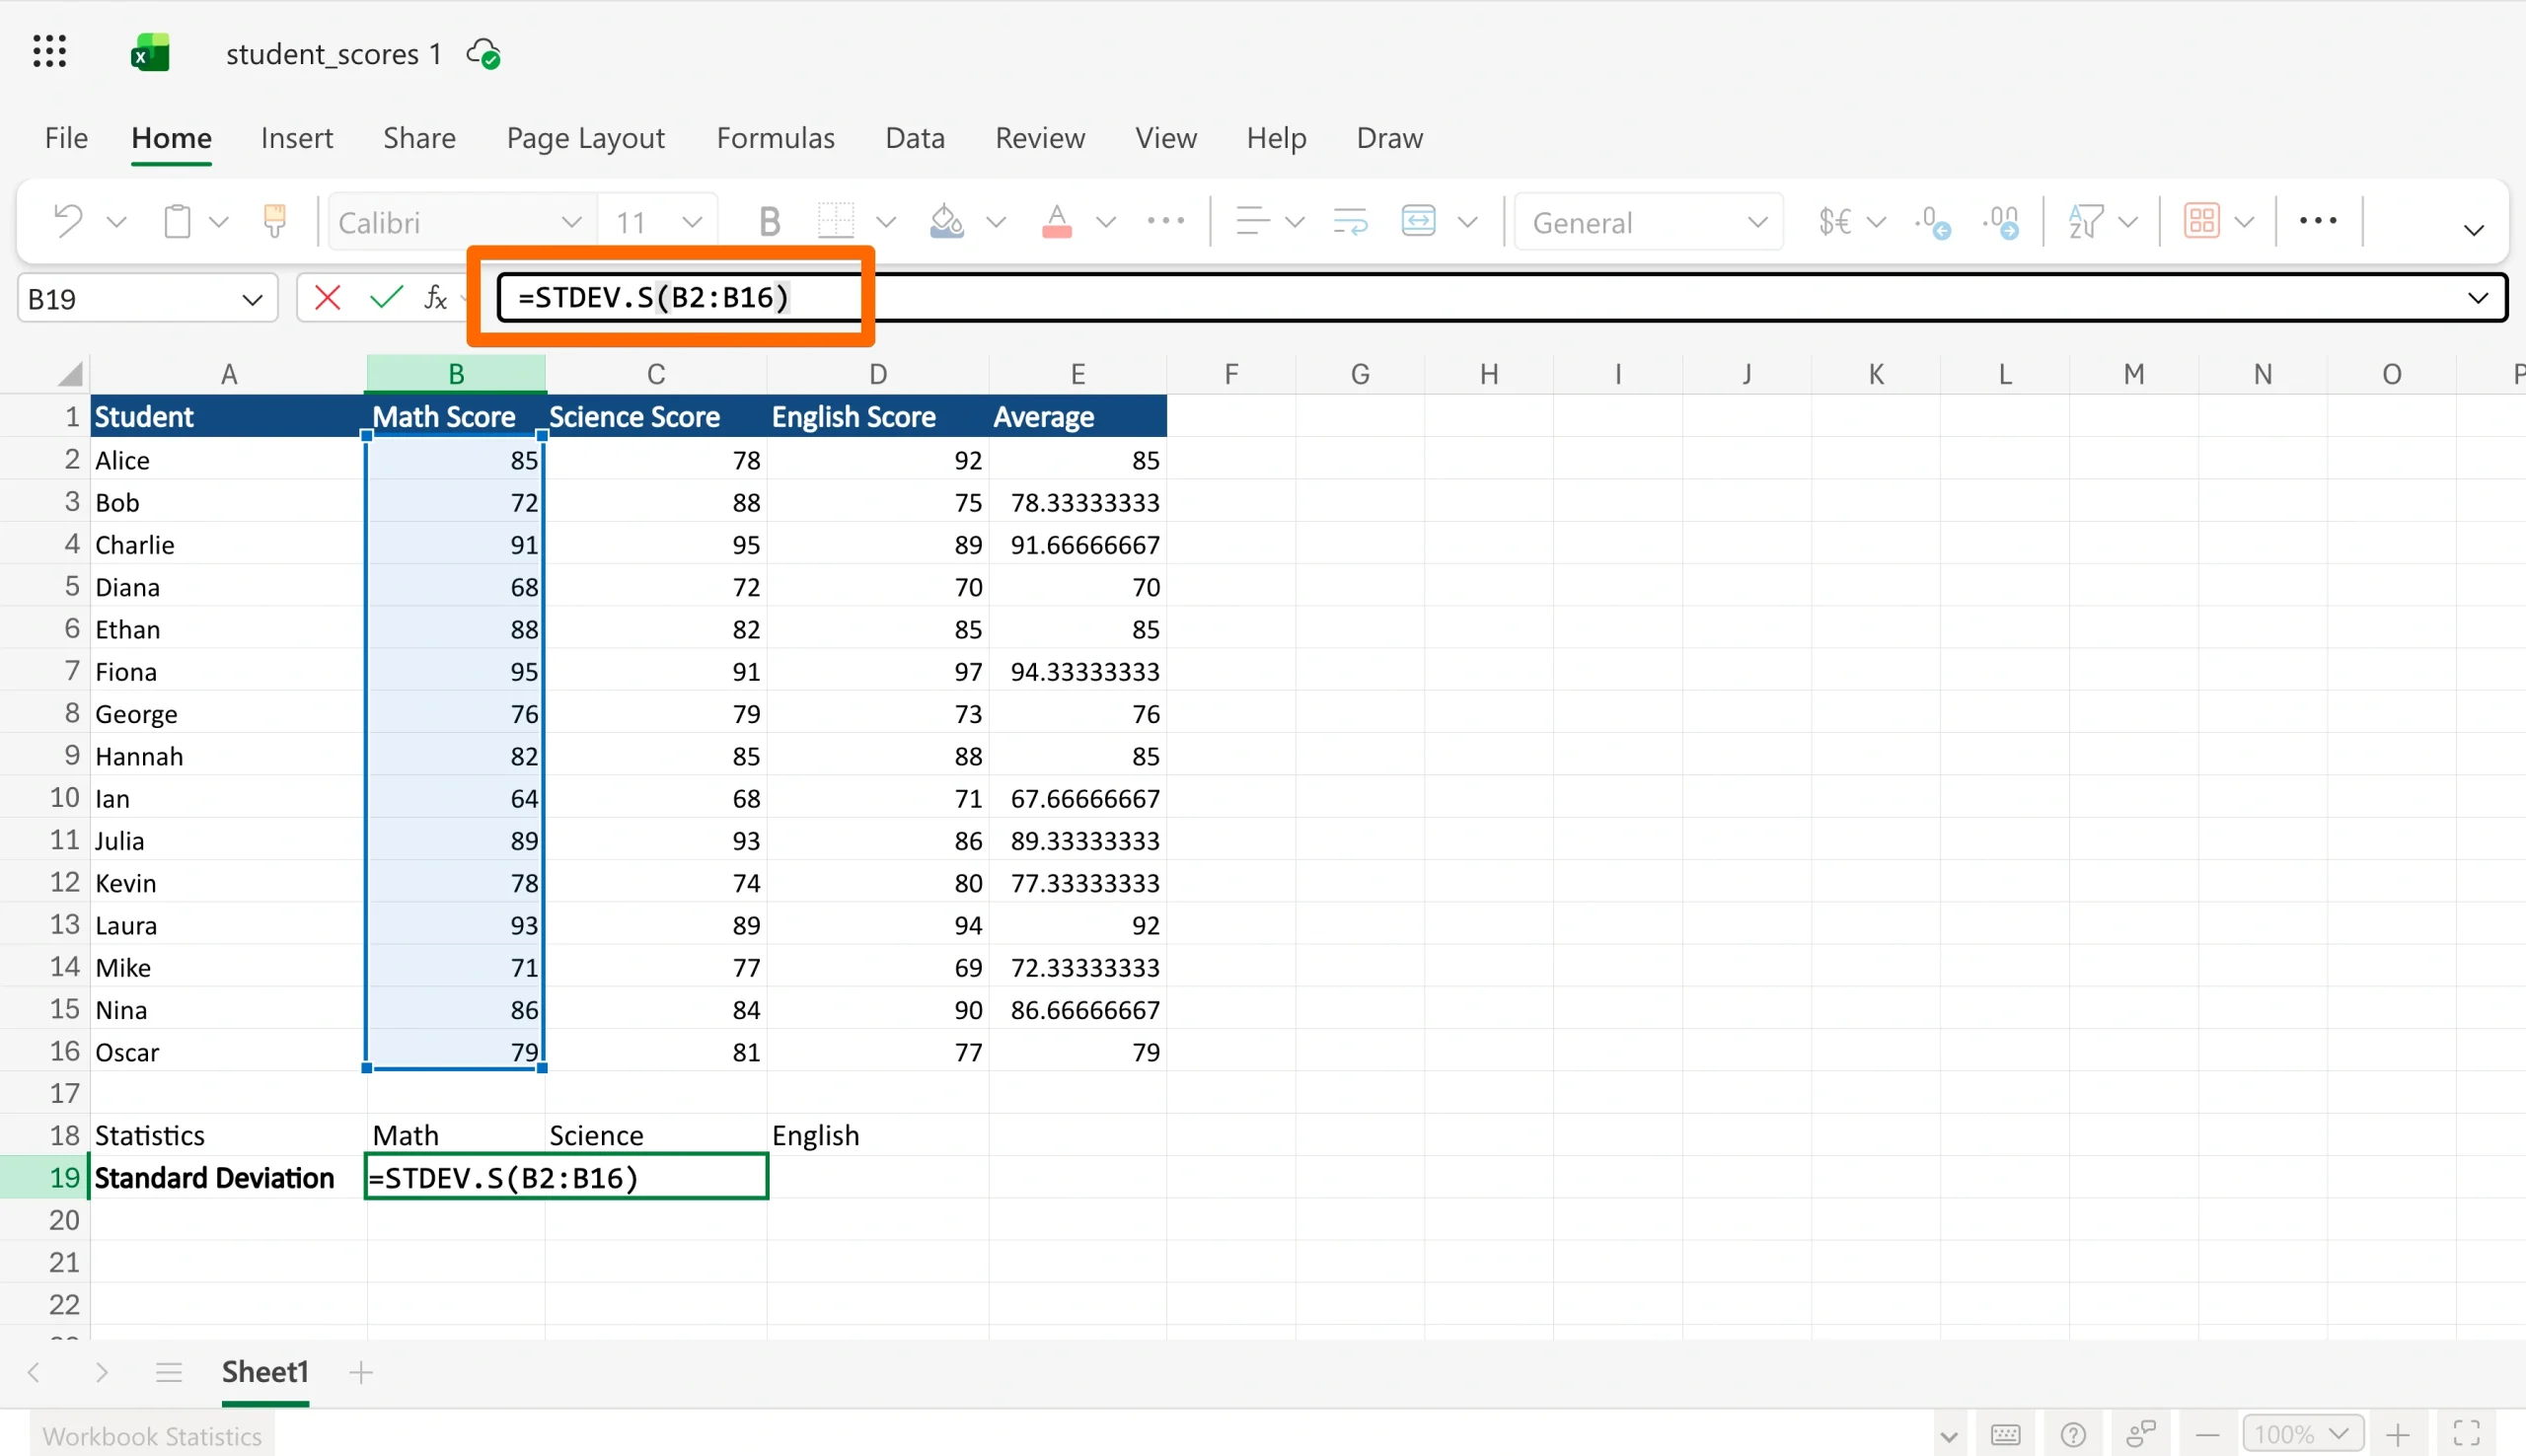
Make sure your cell range matches where your data actually sits. In my example, the values are located in cells B2 to B16, so the formula should say =STDEV.S(B2:B16).
The : means “everything between B2 and B16,” so the formula will calculate based on the values in B2, B3, B4, B5, B6, and so on. This is faster than selecting cells individually.
Here’s what it looked like when I created my formula:
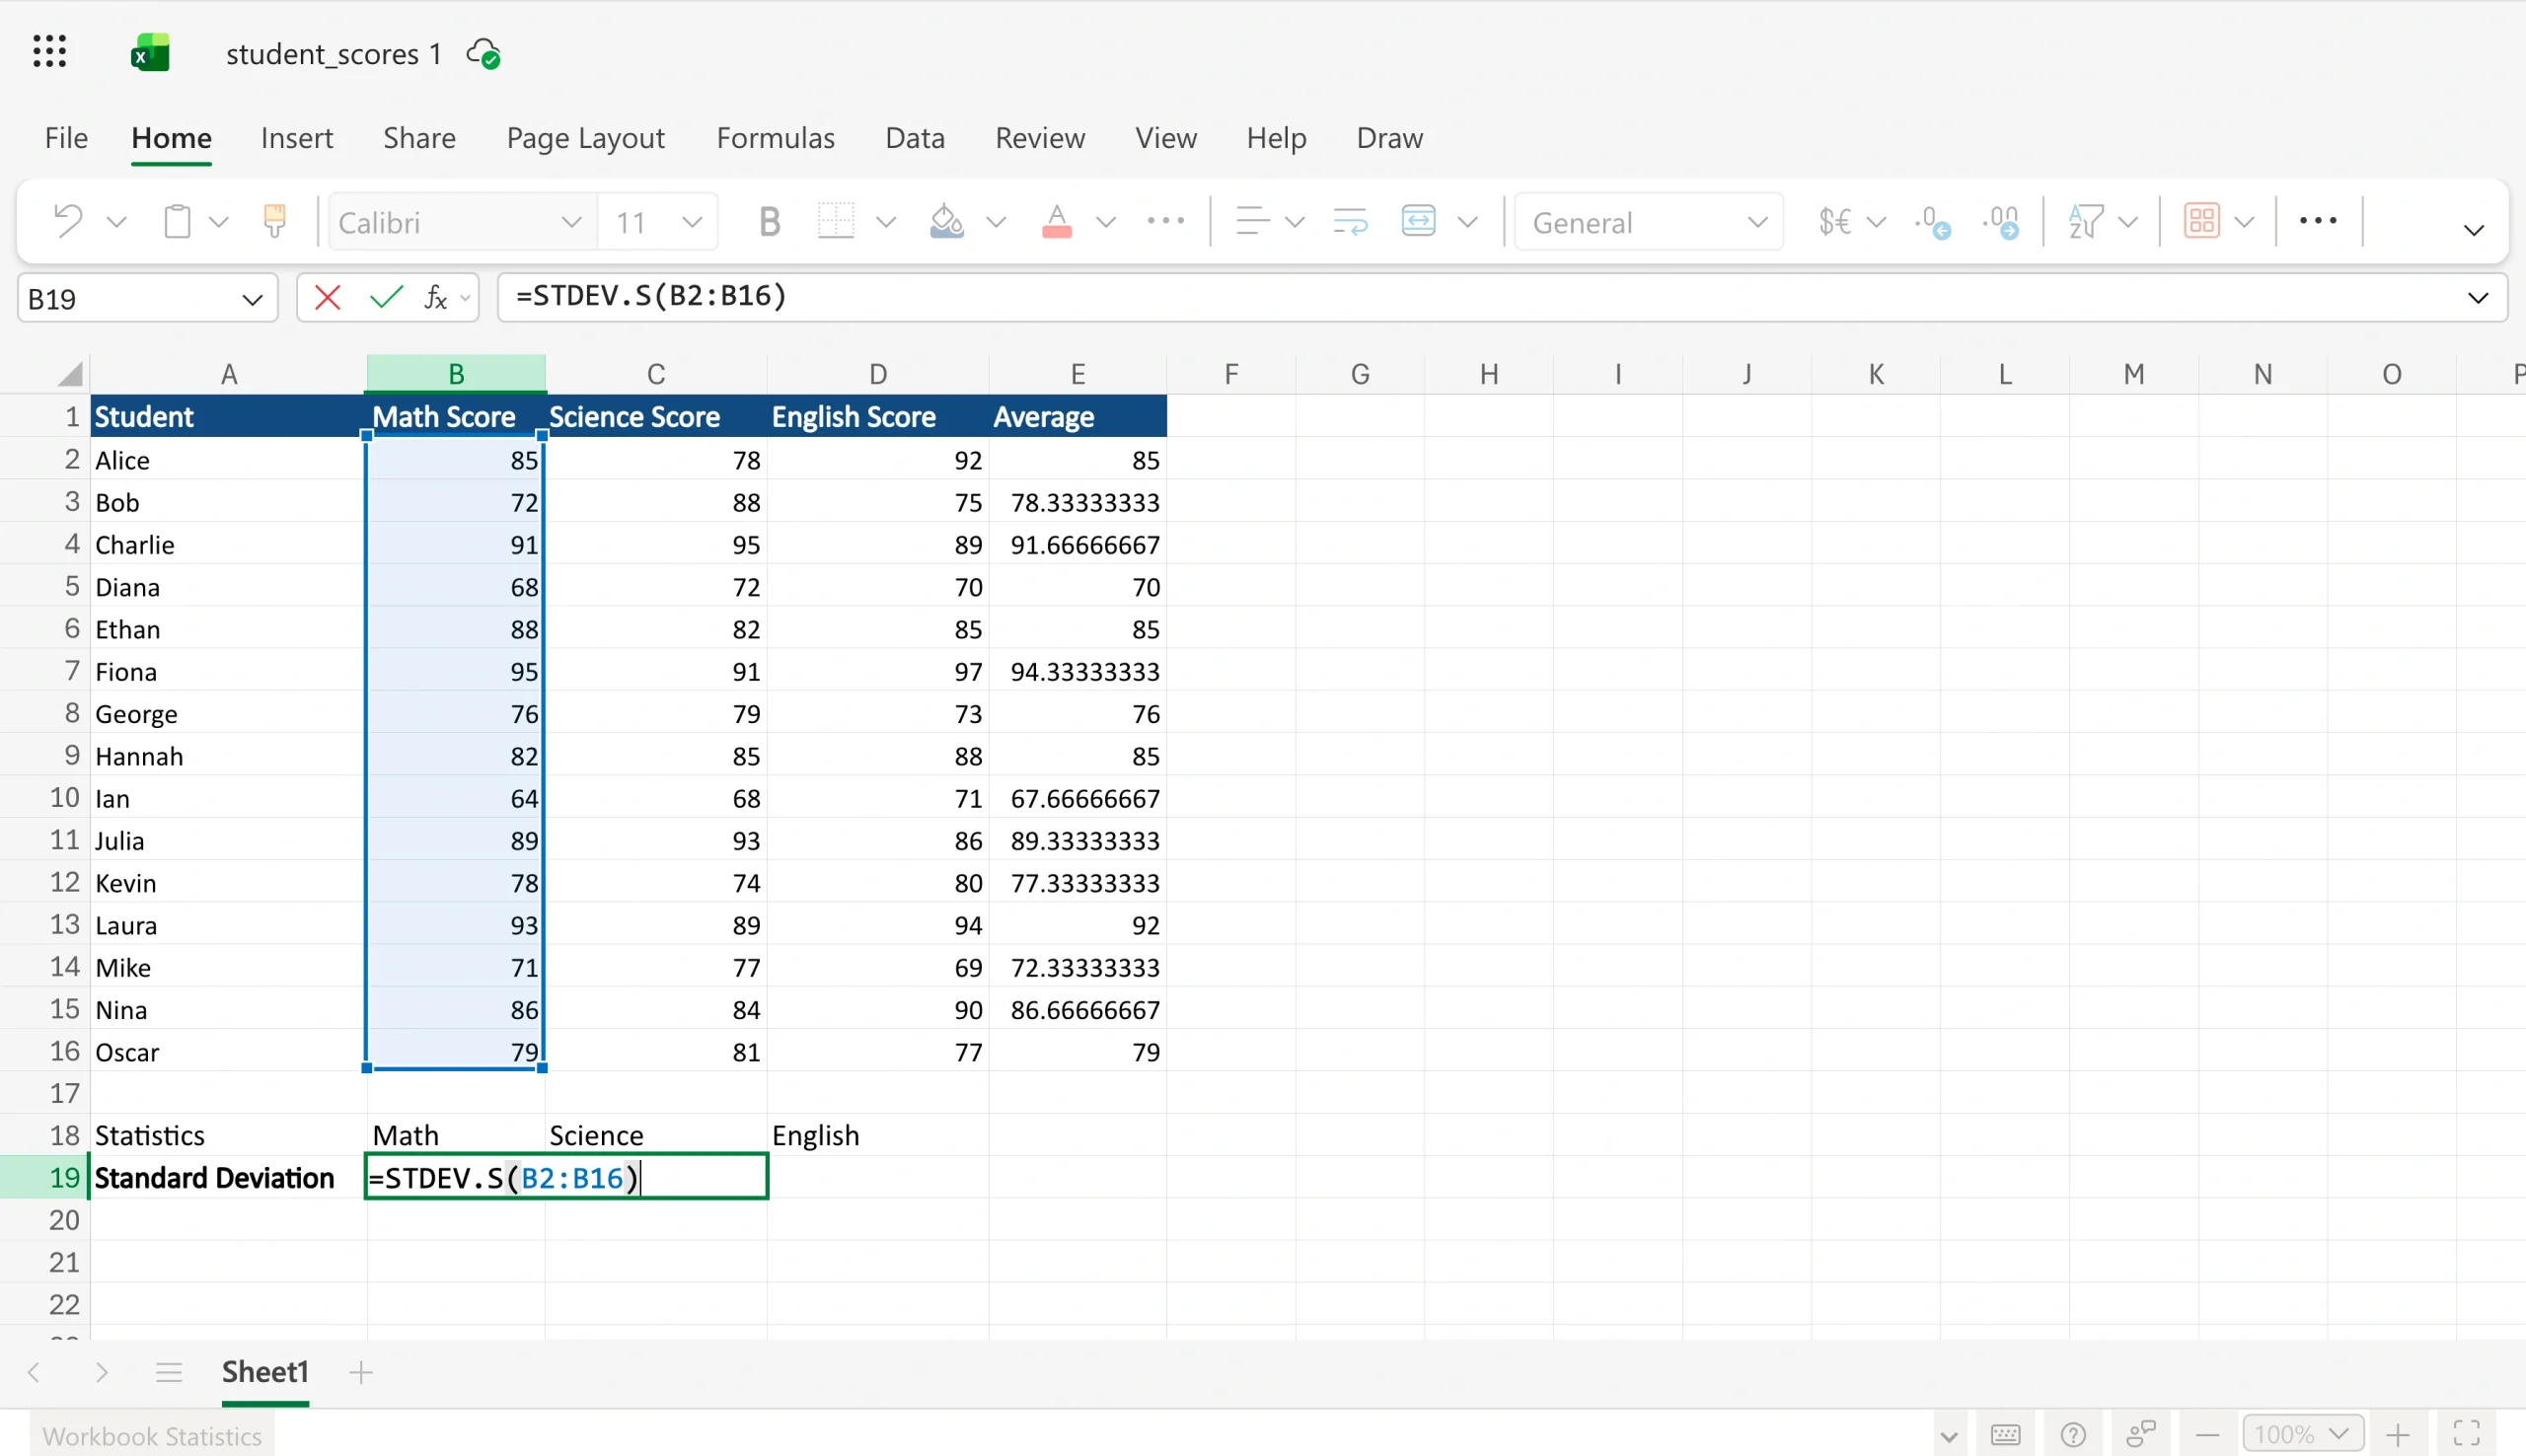
Once you start typing your formula, Excel highlights the selected cells in a color, and that same color appears in the formula itself, so it’s easy to confirm you’ve selected exactly the right data.
Note: If you want to calculate using only specific cells rather than an entire range, you can list the cells individually. The formula would be =STDEV.S(B2,B5,B9). This tells Excel to calculate standard deviation using only those three cells, skipping everything in between.
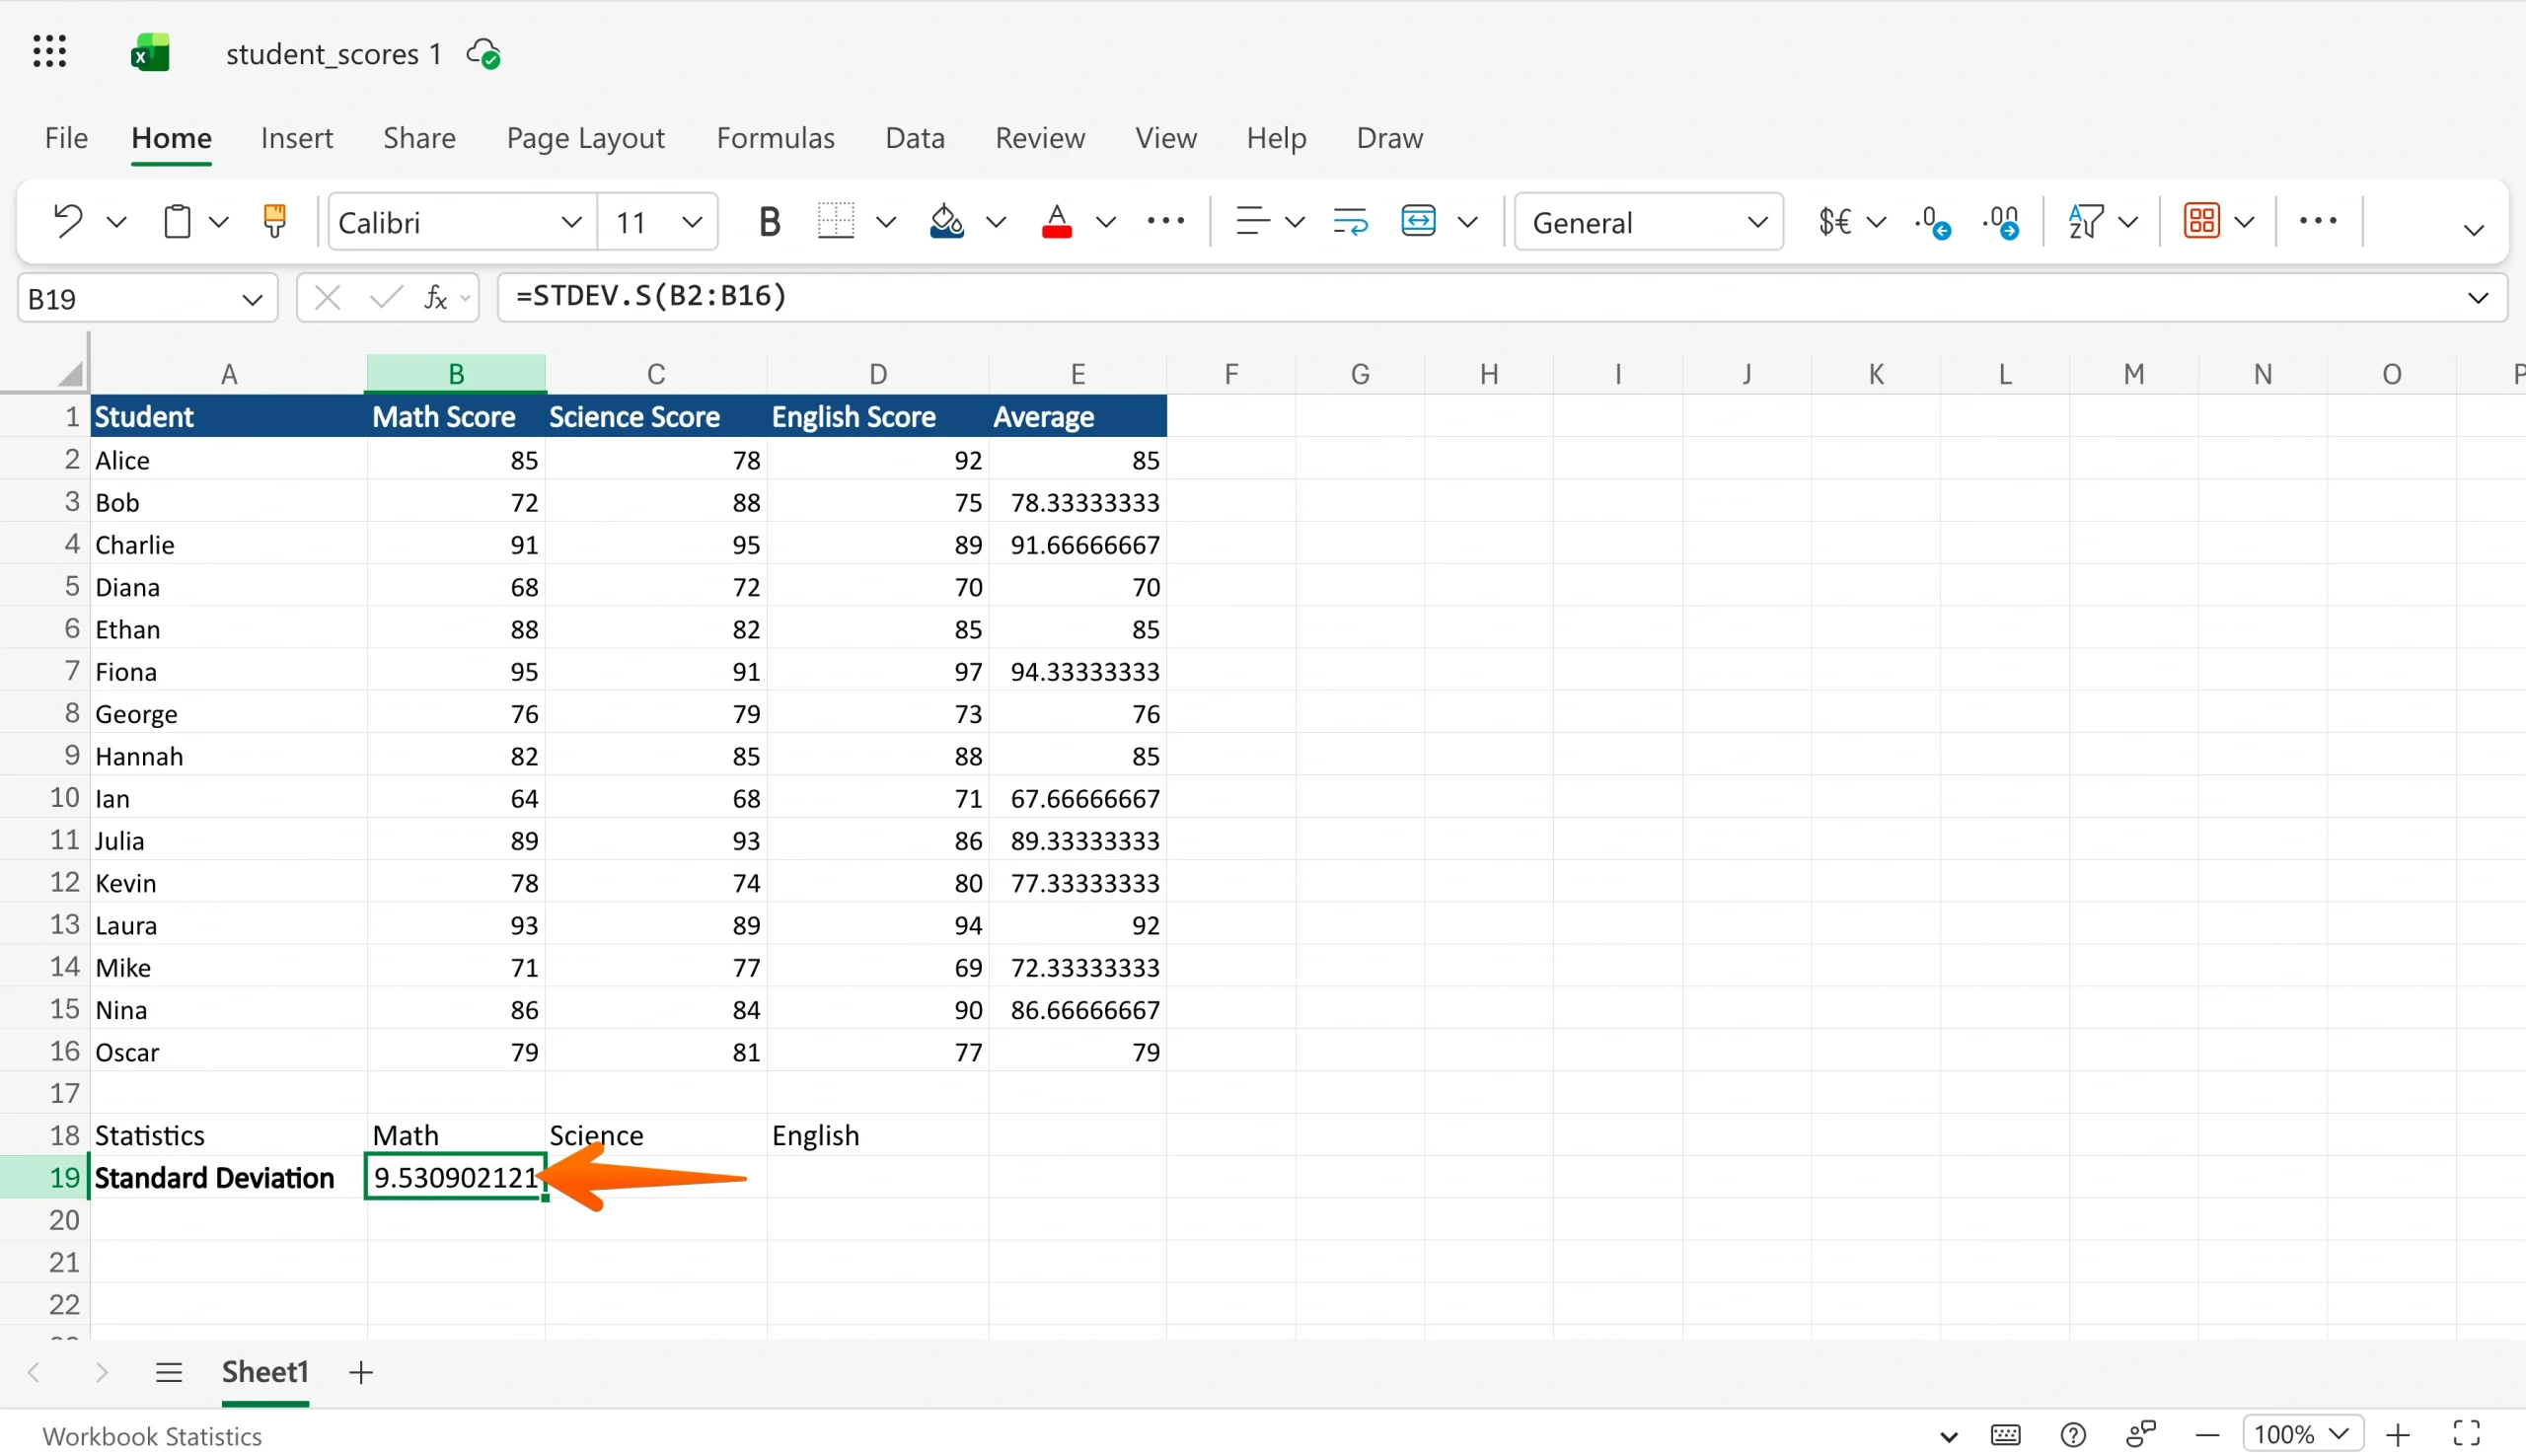
4. Press Enter and review the result
Hit Enter, and Excel will display the standard deviation in your chosen cell.
A higher number means your data points are more spread out from the average. A lower number means they are clustered closely together.
Here’s what my example looked like:
Tip: If you have multiple columns to calculate, such as the different classes in my example, you don’t need to retype the formula each time.
- Simply click the cell containing your formula (in my example, it’s B19)
- Hover over the bottom right corner of the cell until you see a small, black cross
- Then drag and drop it across the other columns (in my example, cells C19 and D19)
- Excel will automatically update the cell ranges for each column
Example of standard deviation in Excel
Here are two examples showing the standard deviation formula in Excel in context and showing STDEV.S vs STDEV.P.
Example using STDEV.S
I used STDEV.S for my previous example because it’s the most commonly used formula for calculating standard deviation.
STDEV.S assumes that your data is a sample. In my data, perhaps these are the results of half the class, or one of many classes.
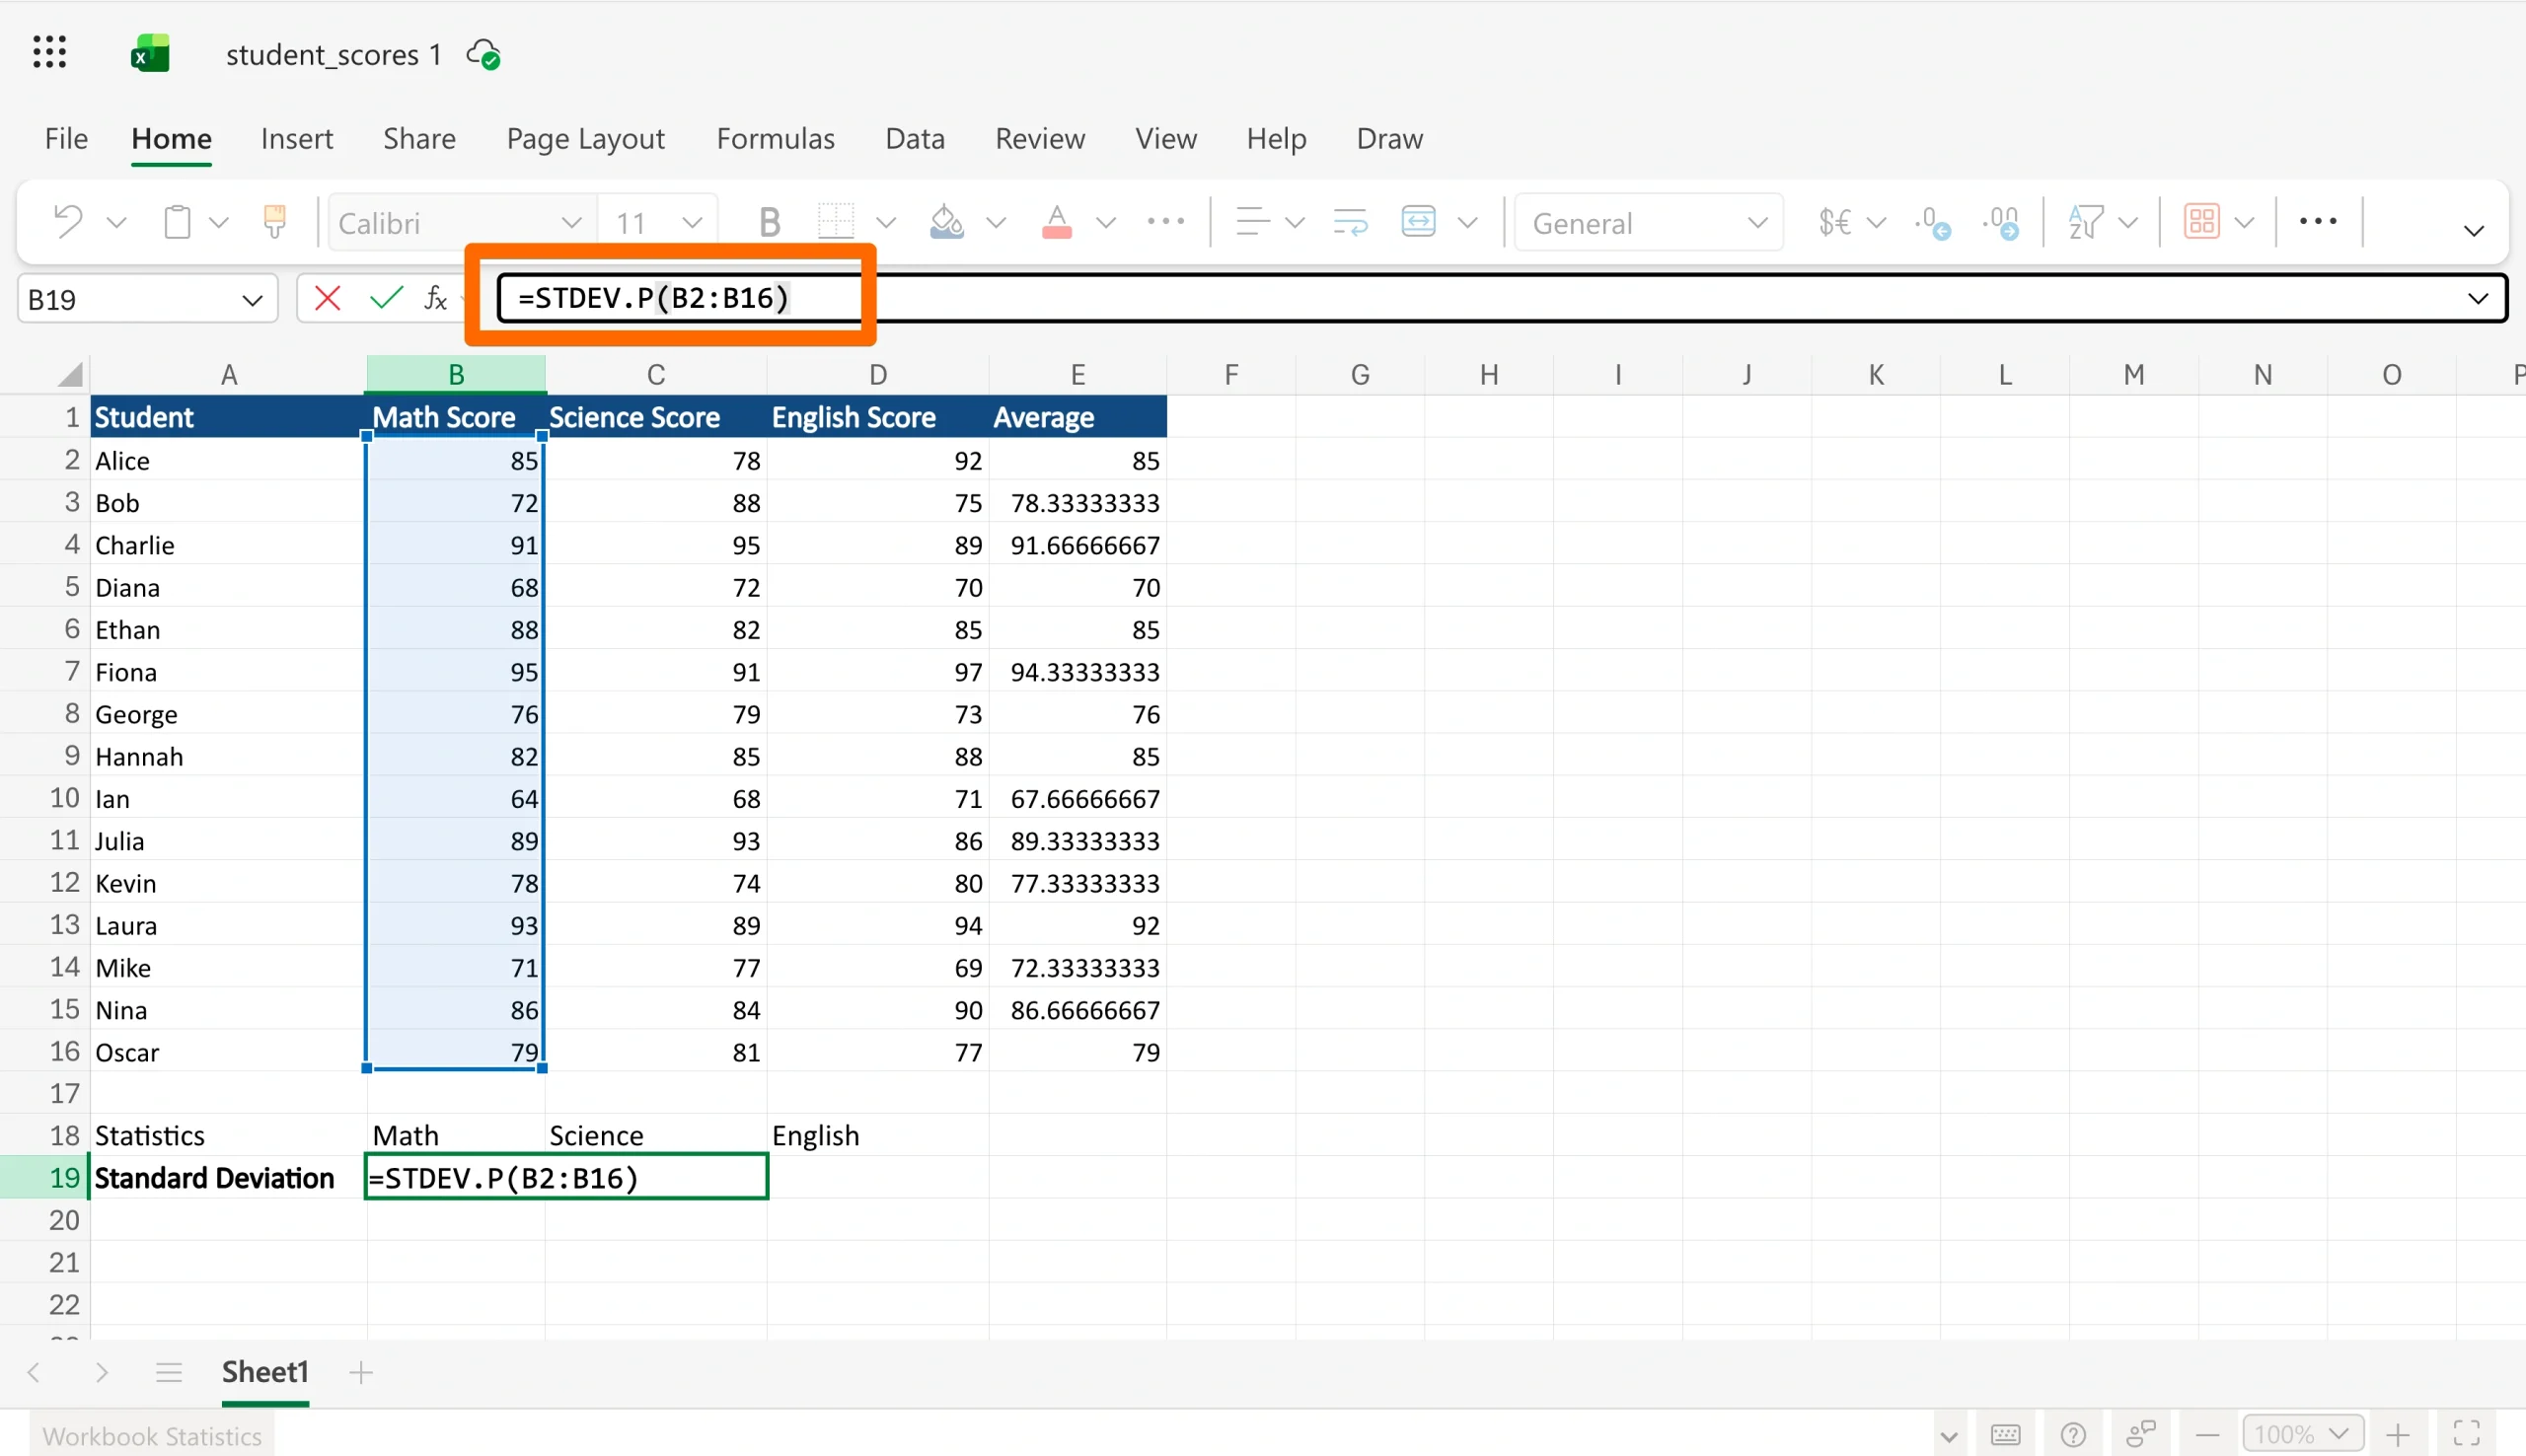
Example using STDEV.P
If the entire class or all of the classes were represented in the data, I’d use STDEV.P for population.
The formula would look like this: =STDEV.P(B2:B16).
Looking for more guides on using Microsoft Excel? Read Jotform’s Microsoft Excel tutorial.
Which standard deviation formula should you use in Excel?
The formula you choose depends on what your data represents. If you’re unsure, STDEV.S is the safer default for most everyday analysis.
Use STDEV.S for a sample
Use STDEV.S when your data is a subset of a larger group.
Some common examples are
- Survey responses from 50 customers out of thousands
- Test scores from one class out of many
- Sales figures from one region out of several
Most analysts, students, and business users will use data that falls into the sample category and should therefore use STDEV.S.
The formula for STDEV.S is
=STDEV.S(B2:B16)
Note: The cells (B2:B16) are an example; adjust as needed to represent the cells that hold your data.
Use STDEV.P for a population
Use STDEV.P when your data includes every value in the group you’re measuring, not just a selection.
Some common examples are
- Scores of every student in one class
- Output of every machine in a single factory
- Monthly revenue figures for an entire year
The formula for STDEV.P is
=STDEV.P(B2:B16)
Note: The cells (B2:B16) are an example; adjust as needed to represent the cells that hold your data.
Tip: If you’re unsure which to use, ask yourself: Is this all of the data, or just some of it? If it’s all of it, use STDEV.P. If it’s a selection, use STDEV.S.
Why STDEV.S and STDEV.P produce different results
You may have noticed that STDEV.S and STDEV.P return slightly different numbers even when given identical data.
Here’s why:
- STDEV.S assumes your data is a sample, so it applies a correction that slightly inflates the result to account for the fact that a sample may not perfectly represent the full population. This makes the estimate more conservative and more reliable when you don’t have every data point.
- STDEV.P assumes you have the complete dataset, so no correction is needed. It calculates the exact spread across every value you have.
STDEV.S will always return a slightly higher number than STDEV.P on the same dataset. The difference is usually small, but it matters: Using the wrong formula can lead you to underestimate or overestimate how much variation exists in your data, which can affect decisions built on that analysis.
When in doubt, use STDEV.S. It is the more cautious of the two and the right choice for the vast majority of everyday analyses.
Common mistakes when calculating standard deviation in Excel
A few small, easy-to-make errors can end up creating unreliable results. Here are the most common ones to watch out for:
- Using the wrong formula: It’s easy to mix up STDEV.P and STDEV.S. Remember to use STDEV.P on a full population and STDEV.S on a sample. Always check whether your data is a subset or the complete dataset before choosing your formula.
- Selecting the wrong cells: Accidentally including a header row, a blank cell, or an extra value at the bottom of your range will throw off your result. Double-check that your cell range contains numbers only.
- Misreading the result: Standard deviation measures spread, not average. A result tells you how far values tend to stray from the average value.
If you want to skip the complex formulas entirely and just get an answer, try Jotform’s standard deviation calculator form. It does everything for you. All you need to do is paste in your numbers and you’ll get an instant result, minimizing the chance of making these common mistakes.
Pro Tip
Excel makes standard deviation easy to calculate once your data is in place. But if your data is incomplete or inconsistent, your analysis becomes less trustworthy. Jotform can help teams collect cleaner, more structured data before it reaches Excel.
Cleaner data makes Excel analysis easier
Excel is excellent for calculating standard deviation and getting the formula right. However, your standard deviation result is only as reliable as the numbers behind it. The data needs to be correct, complete, and consistent.
With Jotform, teams can use online forms to collect structured, consistent information. Every submission follows the same format, which means fewer errors and less cleanup before your data reaches Excel.
Jotform Tables organizes all your submissions in one place so your data is already sorted before you open a spreadsheet. And with the Jotform Microsoft Excel integration, responses feed into Excel automatically, skipping the copy-paste step.
The result is a cleaner, faster workflow: Collect with Jotform, analyze in Excel.
This article is for Excel users, students, analysts, finance teams, and business users who need to calculate standard deviation correctly and understand which Excel formula to use.


Send Comment:
1 Comment:
April 5, 2021
How to l copy excel sheet to another workbook VBA