
Steps to create a database in Excel
- Create a data spreadsheet
- Add or import data
- Convert your data into a table
- Customize the table design and assign a name
- Interact with the data
Every business has numbers to crunch, but not every CEO is a math wiz. That’s why small business owners often outsource their accounting or let their bookkeeper deal with it.
However, there are many other ways you can process data to make operations more efficient. Plus, you probably want to avoid constantly running to someone else for help.
That’s where a basic knowledge of Excel databases comes in handy.
Excel is one of those tools that almost everyone has on their desktop, and you can enjoy its benefits without being a numbers wizard.
Excel databases provide a simple way to analyze data (such as sales numbers and forecasts), look at various calculations, and compare different data sets. Of course, there are advanced formulas and functions if you dive deeper and invest time in becoming a pro. But for many business owners, just knowing how to create a database in Excel will give them a lot of power.
Let’s take a step-by-step tour of using Excel to create a database.
Just so you know
Learn how to make the most of your data with Jotform’s detailed Microsoft Excel tutorial. You can even integrate Jotform with Excel to sync form data to your spreadsheets!
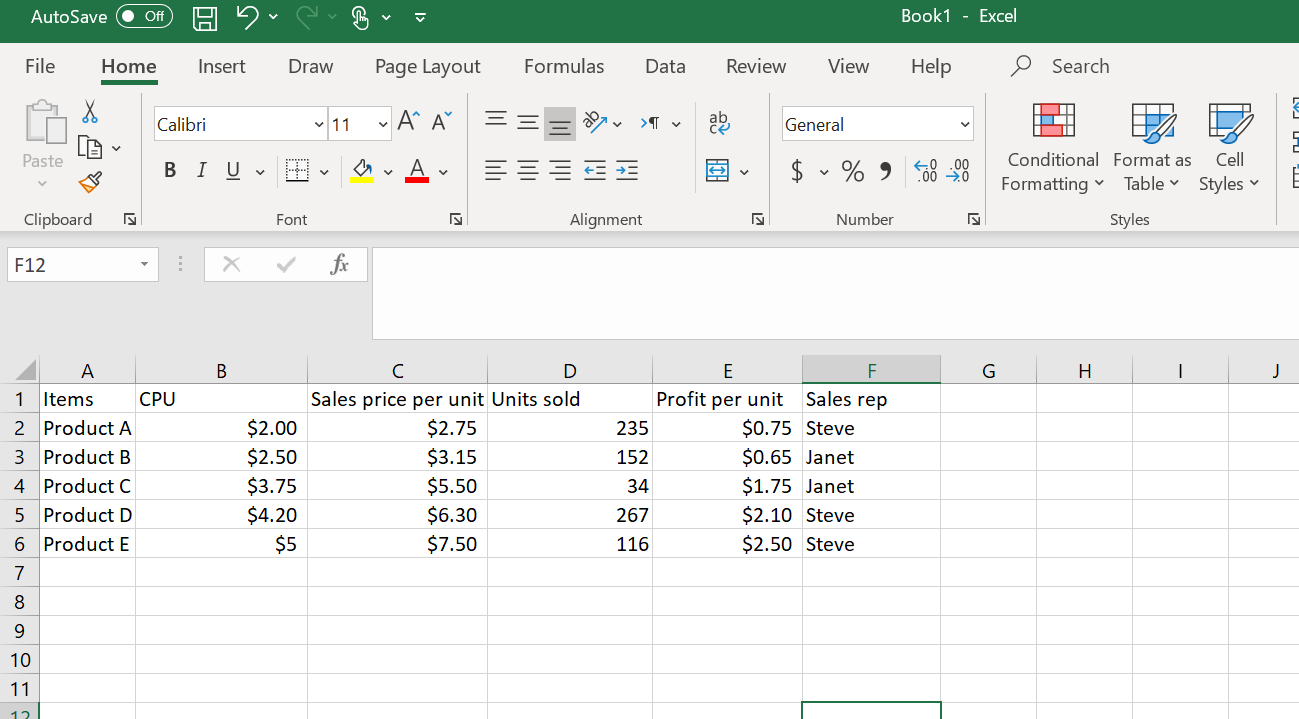
1. Create a data spreadsheet
Start by opening a new Excel sheet.
The Excel sheet is made up of vertical columns and horizontal rows, with each row representing a different line of data. Columns are labeled with letters, and rows are labeled with numbers.
The first row should display the names for each column. Click on a cell in the first row and begin typing to insert header names. The Tab button is a quick way to navigate the table; each time you press the Tab button, you’ll jump to the next column in a row. When you reach the end of a row, the cursor will jump to the first column of the next row, and so on.
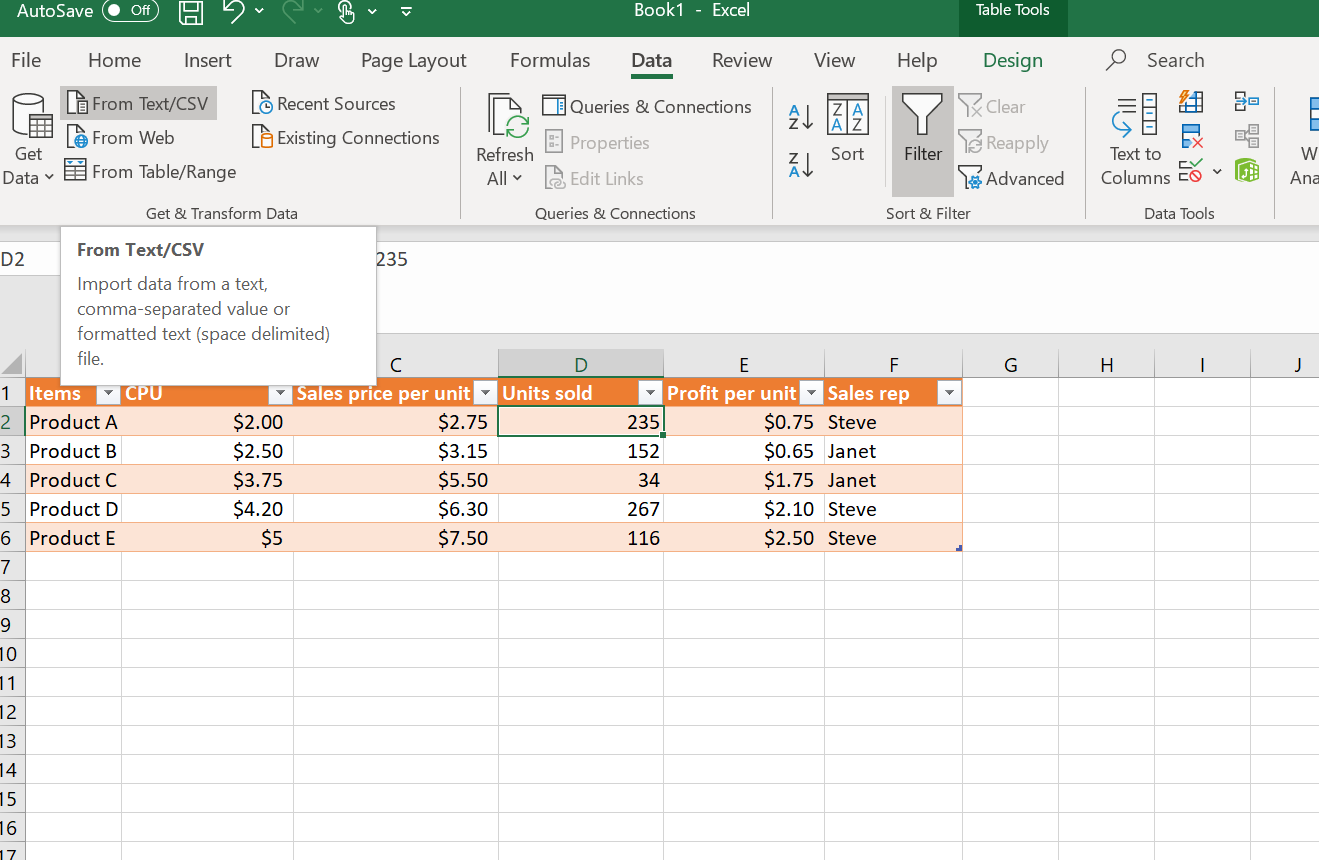
2. Add or import data
You can add data in two ways: by entering it manually or importing data from other files, such as text or CSV files.
To add data manually, click on a cell and begin typing. To insert a new row or column, go to the Home tab and look for the Cells section. There you’ll find the Insert dropdown arrow. By clicking on the arrow, you can select the item you want to insert (i.e., column, row, etc.).
To import data from outside sources, click on the Data tab, go to the Get/Transform Data section, and select the source destination. In order to import data successfully, you must ensure that the data has the correct formatting, and formatting depends on the type of source file.
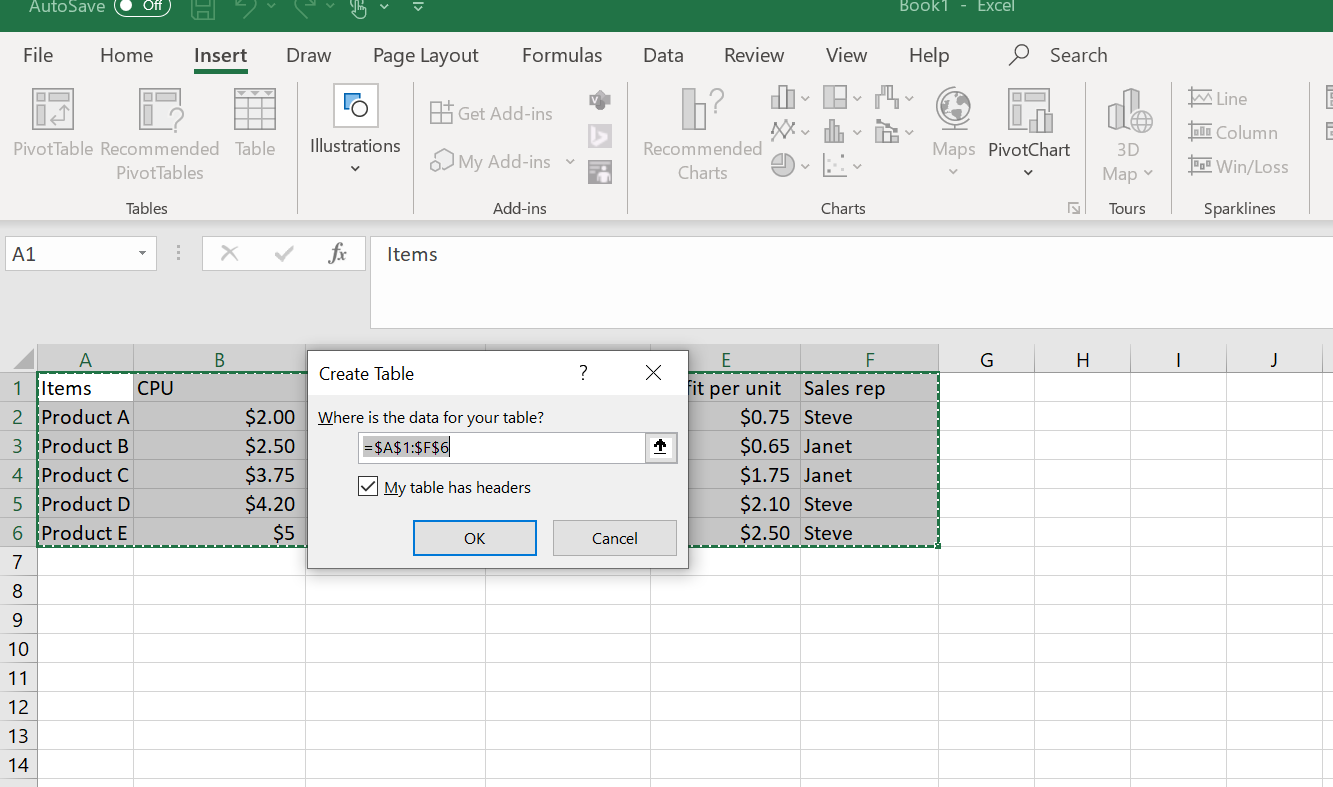
3. Convert your data into a table
To get the functionality of a database, you must convert the data into a table.
Click your mouse on any cell of the data you entered, and then click on Insert >Table. A popup box will appear, showing you the data fields to be included in the table. The table will automatically incorporate all the rows and columns in the block. It’s important not to leave any blank rows in your data block — these act as “breaks” and indicate to the software that they aren’t part of the table.
If the correct fields are shown in the dialog box and your headers are in order, click OK.
Remember, any blank rows are not automatically integrated into the table. To include newly entered data in the table, hover on the small triangle nestled in the bottom right corner of the current table and drag the table border down to include the new data rows.
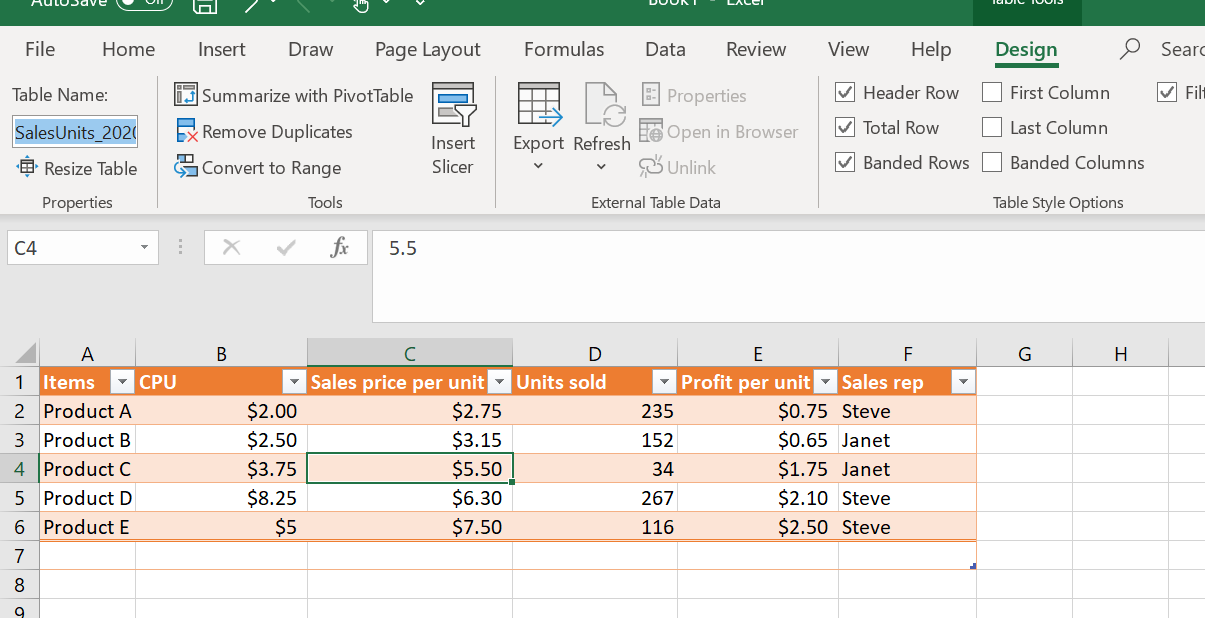
4. Customize the table design and assign a name
There are several options for table design, but don’t spend a lot of time on this. Making your table easily viewable is the aim of the game.
Click the Design tab on the main menu. Change the table colors with a quick click on one of the predefined color themes. The default table design features banded rows, meaning every second row has a background fill. Many users like this style, as it makes the data easier to view. Uncheck the Banded Rows box if you prefer a clean, white table.
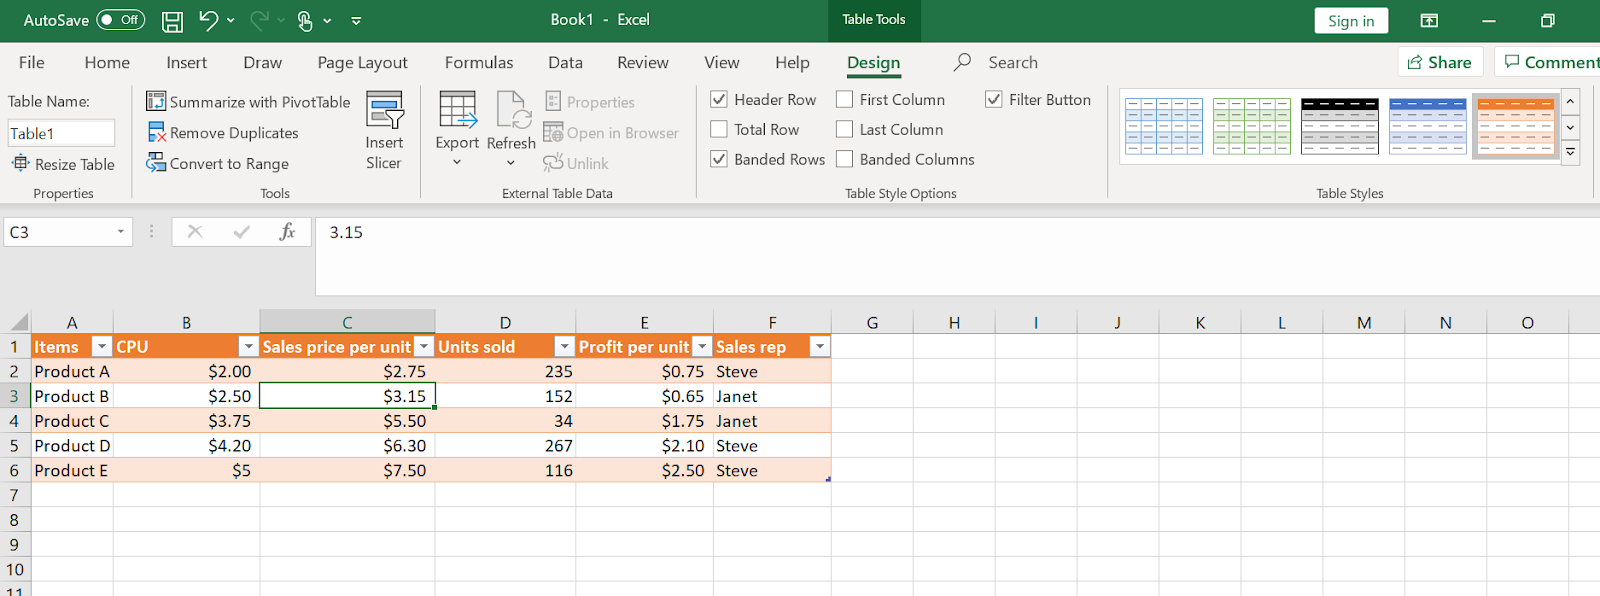
In the far left section of the Design toolbar, you can change the table name. Give it a name that is specific and easy to identify. This will help later down the road when you’re working with many Excel databases.
5. Interact with the data
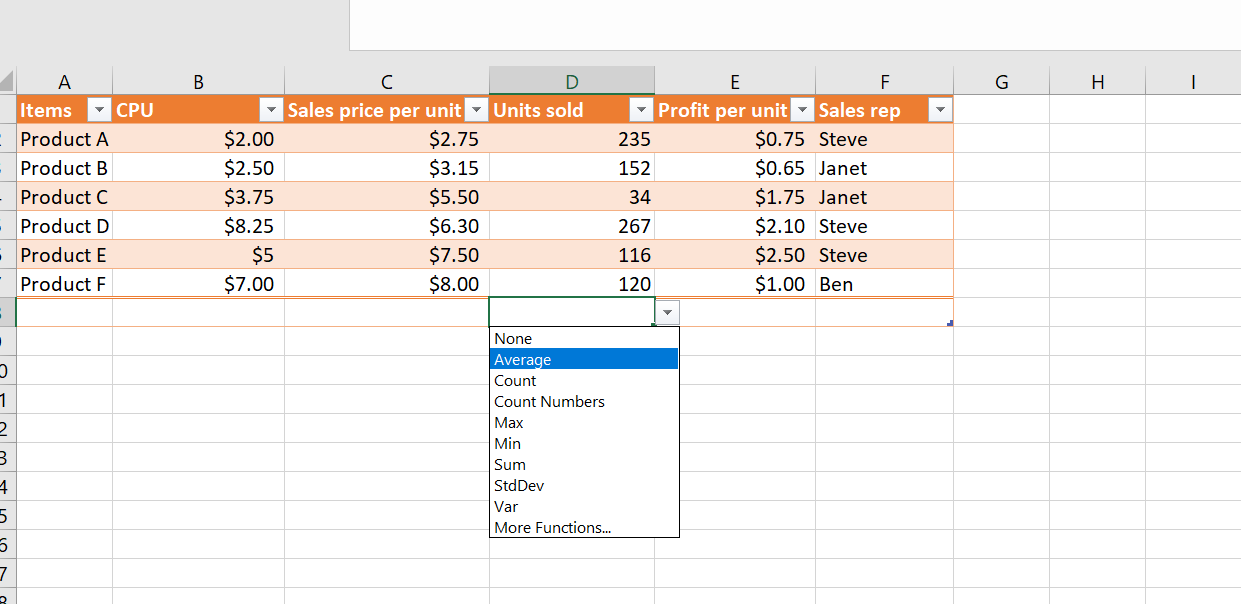
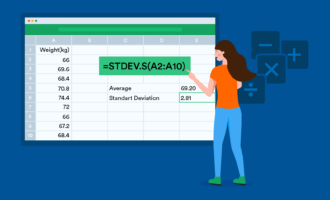
Once your table is set up, it’s time to start interacting with it and getting the insights you need. Several formulas are predefined in Excel software, including Average, Count, and Sum, among others. If you need a deeper measure of how spread out your data is, here’s how to calculate standard deviation in Excel.
Click on the cell at the base of any data column you want to work with. The cell displays a clickable arrow that opens a dropdown menu of available formulas. Select the formula, and the calculation will automatically appear in the cell.
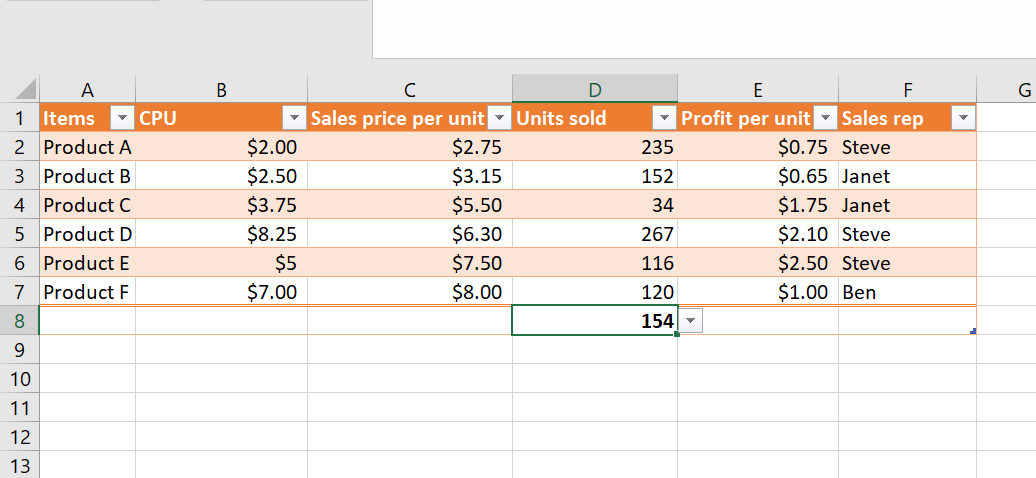
In the example below, we’re calculating the average number of units sold. The Average formula is an option in the dropdown menu.
The average number of units sold is calculated and appears in the cell.
There are so many ways you can use Excel to perform calculations and derive useful data for decision-making. Now that you’ve created a database in Excel, you can explore all the available features and functionality.
Go beyond Excel: Working with Jotform Tables
While Excel is a longstanding favorite for number crunching, tools like Jotform Tables can give you much more than a spreadsheet. Jotform Tables provides a full workspace for managing, tracking, and processing data, and integrating it into workflows and collaboration for smoother operations.
If you work with Excel databases, you can easily import them into Jotform Tables and continue your data management there. And as a free tool, Jotform Tables requires none of the investment and licenses you need with Excel.
For companies already using Jotform, Jotform Tables is the next step, as it enables you to build effective data-based strategies so your business can truly excel.


Send Comment: