Jotform Insights
From Data Points to Smart Decisions
Jotform Insights brings all your data together in one place — from forms to apps, workflows, AI agents, and sign documents. With built-in dashboards, flexible filters, and exportable reports, you’ll never need to juggle spreadsheets or third-party tools again

All analytics at a glance
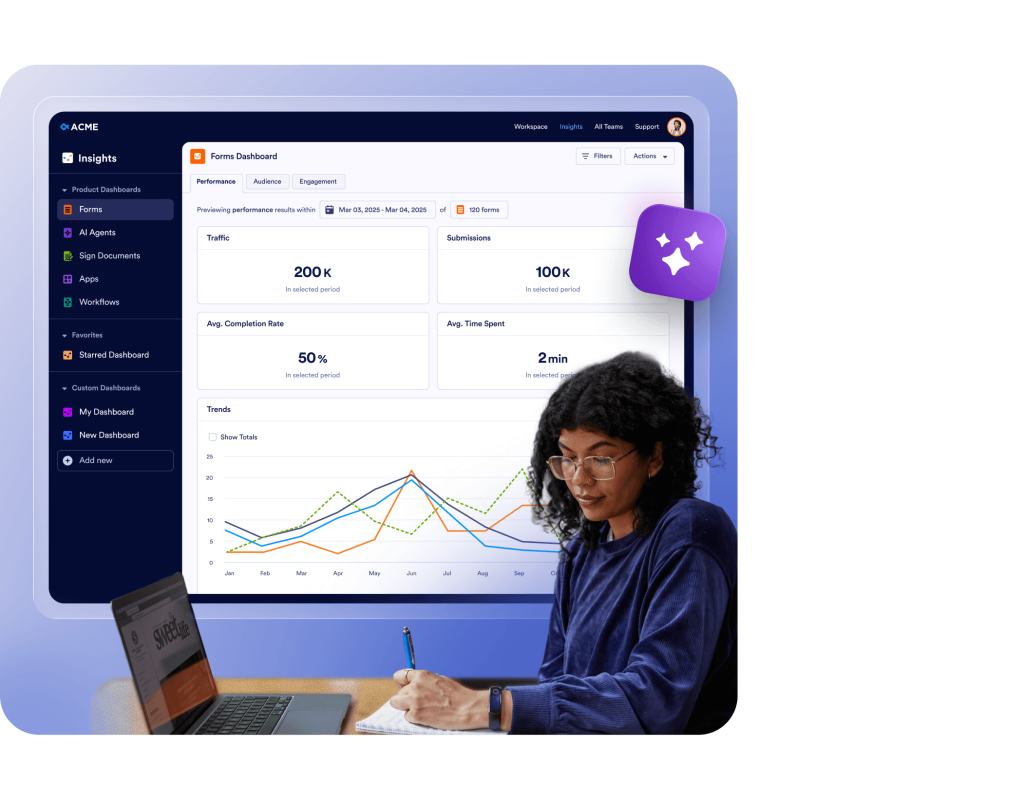
Keep an eye on form performance
Track form traffic, submissions, completion rates, and the amount of time it takes for users to complete forms. See how your forms perform across devices and channels, and uncover opportunities to improve engagement and completion rates.
Contact SalesForm analytics Contact Sales
Spot bottlenecks before they slow you down
Monitor automation efficiency with metrics like the number of flow runs, completion times, and workflow participant types. Identify bottlenecks and improve collaboration across teams for smoother operations.
Contact SalesForm analytics Contact Sales
Prove that automation delivers results
Measure the performance of your AI agents with detailed insights into conversations, session counts, handling types, and success rates. See how AI supports your users, reduces manual work, and improves response times.
Contact SalesAI agent analytics Contact Sales
Achieve clarity from invite to signature
Track pending, completed, and incomplete signatures. See trends over time with a view of the overall signer funnel, including which devices are most often used to sign documents, the countries where signers are located, and more. Identify the reasons for incomplete signatures to optimize your signature workflows.
Contact SalesApp analytics Contact Sales
See how your apps perform across every touchpoint
Analyze app downloads, active users, and engagement over time. Gain visibility into user activity by device, location, and source to improve adoption, retention, and the overall mobile experience.
Contact SalesApp analytics Contact Sales
Go from guessing to knowing

Track submissions, completions, time spent, workflow runs, and conversation counts in real time. With clear performance data, you can identify bottlenecks, reduce drop-offs, and make smarter improvements
See who’s behind the numbers

Understand who engages with your assets through rich analytics on location, device, source, and behavior. Identify your most active segments, uncover what drives engagement, and tailor experiences that resonate — helping you increase response counts, completion rates, and overall conversions

Customize your data
Create your own custom dashboard with flexible line, bar, and pie charts — or simple card views — to track the metrics that matter to you. Build a personalized dashboard that provides instant clarity across all of your forms.
Contact Sales
Compare smarter. Improve faster

View your assets side by side — from Forms and Apps to Workflows, Sign Documents, and AI Agents — and instantly see what’s performing best. With clear, comparative insights, you can identify trends, optimize weaker areas, and make every decision backed by data, not assumptions
Get insights without the fuss

Slice your data by any date range and export clean reports to Excel or CSV in seconds. Share insights with stakeholders easily and track progress without messy manual exports
FAQ
What is Insights, and what can I use it for?
Insights is a centralized analytics dashboard that helps you track and understand the performance of your digital assets — including Apps, Forms, Workflows, AI Agents, and Sign Documents. It provides visual data, trend charts, and audience breakdowns so you can improve engagement and results.
How can I view performance metrics for my Forms, Apps, Sign Documents, Workflows, or AI Agents?
Go to the Insights page, select the desired product from the menu on the left, and click on the Performance tab. You’ll see metrics like traffic, submissions, completion rates, and session duration. You can customize which metrics appear in charts and export results for further analysis.
What types of metrics are available in Insights?
Metrics vary by product type:
Forms includes views, submissions, completion rates, and time spent on the form.
Apps shows traffic, downloads, active visitors, and engagement rates.
Workflows displays flow runs, participants, and average duration.
AI Agents provides data on sessions, conversations, and user interactions.
Sign Documents tracks pending, completed, and incomplete documents, plus completion time.
Each section includes visual charts and lists to help you interpret performance trends.Can I filter data by a specific date range?
Yes. Click on the date range filter above your metrics to choose a preset timeframe like Today, Last 7 days, or Last 30 days, or set a custom range. The dashboard will automatically update with the filtered data.
How do I view metrics for a single app, form, workflow, or Sign document?
Select the product type, open the dropdown next to Previewing performance results of, choose the specific item you want to review, and click Apply Changes. You can then view that item’s detailed analytics.
Can I filter metrics by team workspace or owner?
Yes. Within the Insights Data sources panel, click Filter and select a team. This option narrows the results to show only data related to your selected team or creator.
How can I download metrics from Insights?
At the bottom of each product’s dashboard, click the Download dropdown and choose Excel or CSV. The download will automatically begin and will include data for the currently displayed date range.
What should I do if no data appears on the dashboard?
- The date range you selected includes active data
- The form, workflow, or document has recent activity
What can I do with Custom Dashboards in Insights?
With Custom Dashboards, you can create personalized views of your forms’ analytics. Use charts or cards to track specific metrics. Combine data from different forms and display them together in one place for easier comparison and reporting.
Can I use Insights data for reports or presentations?
Absolutely. You can export data from Insights into both Excel and CSV formats. Use these exports to share progress, identify trends, and include performance results in meetings or reports.