Tables is a flexible database tool that lets you gather, monitor, structure, and share data. It provides views and filters to organize your data, making it easy to collaborate and share online.
Creating a blank tab allows you to fully customize the structure of your data. You can define data based on what matters most to you, whether it’s tracking appointments, organizing projects, or managing inventories. It gives you the freedom to build exactly what you need from scratch, making it easier to collect and manage information in a way that fits your specific purpose.
Follow these easy steps to add a blank tab to Tables:
- In Tables, click on the New Tab button.
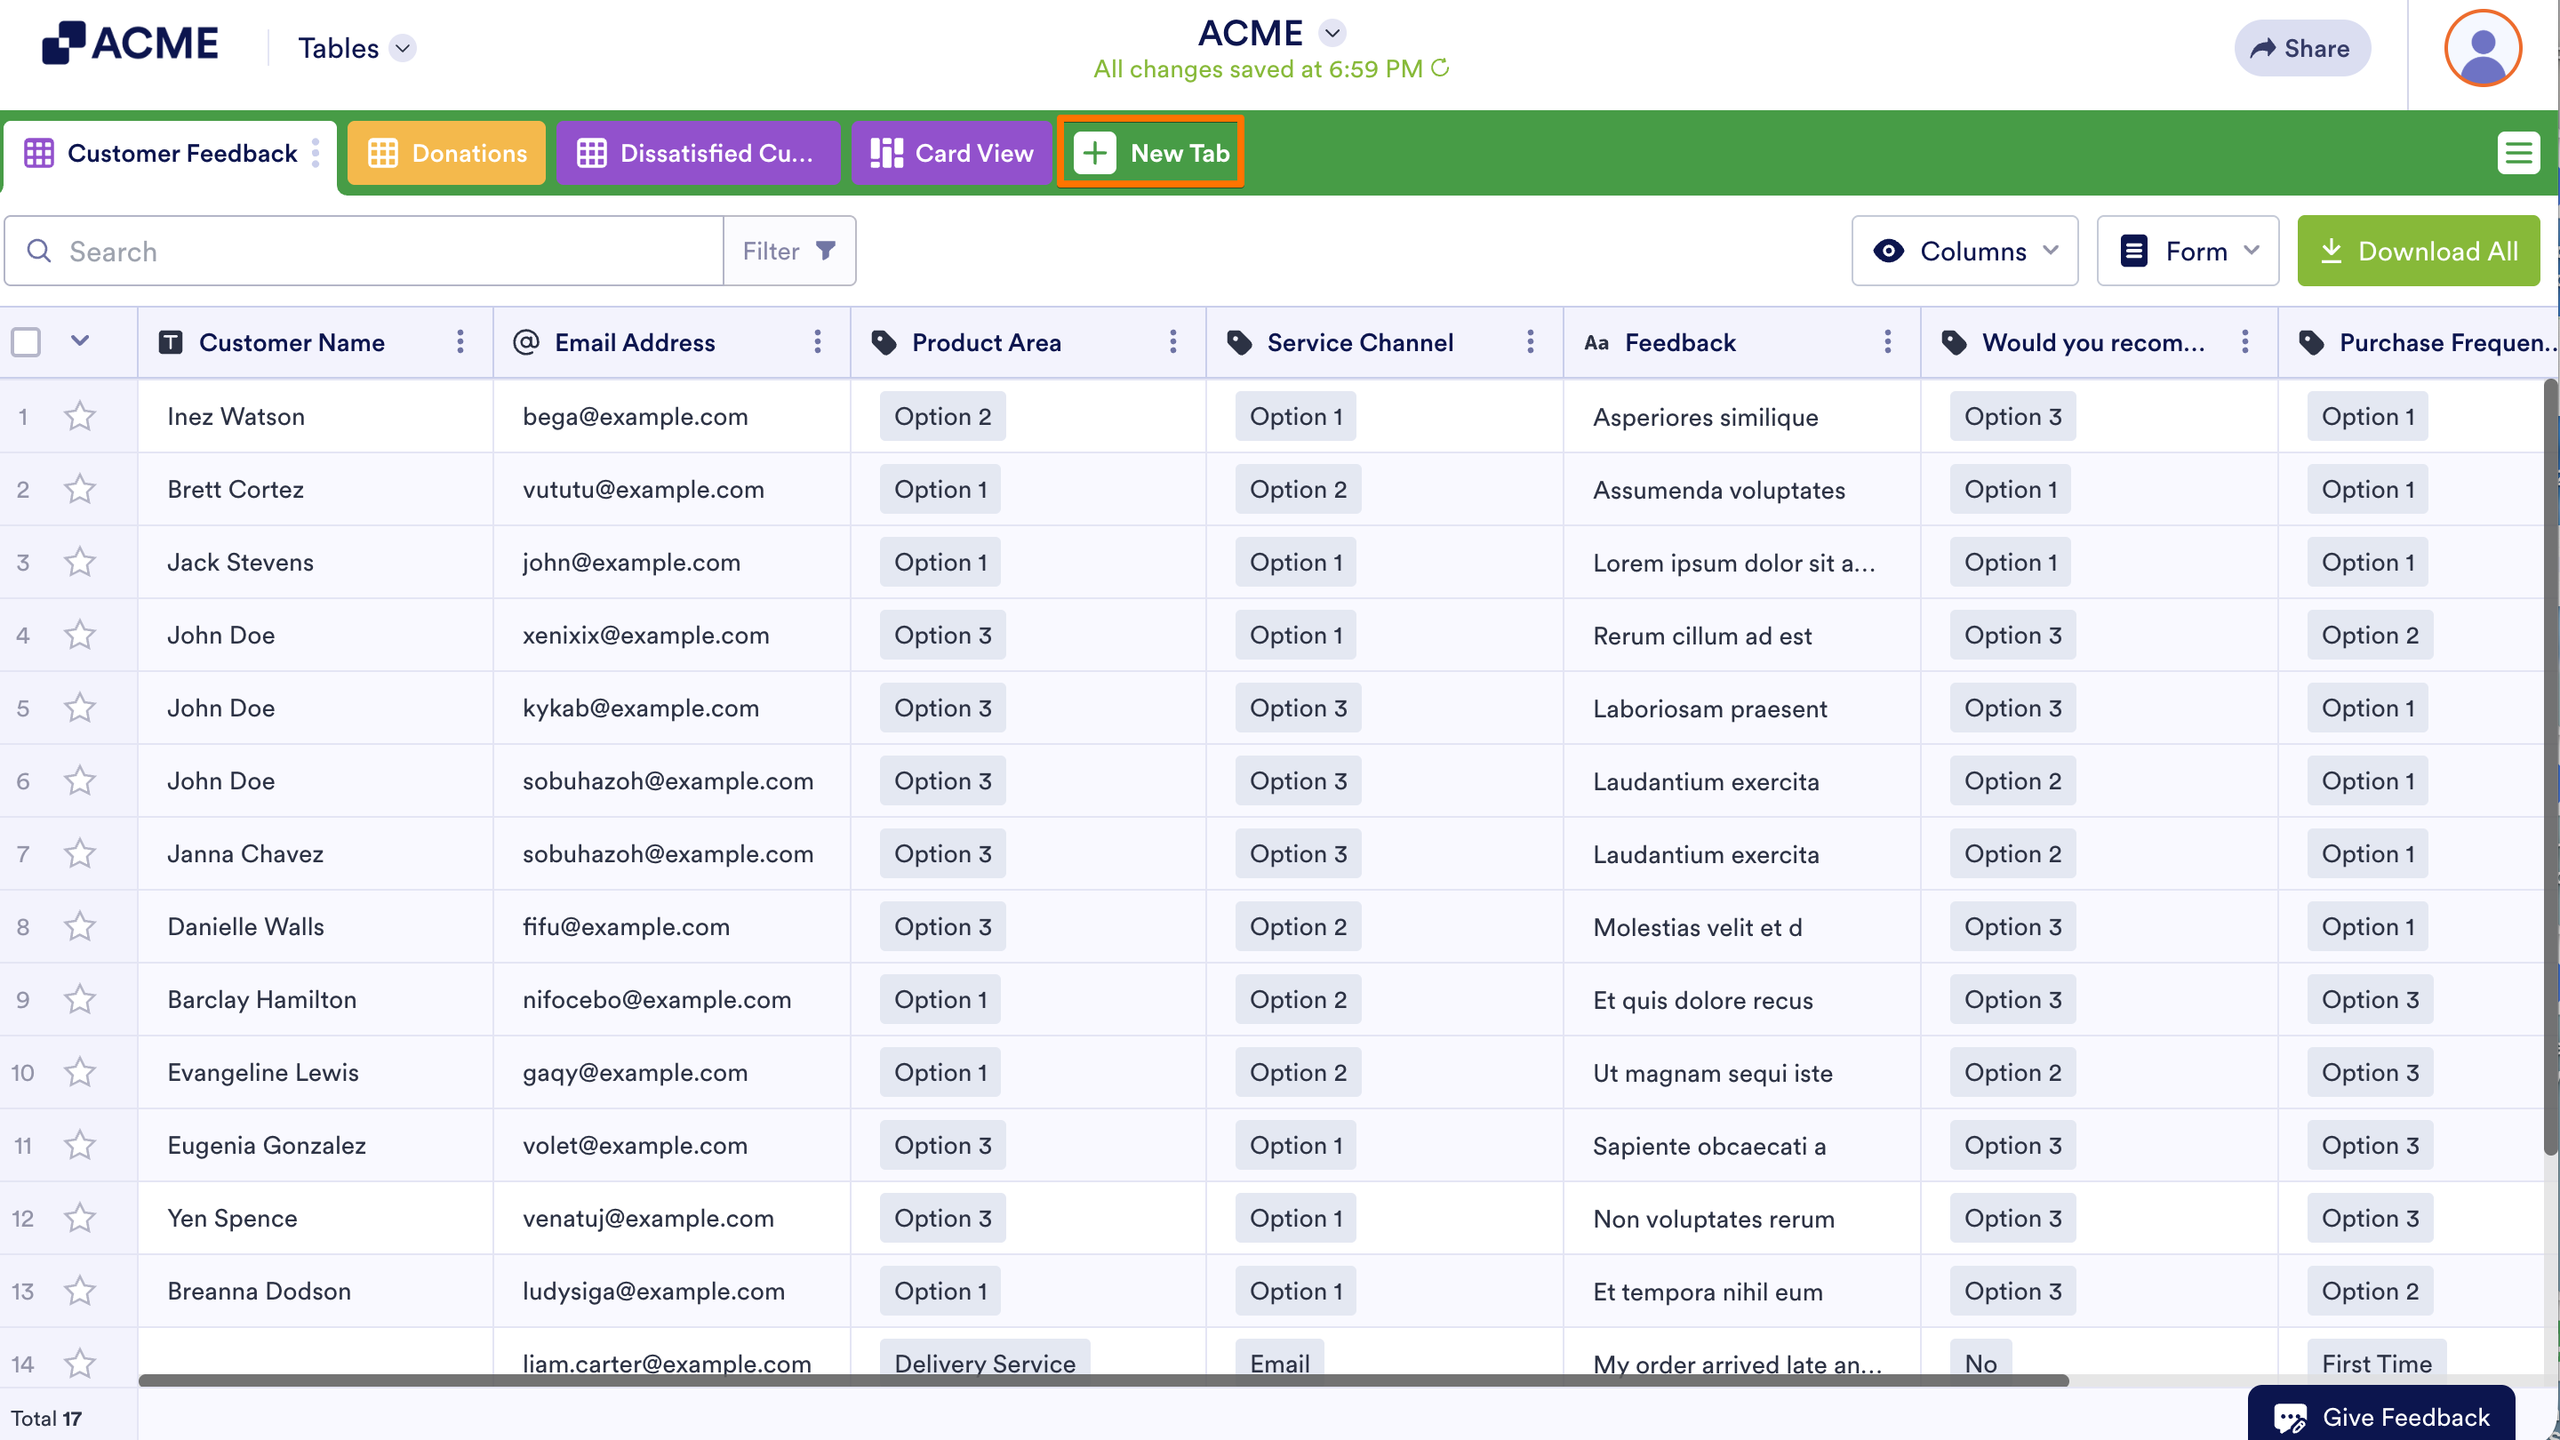
- Then, select a view.
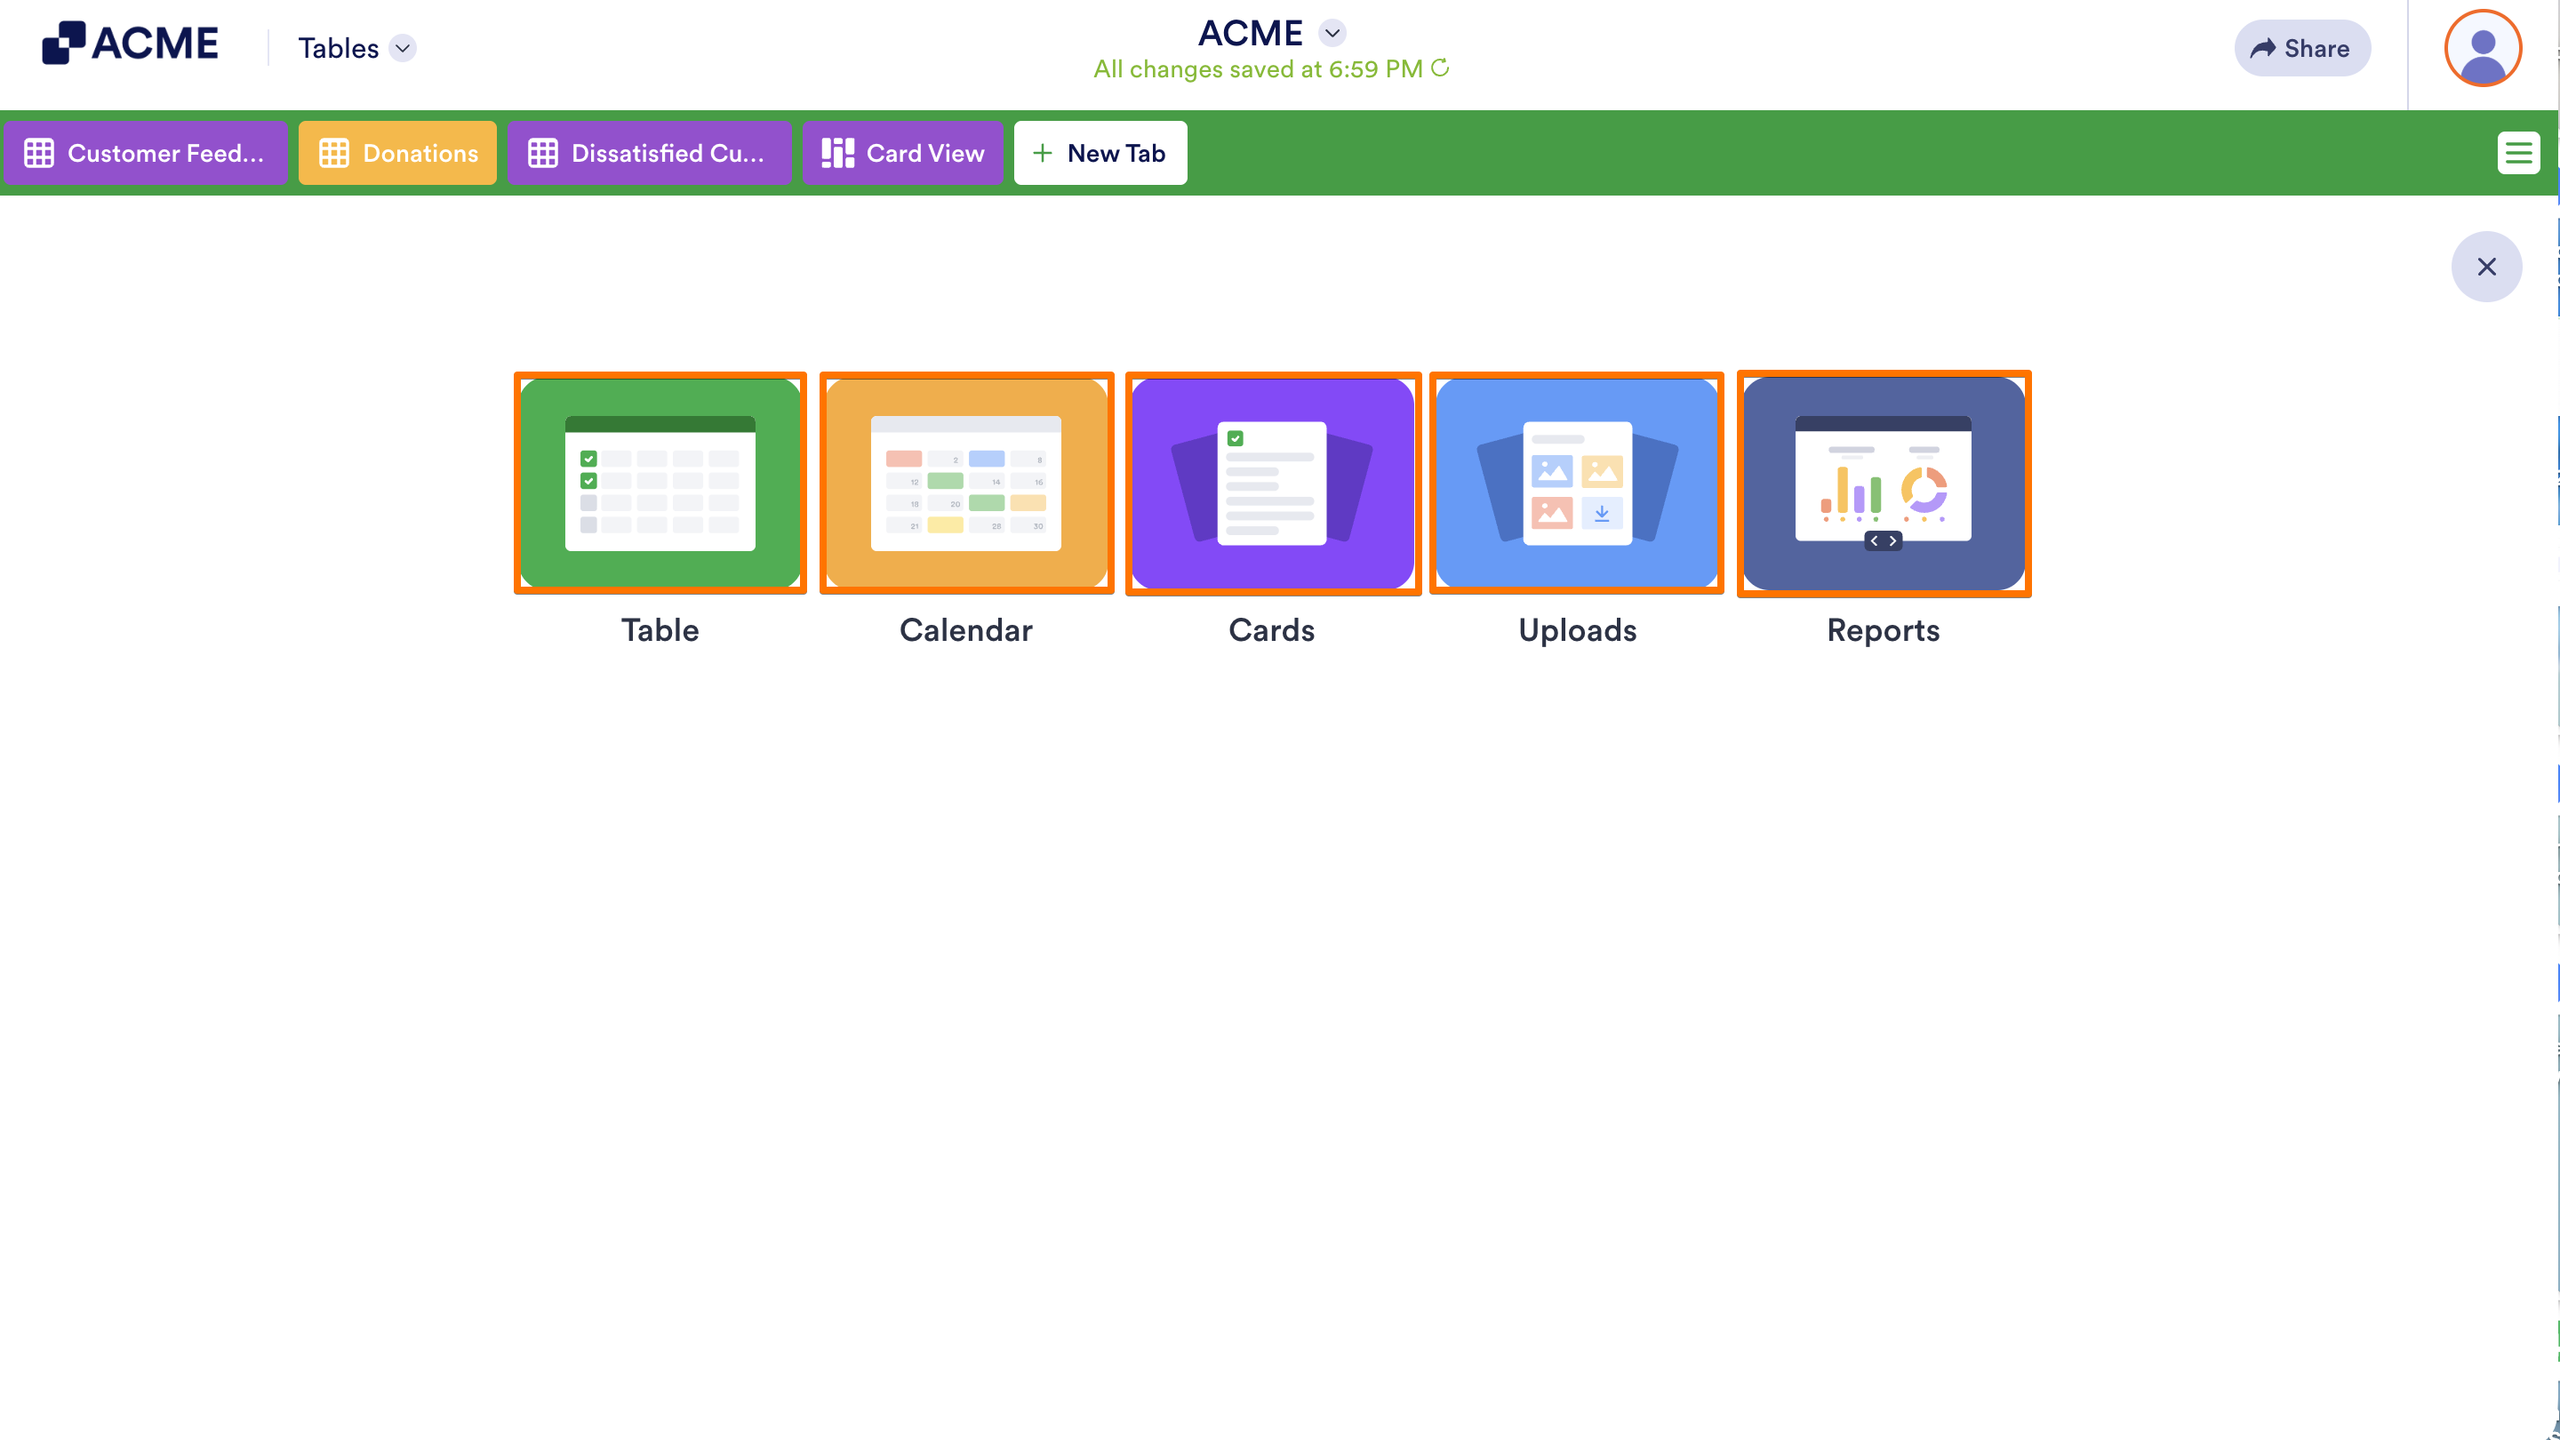
- Next, follow the instructions on the selection you made.
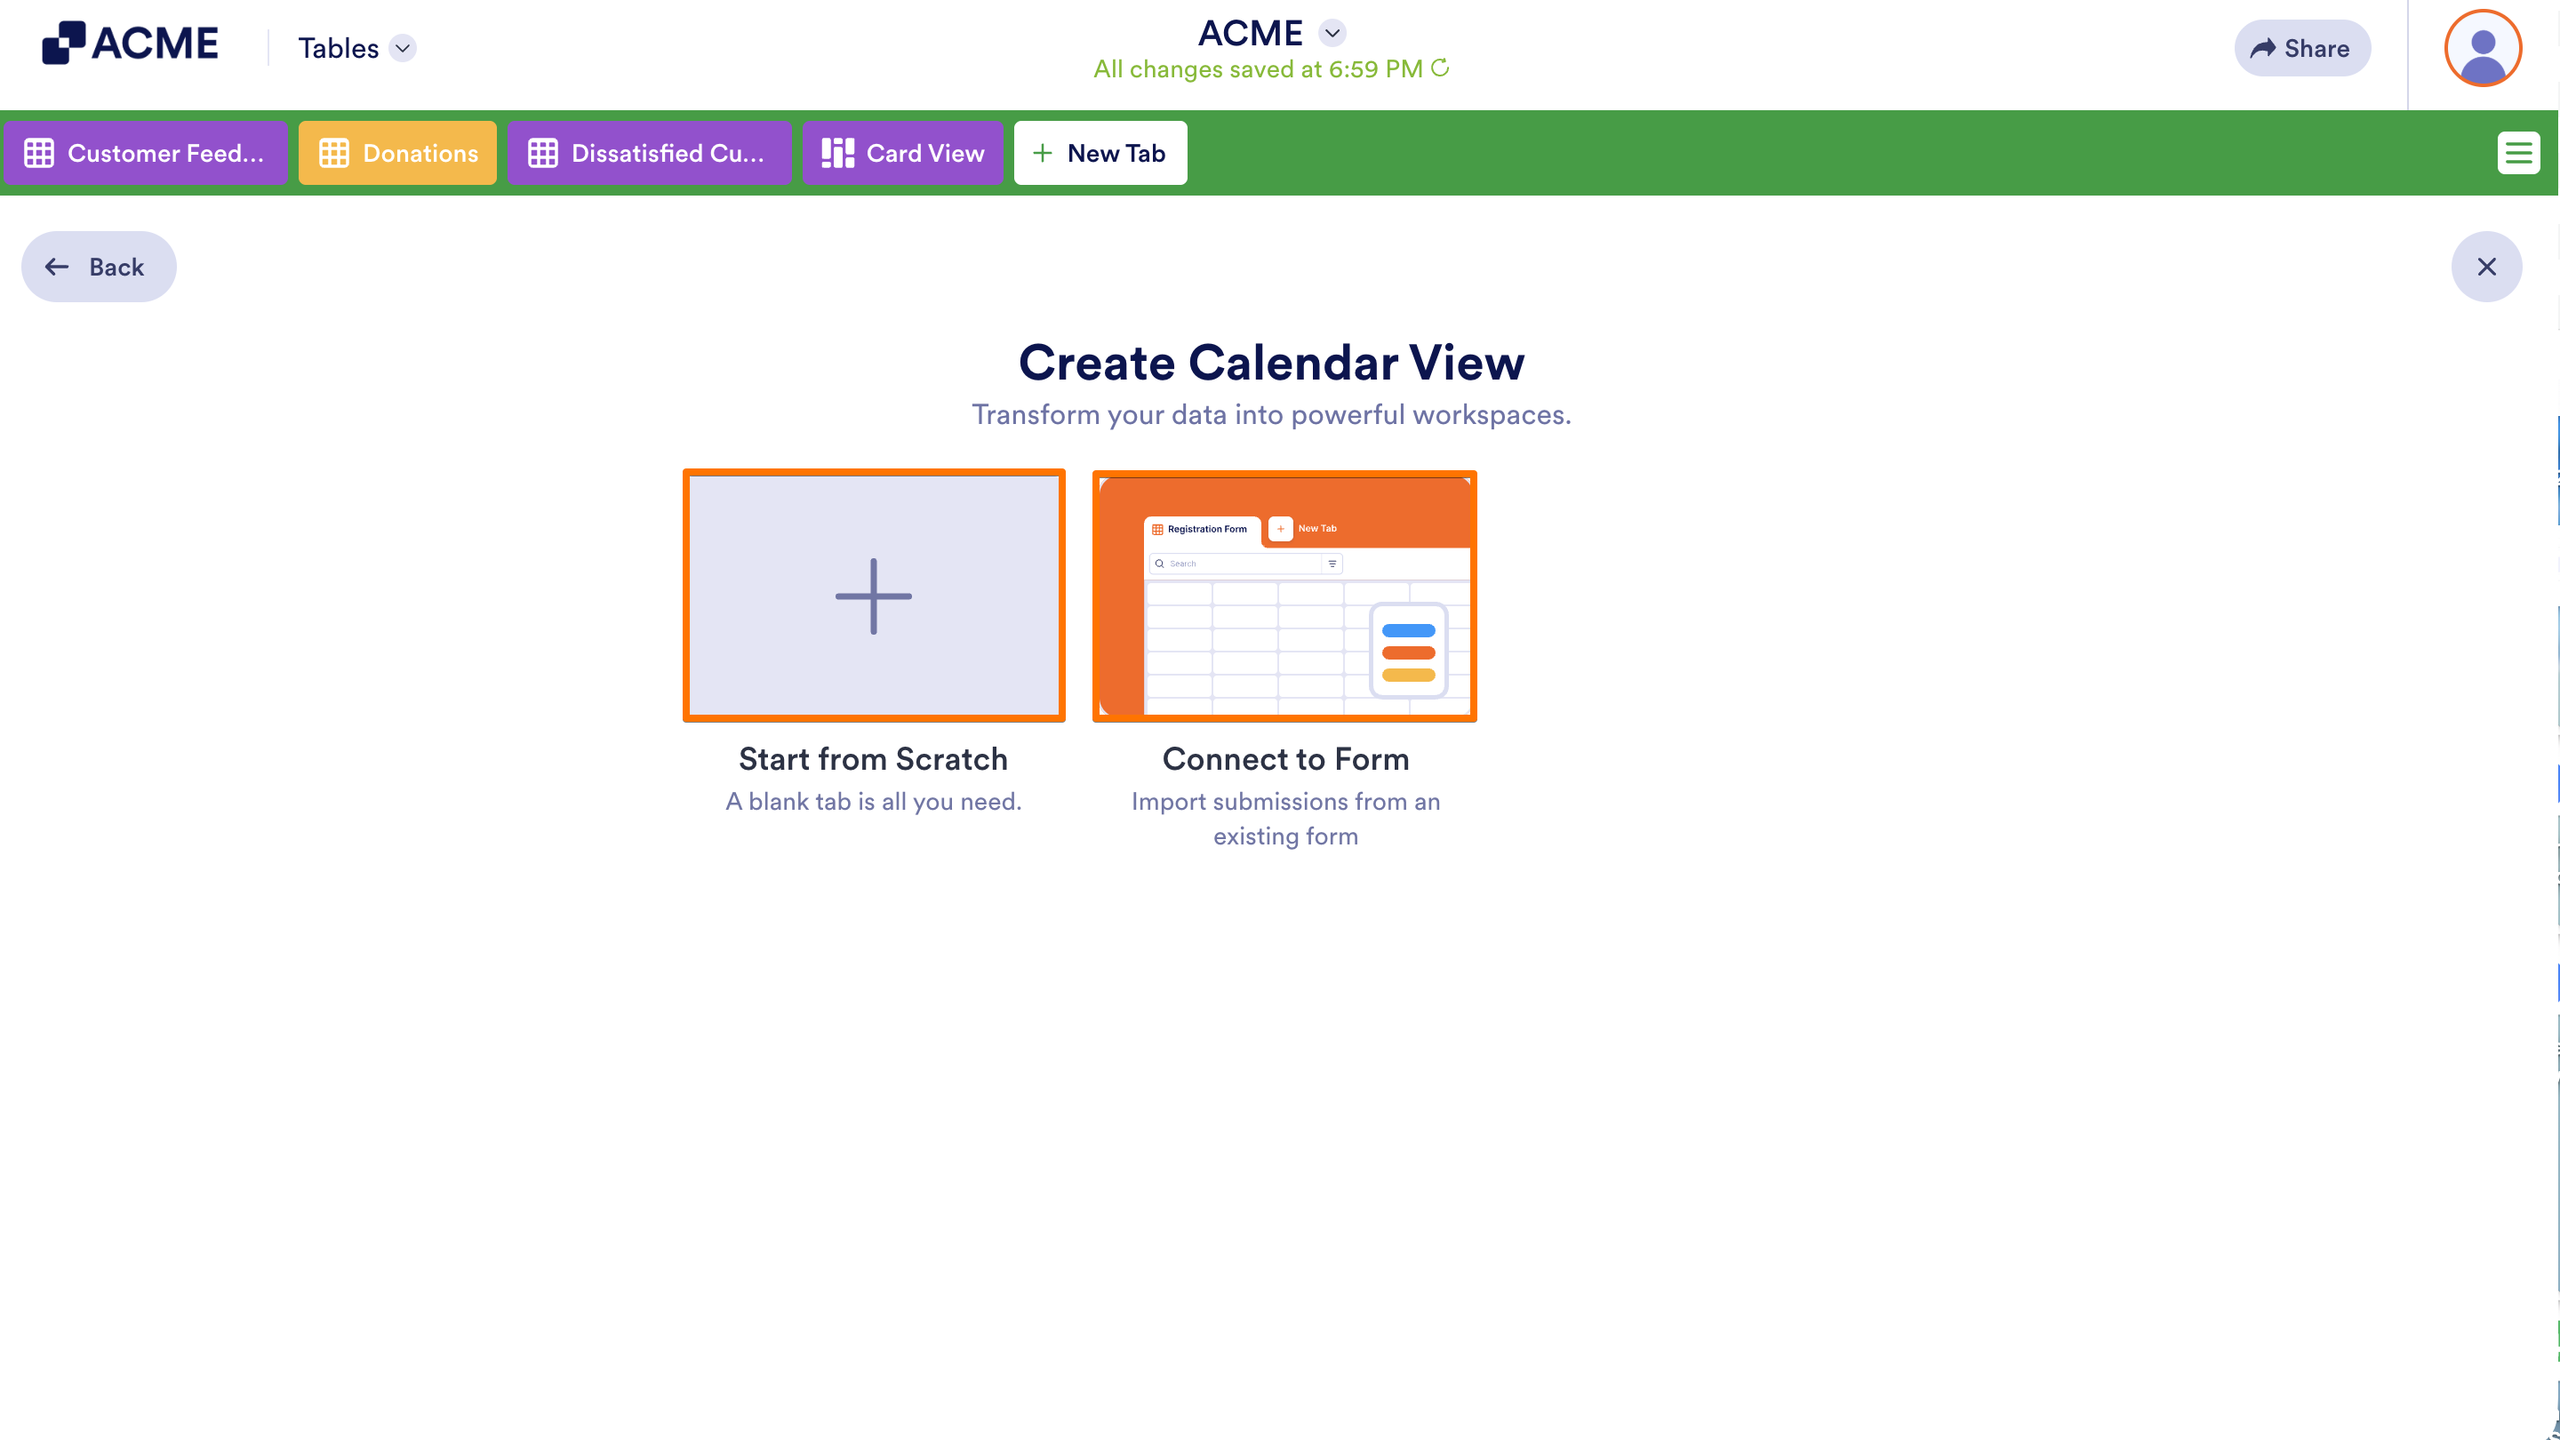
Here’s a breakdown of the blank views you can set for a new tab in Tables:
- Table — Create a blank table to manually add and manage entries in a traditional table layout. Customize columns and data types to organize information for tasks like tracking inventories, creating lists, or managing records.
- Calendar — Start with an empty calendar to add events manually and view them visually by date. Use it for scheduling tasks, tracking deadlines, or planning appointments, with options to customize event details and fields.
- Boards — Set up a blank board to organize and manage entries in lists, ideal for tracking progress or categorizing tasks. Add a single-selection field to define your lists and manually input entries for workflow management or project tracking.
- Cards — Begin with an empty cards layout where you can manually add cards to display data visually. Perfect for summarizing information, such as individual tasks or contact details, with customizable fields and display options.
- Uploads — Create a blank folder-style layout to manually add entries and upload attachments. Ideal for organizing files, such as images or documents, with the ability to set folder titles for better categorization.
- Reports — Connect your new tab to your selected form, allowing you to create a report based on its submission data. Simply select a form and choose a report type—blank, extended, or compact. This view is ideal for designing custom visual reports, such as charts or graphs, to analyze trends and summarize submissions.
You can also customize the report to be sent to you automatically. To learn more about it, check out How to Create Automated Reports in Tables.

Send Comment: