The Reports view in Tables is a visual display of your form data. It’s an automated report generation system that can generate bar graphs, pie charts, line graphs, form submission grids, and HTML text and images.
To set up automated report generation:
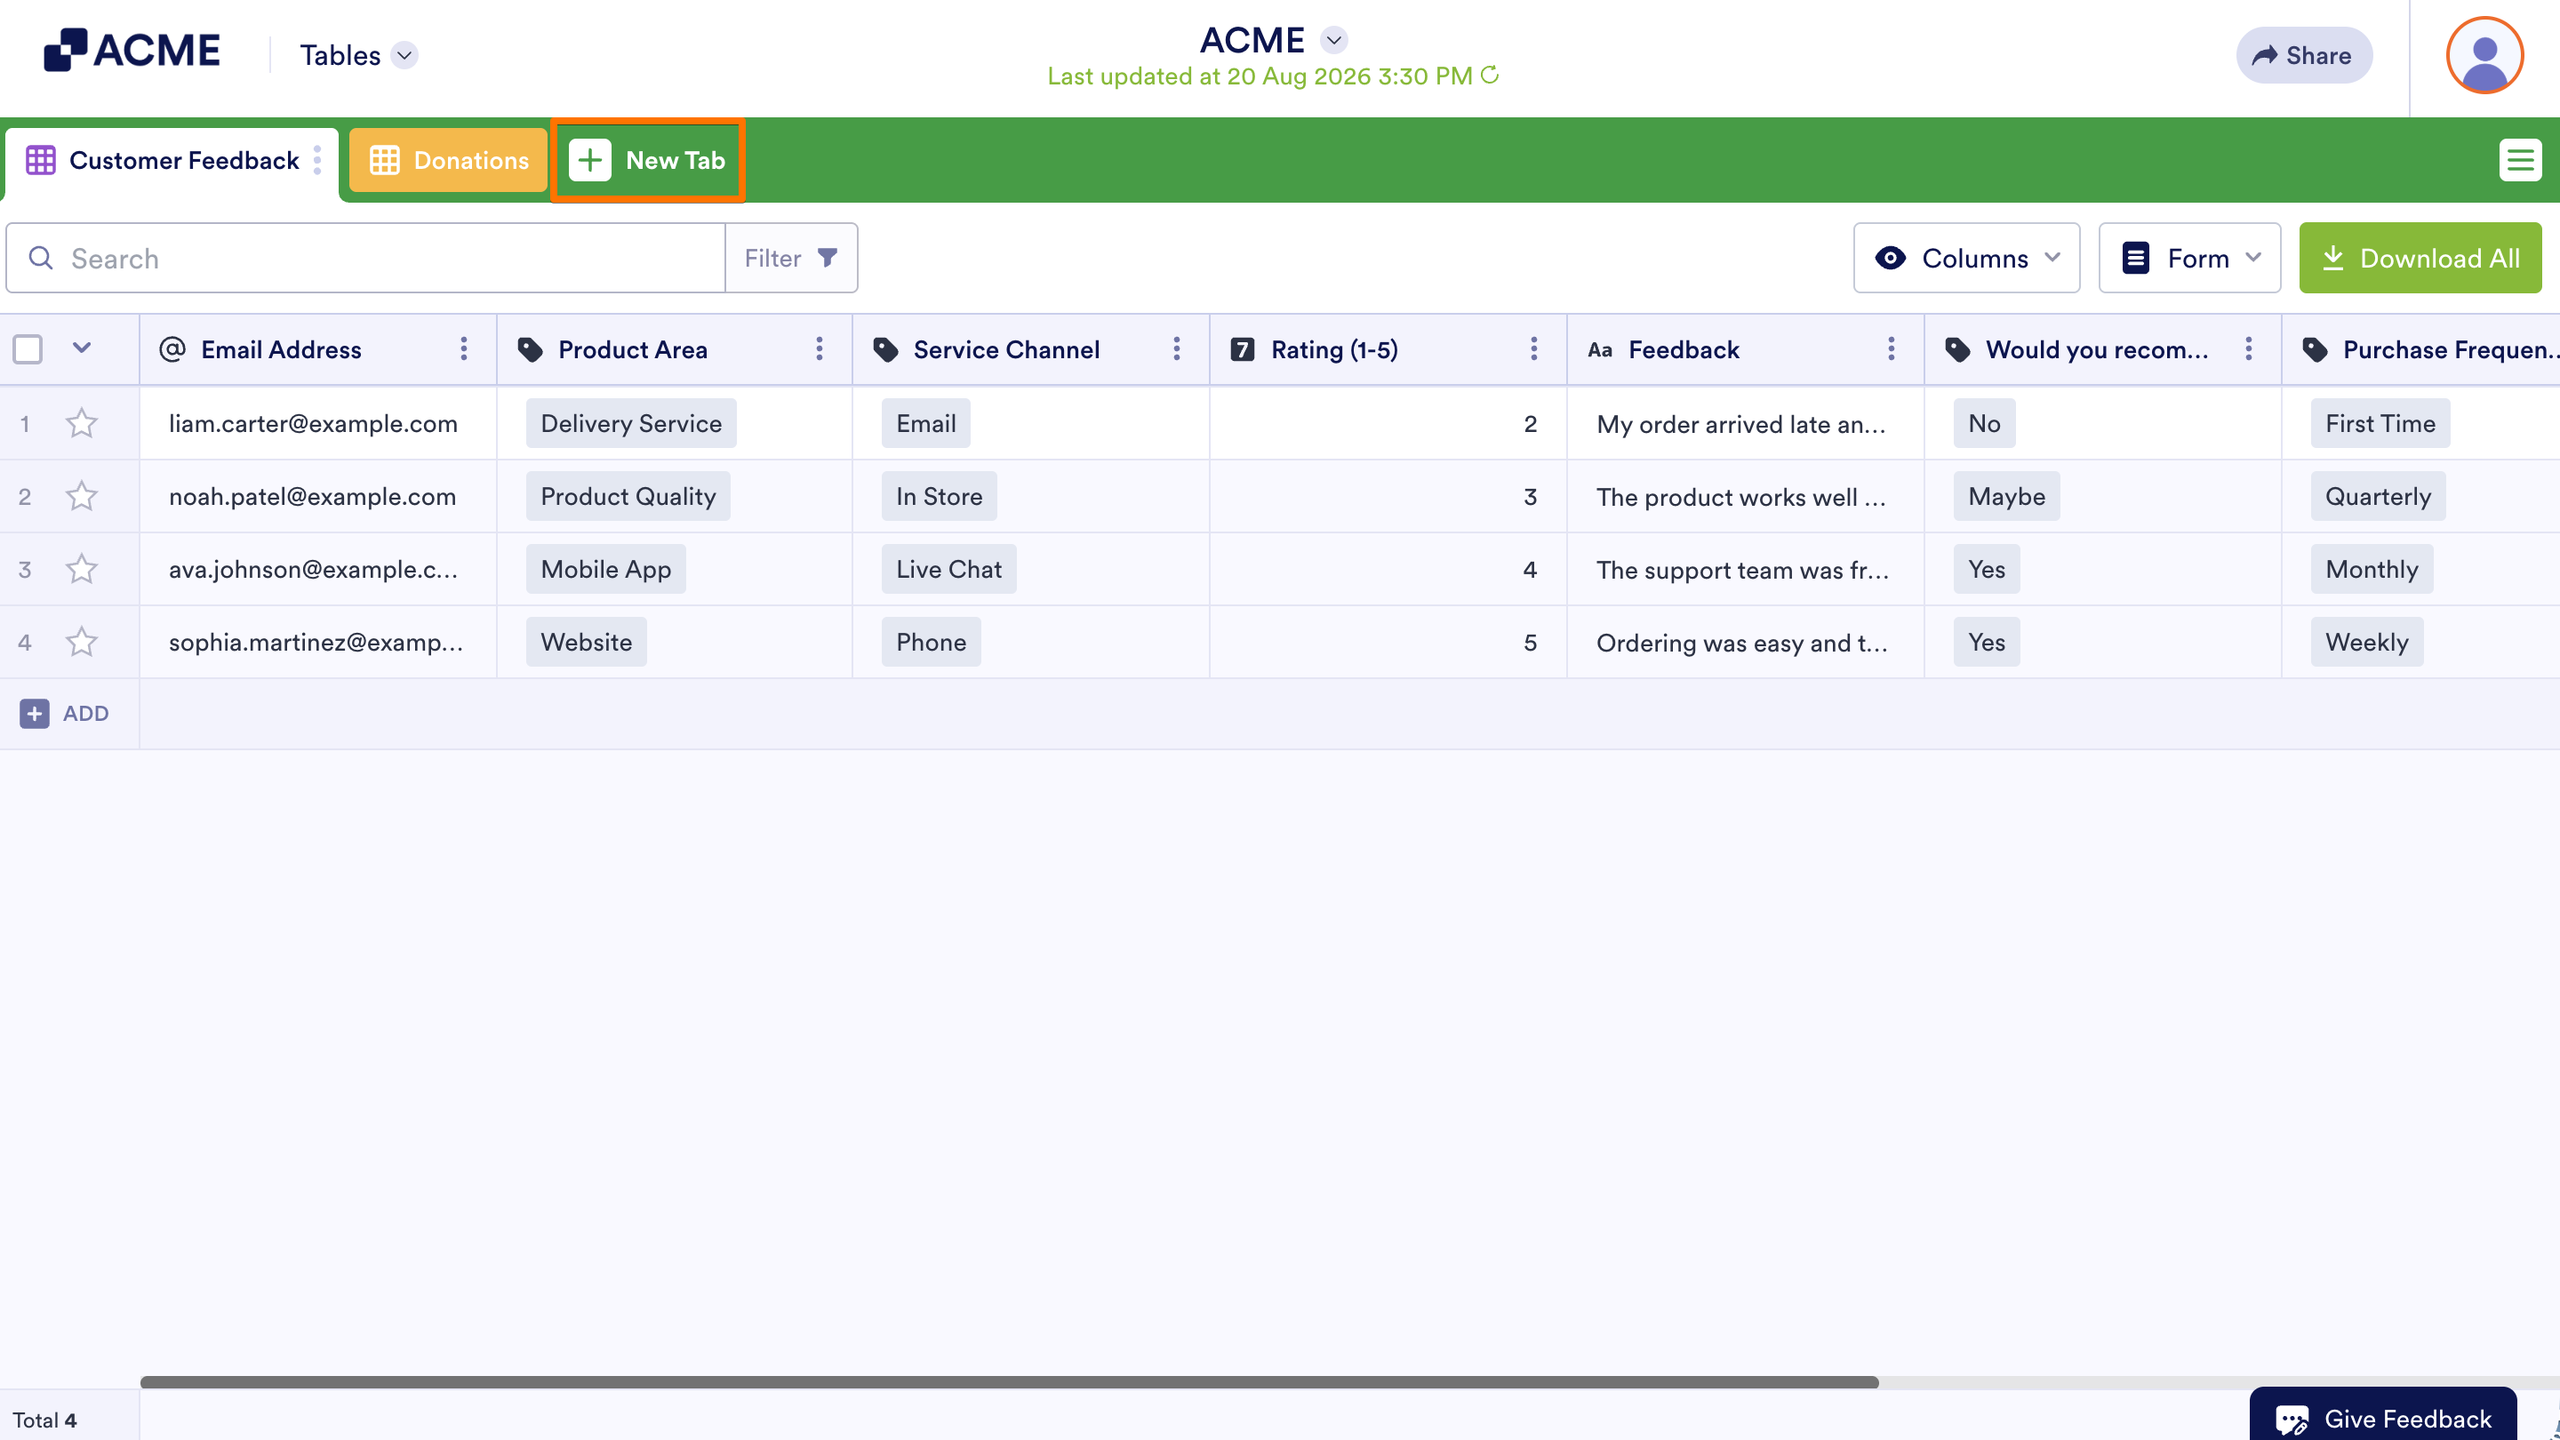
- In Tables, select New Tab at the top.
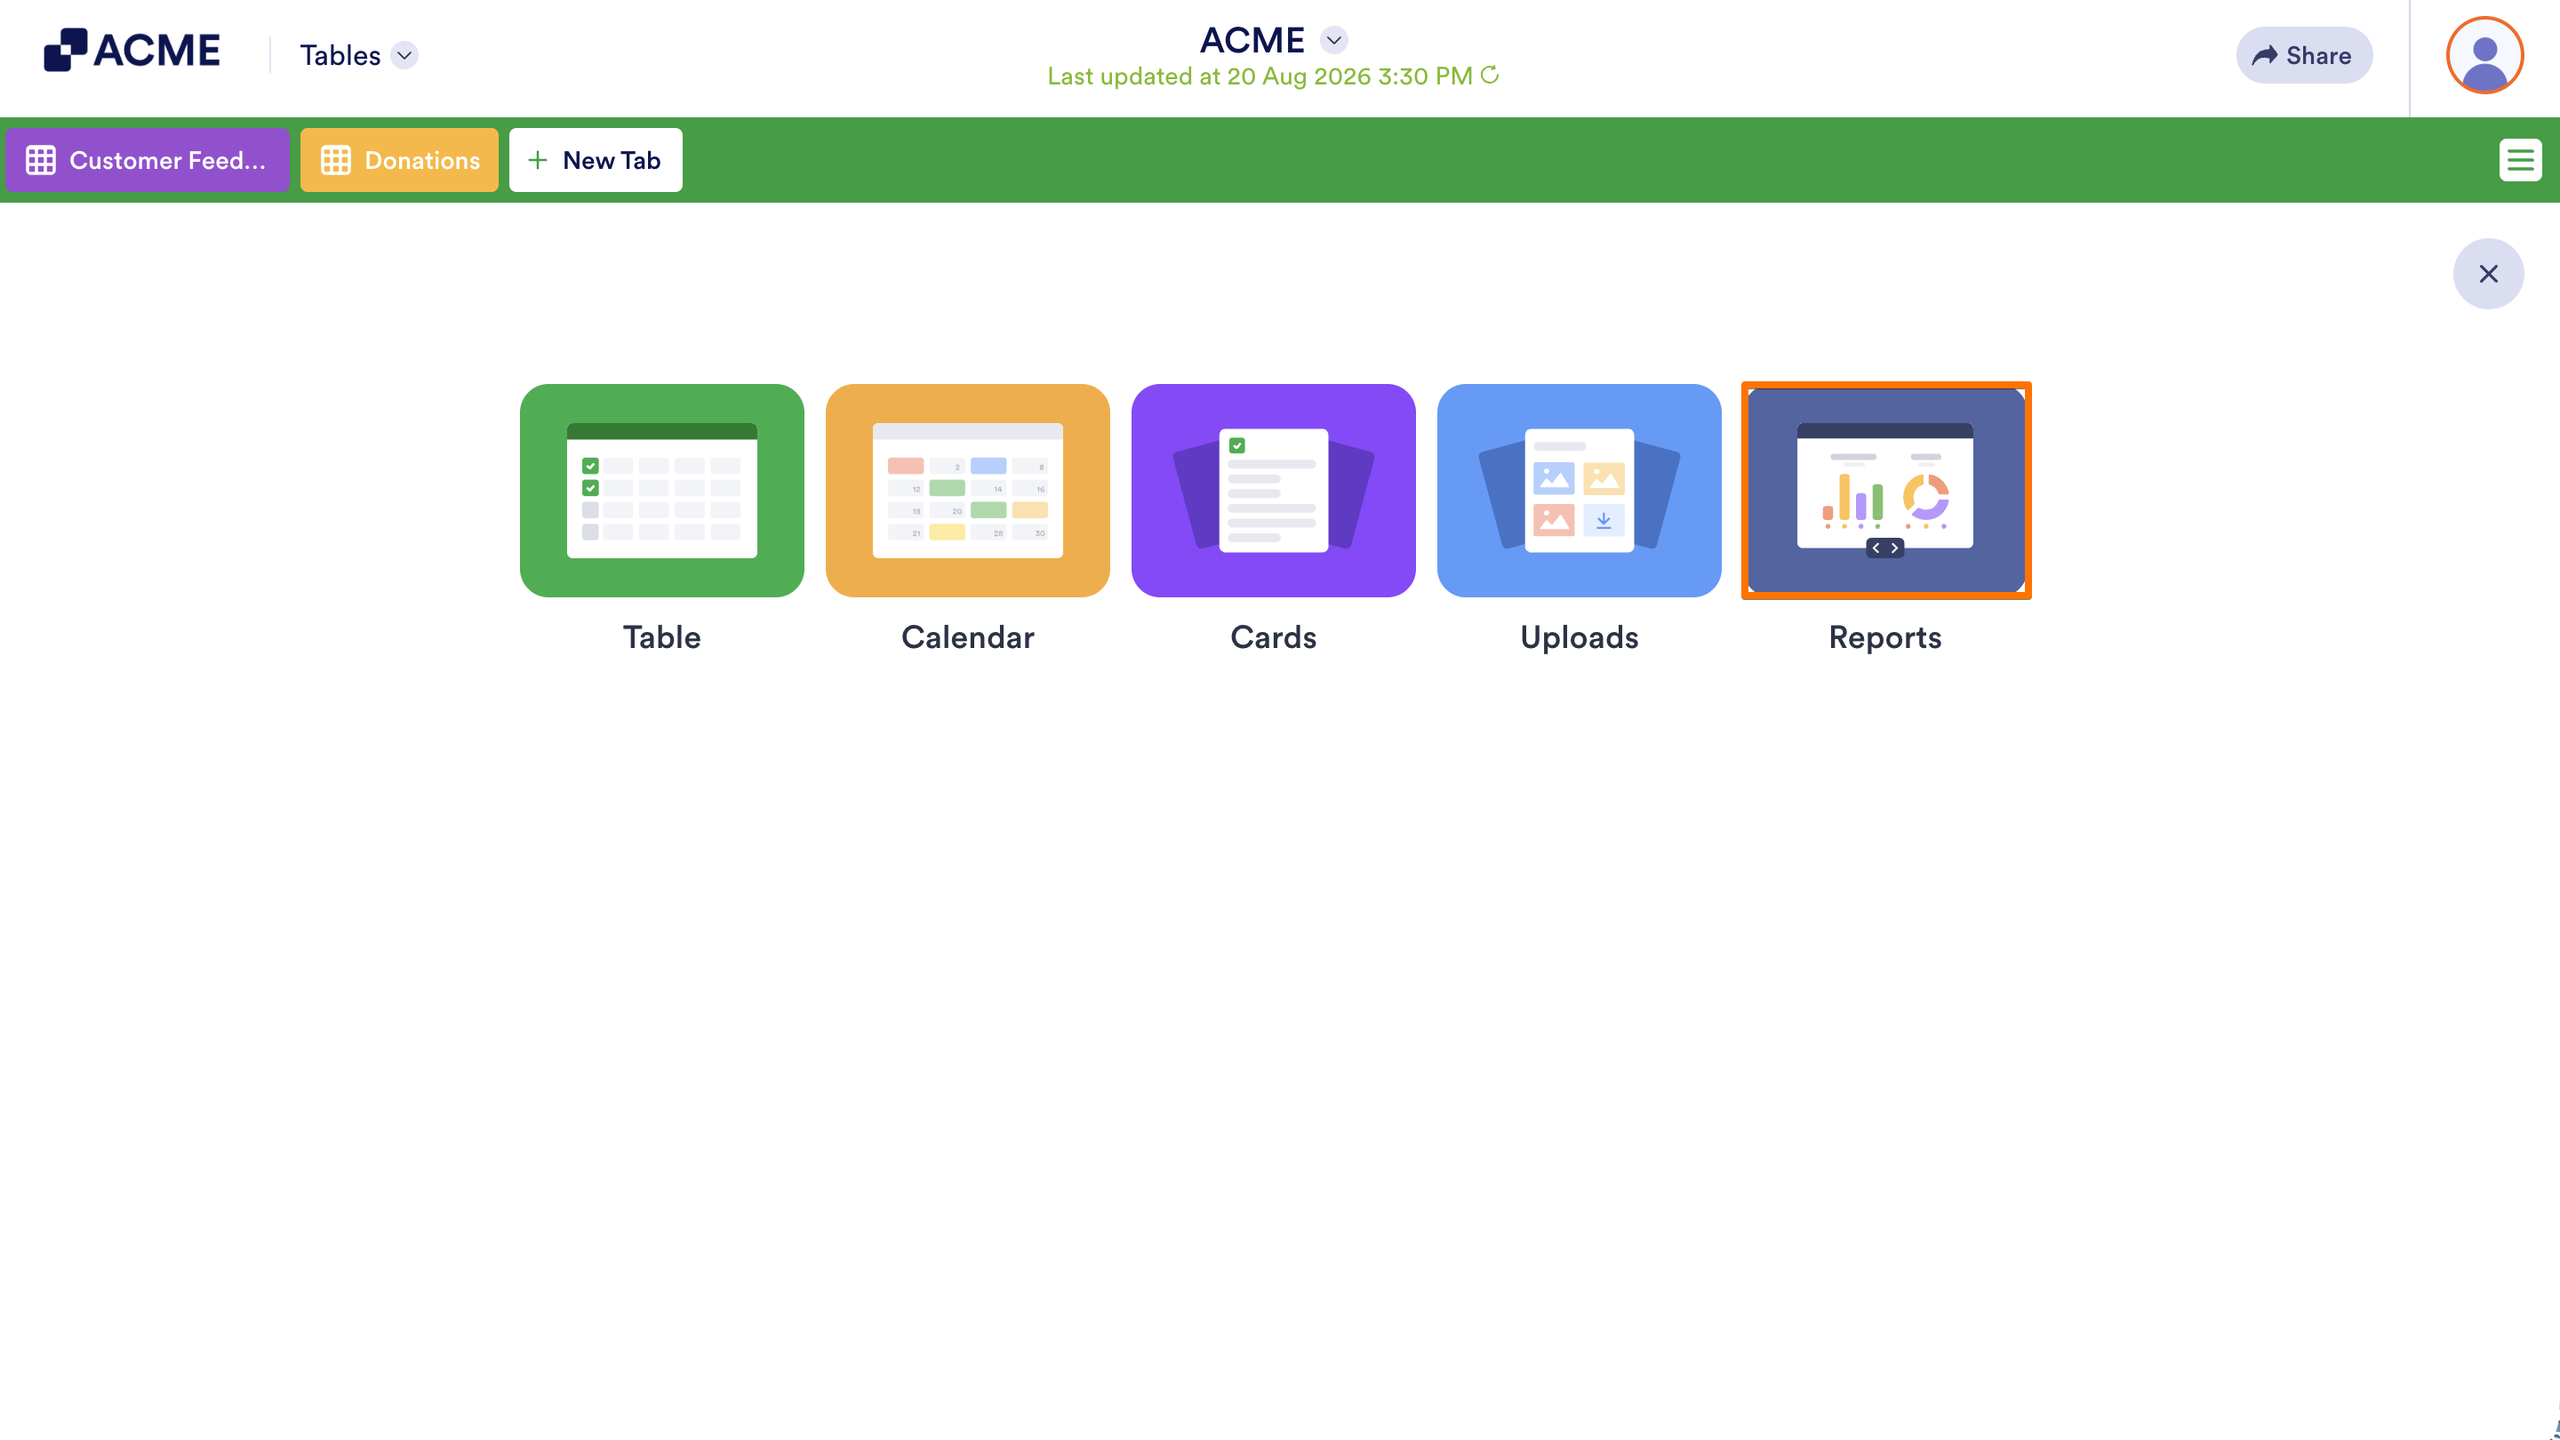
- In the dialog, select Reports.
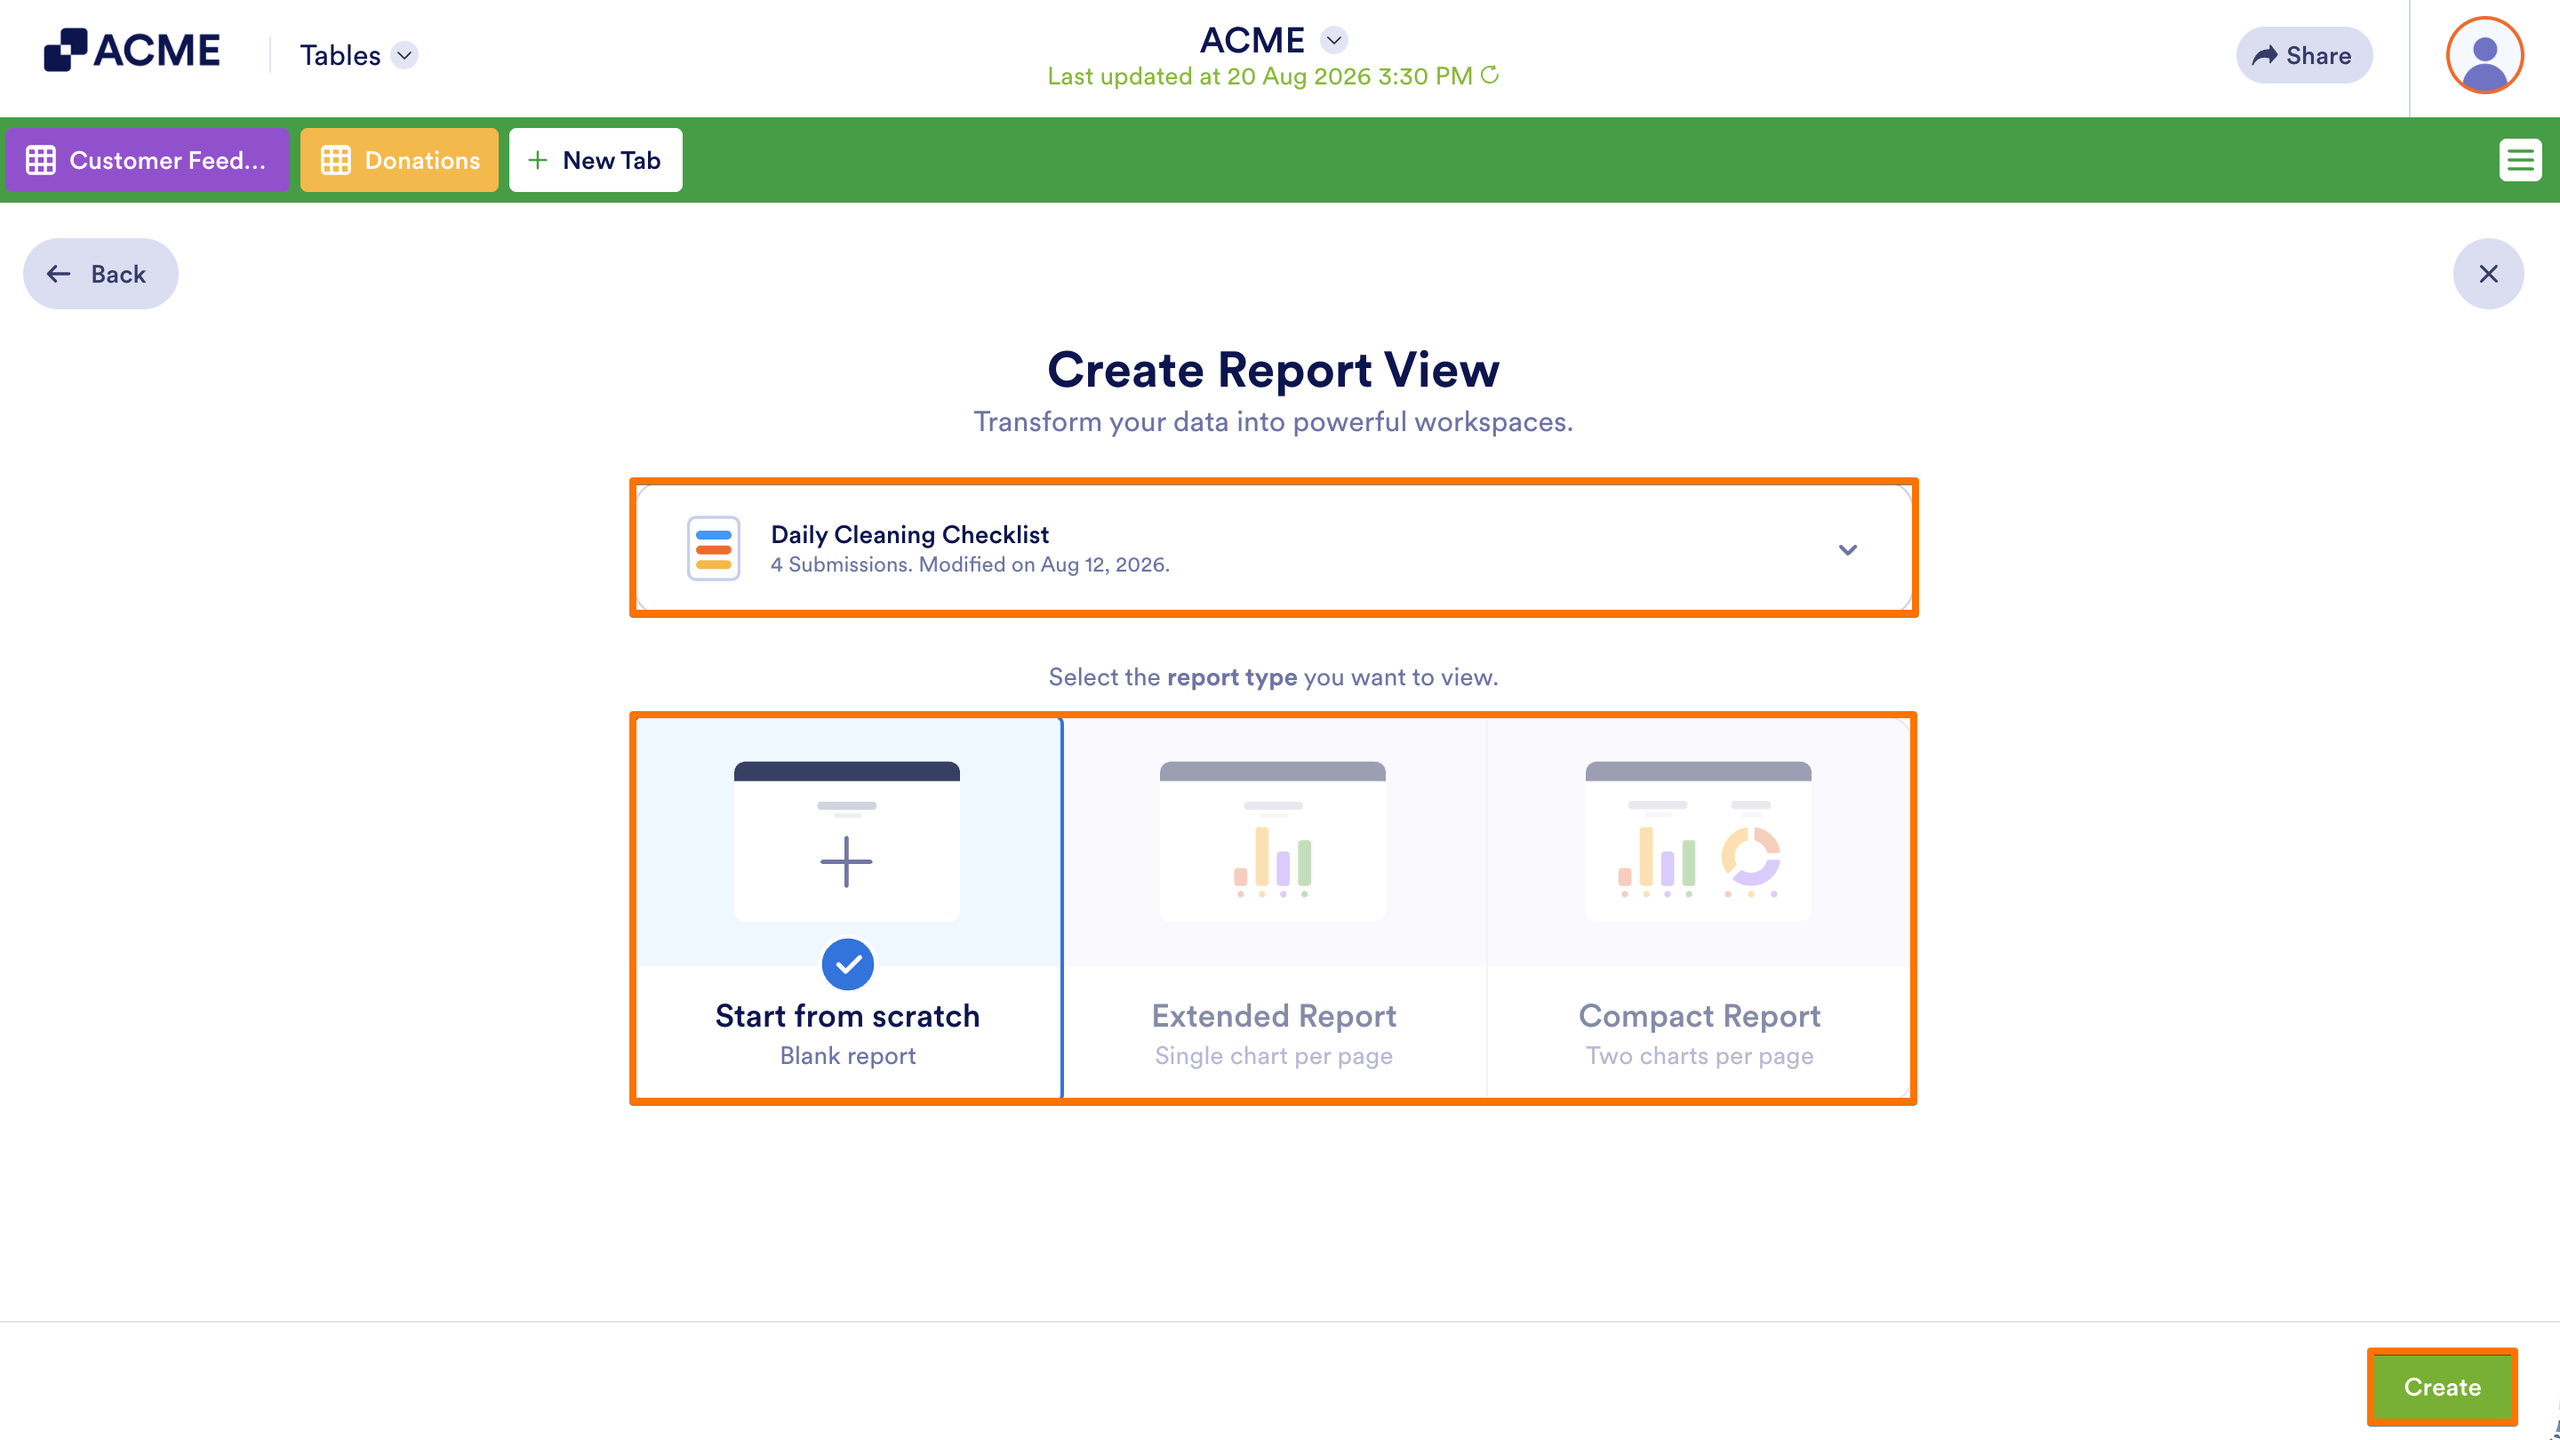
- Choose a form to use.
- Select Extended or Compact report type to quickly create a report. Or select Blank to customize a report from scratch.
- Then, click on Create at the bottom left.
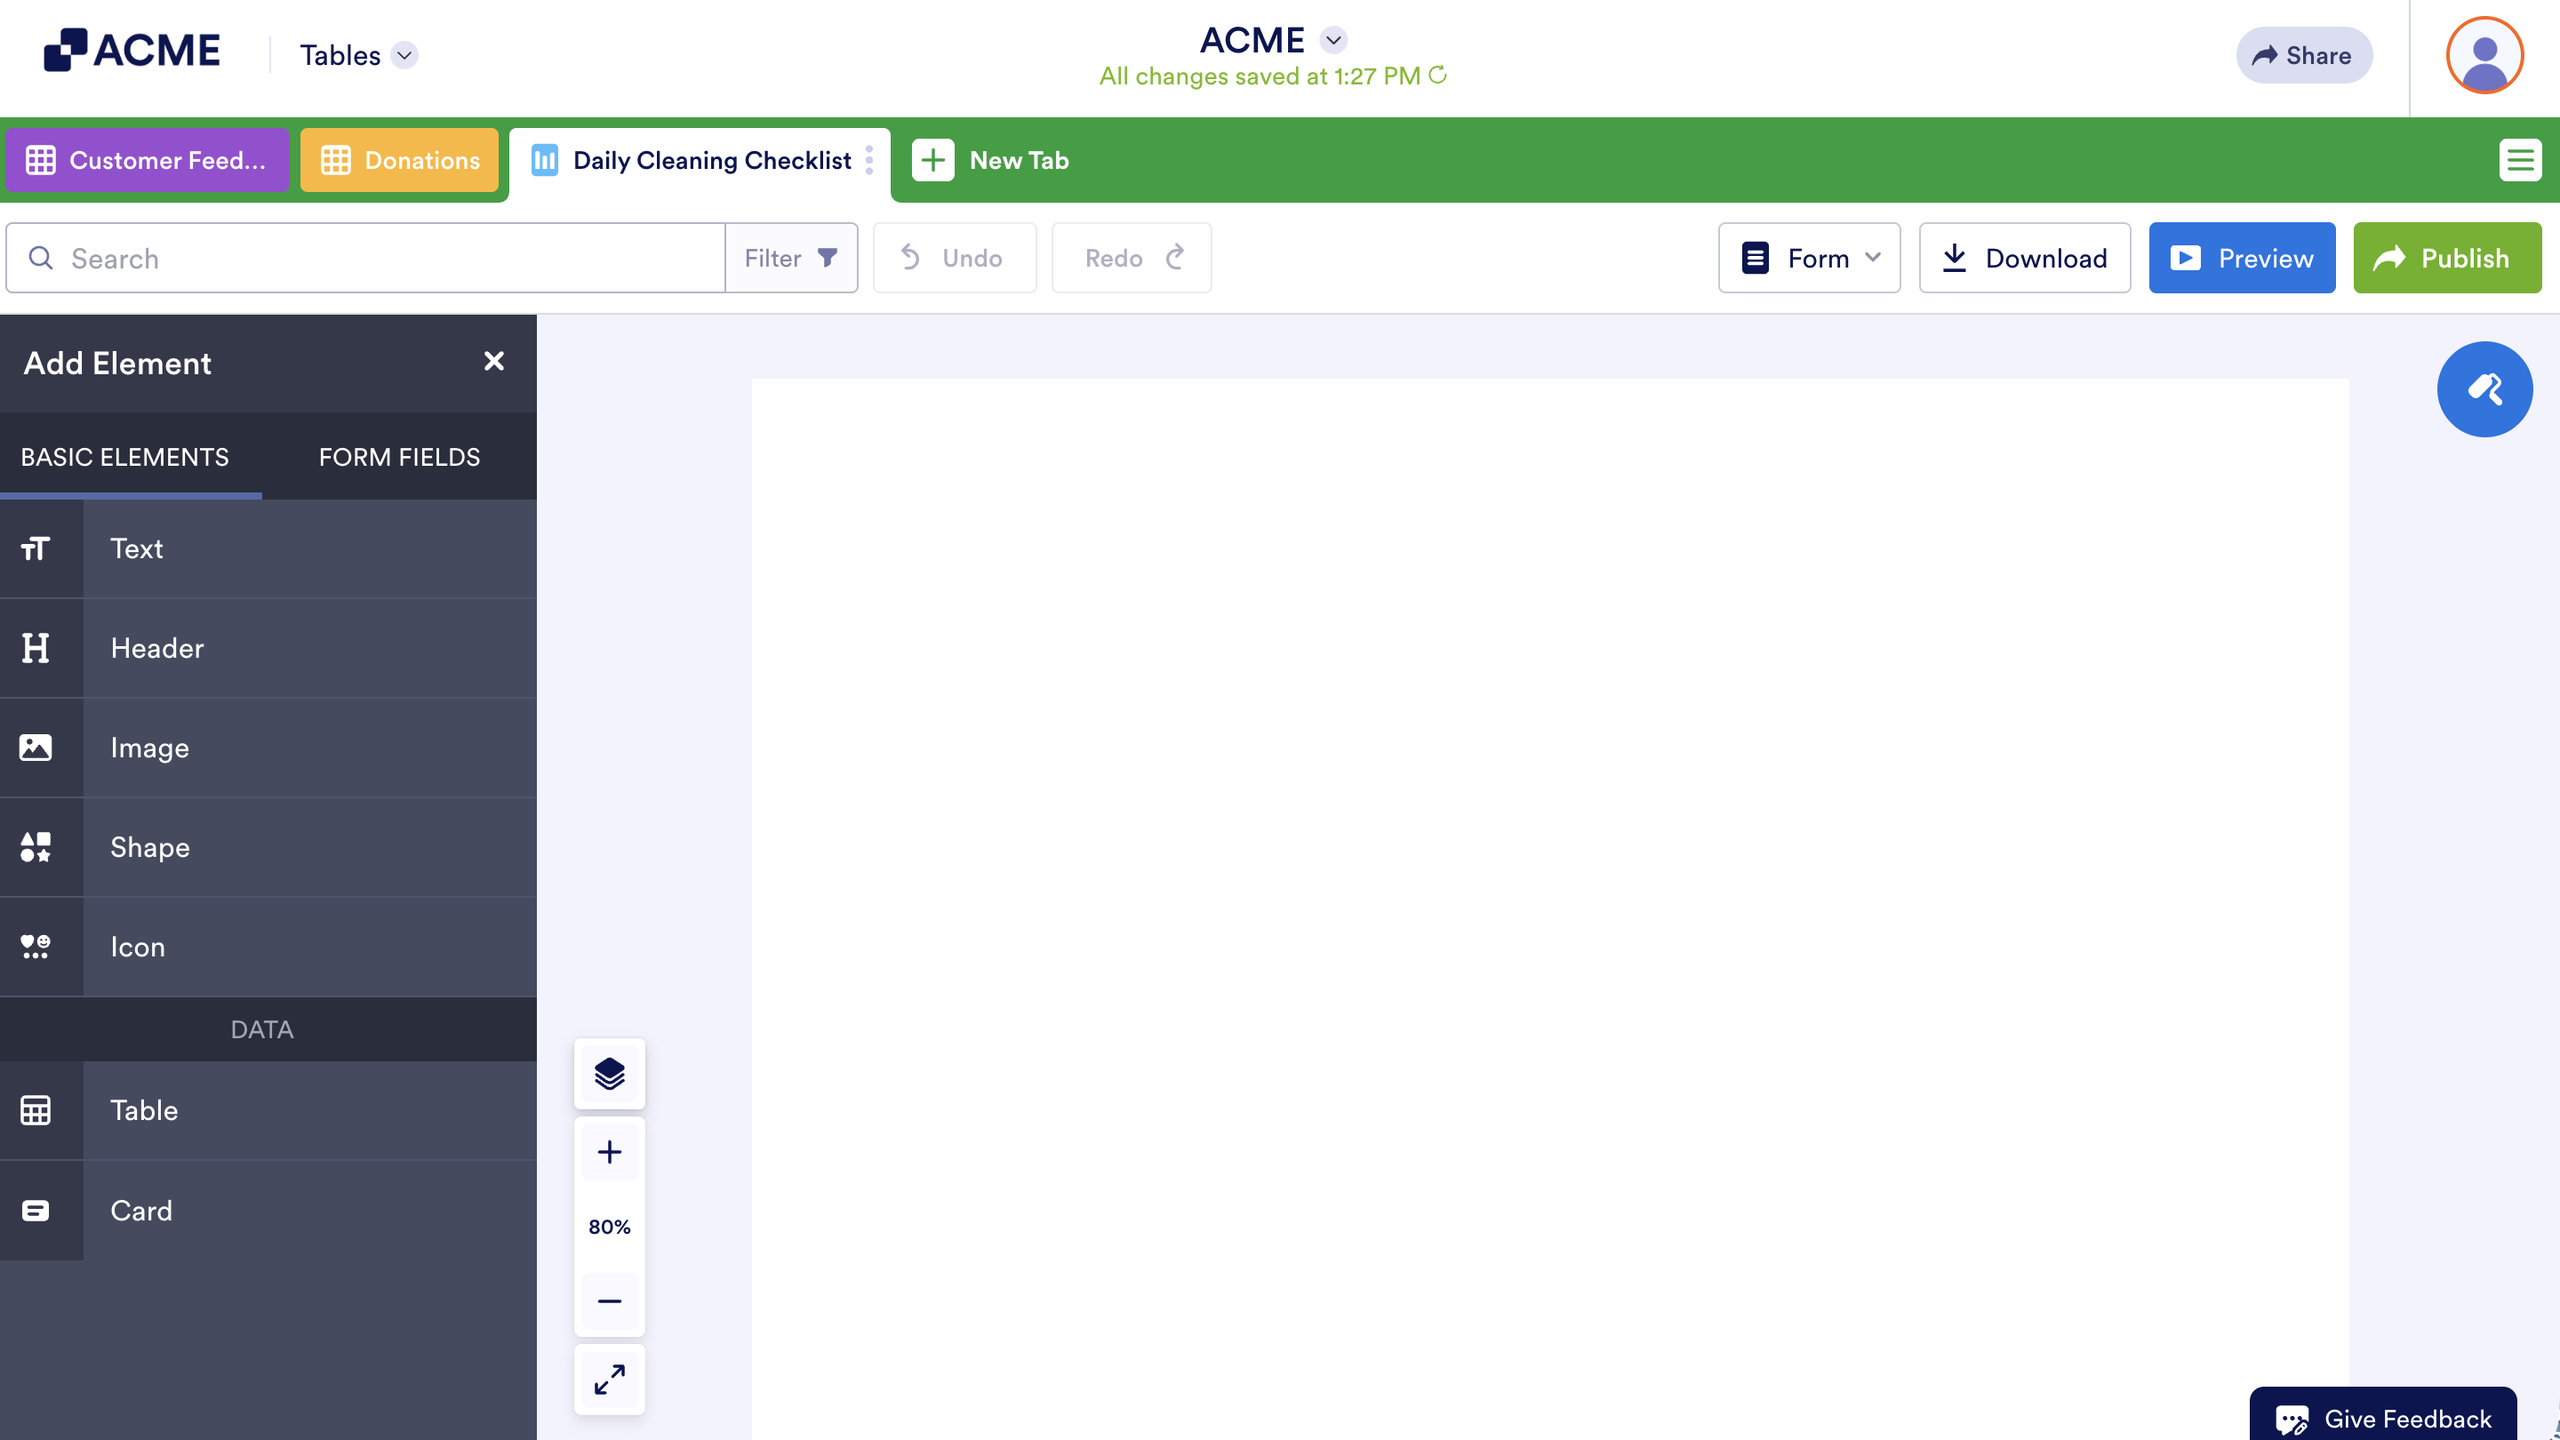
Your table’s automated report generation is now ready. You can edit it using the elements you want fro m the Add Element menu. The report automatically updates when you receive new submissions on your form.

Send Comment: