While you can create a visual report to see how many answers you have to certain form questions, the Summarize with a chart feature in Tables allows you to get these numbers in just a few clicks.
To quickly generate answer summary charts:
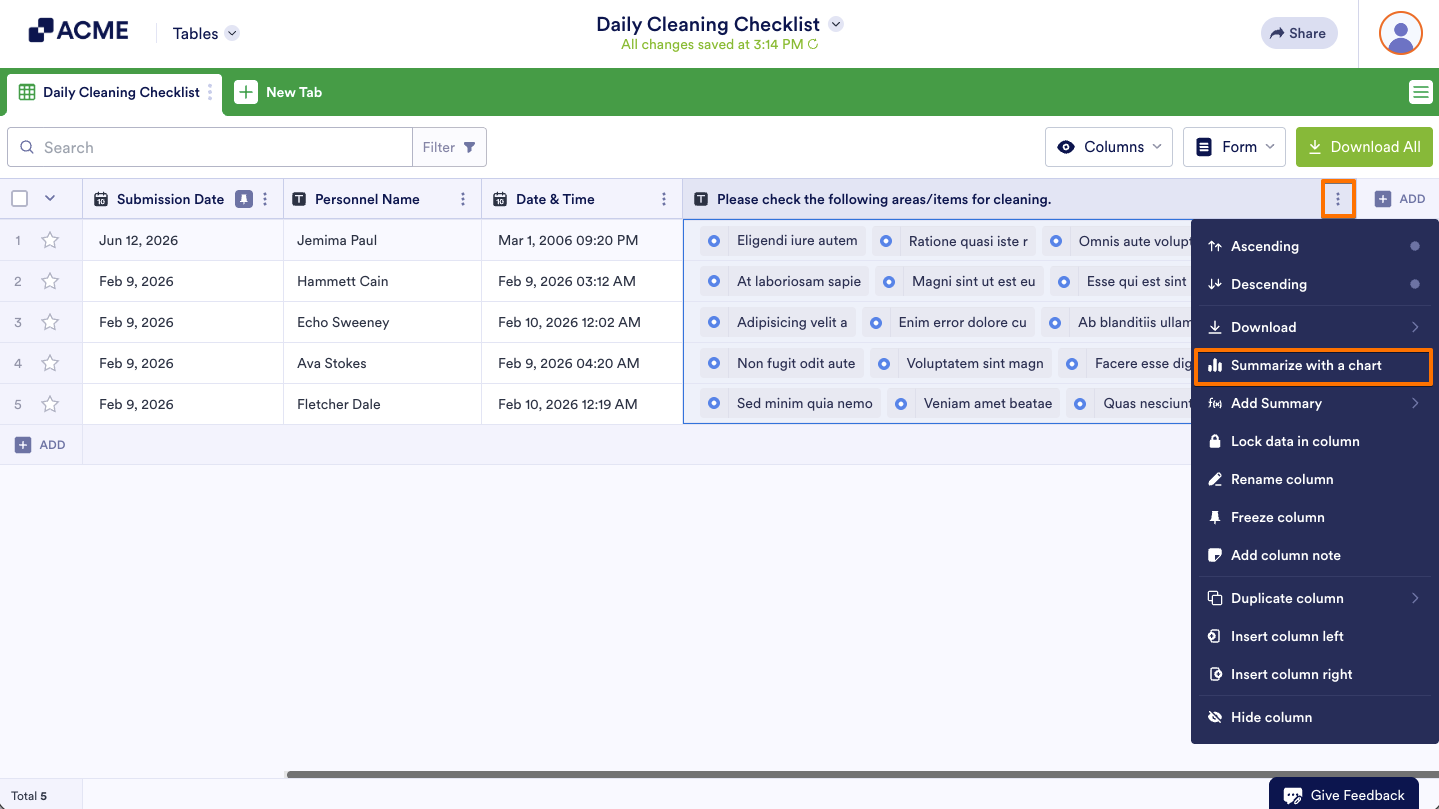
- In Tables, click the three-dot icon next to the column name to open the column menu.
- Select Summarize with a chart.
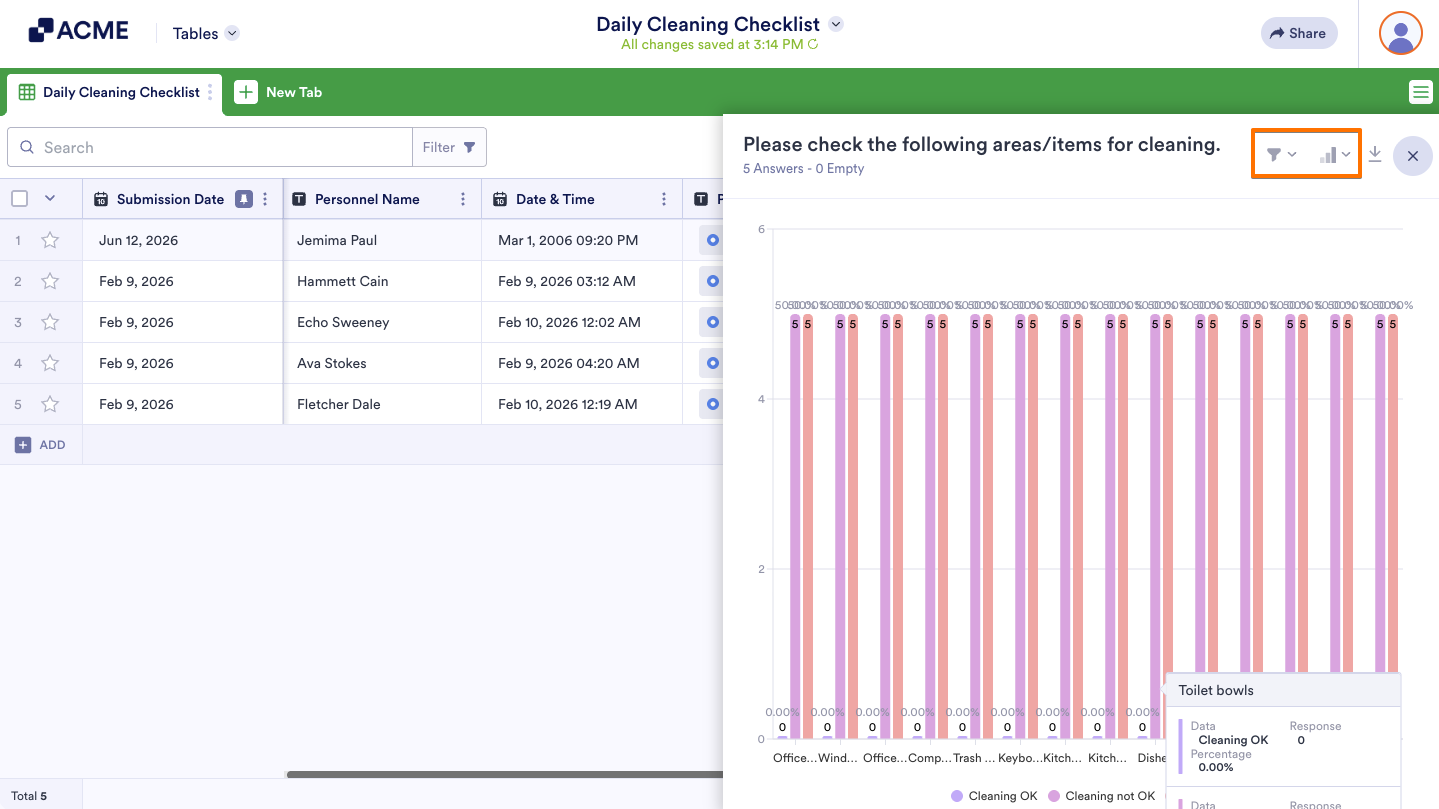
- The summary panel will appear on the right. To filter the field options displayed in the summary, click the Filter icon in the upper-right corner.
- To change the chart type, click the Chart icon next to the Filter icon.
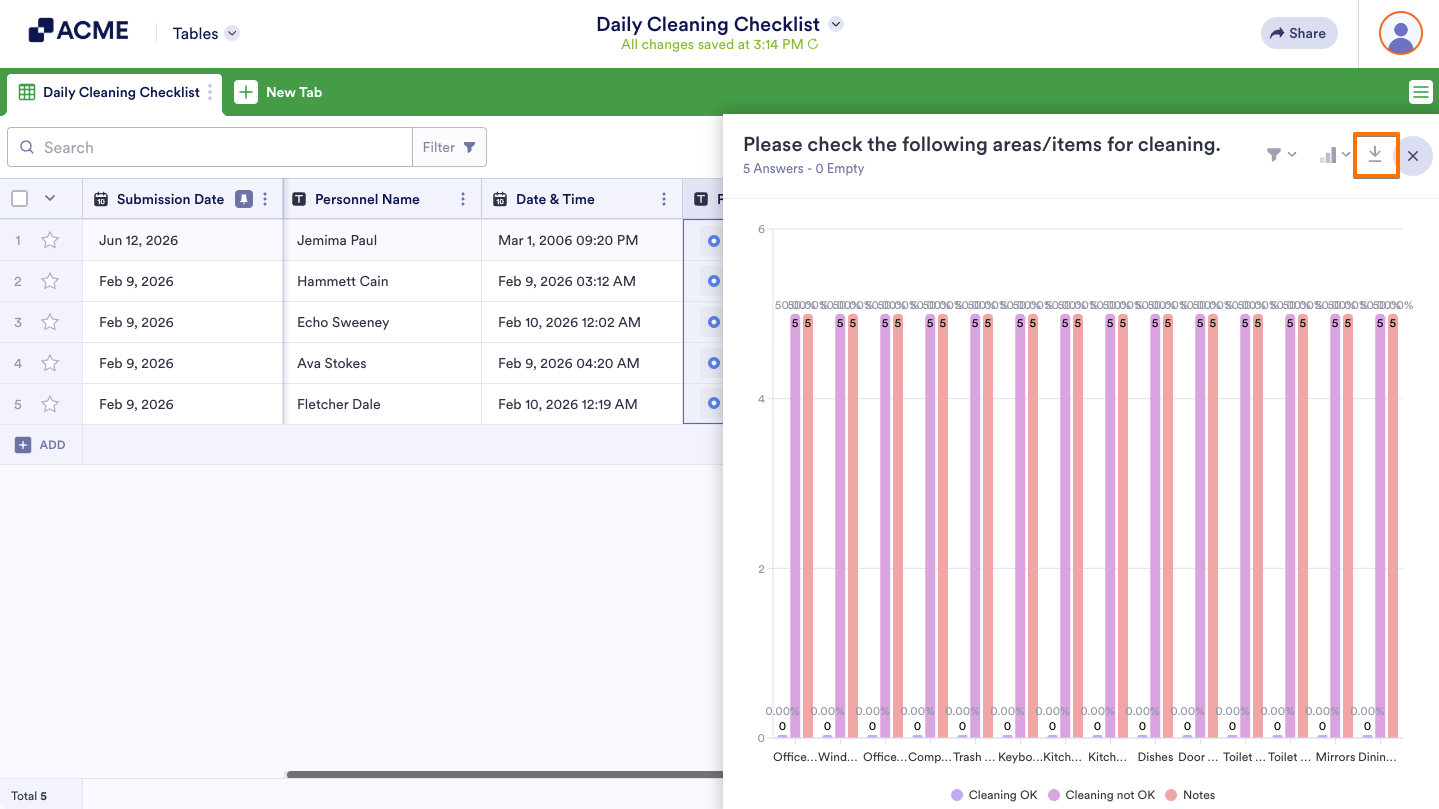
- Next to the chart icon is the download icon that you can use to download the chart.

Send Comment: