-
ExecTechAsked on September 16, 2020 at 11:48 AM
Is there a way to show a chart of just a single individual's entry? For example, 50 numeric fields calculated to 10 totals with a bar chart showing the 10 totals. Thanks.
-
David JotForm Support ManagerReplied on September 16, 2020 at 1:46 PM
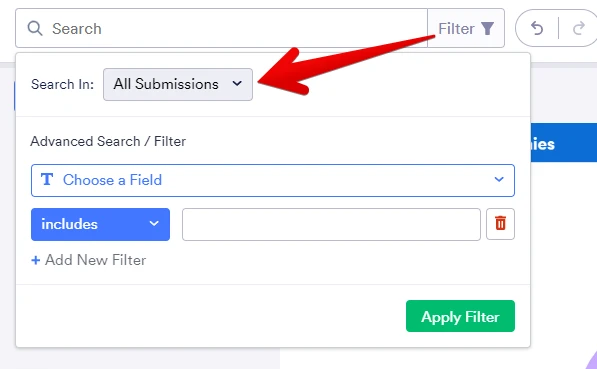
Good day, if you want to filter report data based on a single submission, you can do it with the Filter options: https://www.jotform.com/products/report-builder/announcing-jotform-report-builder/

Let us know if you need more help.
-
TipsForSuccessReplied on September 17, 2020 at 1:53 PM
Thanks!
Is there a way to show the chart (of the single submission) to that user immediately after he or she enters the answers or submits the form?
-
KrisLei Jotform SupportReplied on September 17, 2020 at 4:42 PM
To my understanding, you would like to add the report to the autoresponder email? I think it's not possible to show the actual report to on the autoresponder email, but you can include the link of the report on the autoresponder email:
1) Click on the Publish button:
2) Copy the generated link for the report and include it on the autoresponder email:
For reference: How-to-Share-the-Visual-Report
I hope this helps.
- Templates
- Integrations
- FEATURED INTEGRATIONS
- PayPal
- Slack
- Google Sheets
- Mailchimp
- Zoom
- Dropbox
- Google Calendar
- Hubspot
- Salesforce
- See more Integrations
- See 100+ integrations
- Products
- PRODUCTS
- Form Builder
- Jotform Enterprise
- Jotform Apps
- Store Builder
- Jotform Tables
- Jotform Inbox
- Jotform Mobile App
- Jotform Approvals
- Report Builder
- Smart PDF Forms
- PDF Editor
- Jotform Sign
- Jotform for Salesforce Discover Now
- Support
- GET HELP
- Contact Support
- Help Center
- FAQ
- Dedicated Support
Get a dedicated support team with Jotform Enterprise.
Contact Sales - Professional ServicesExplore