


-
tomkranzAsked on February 13, 2018 at 11:19 AM
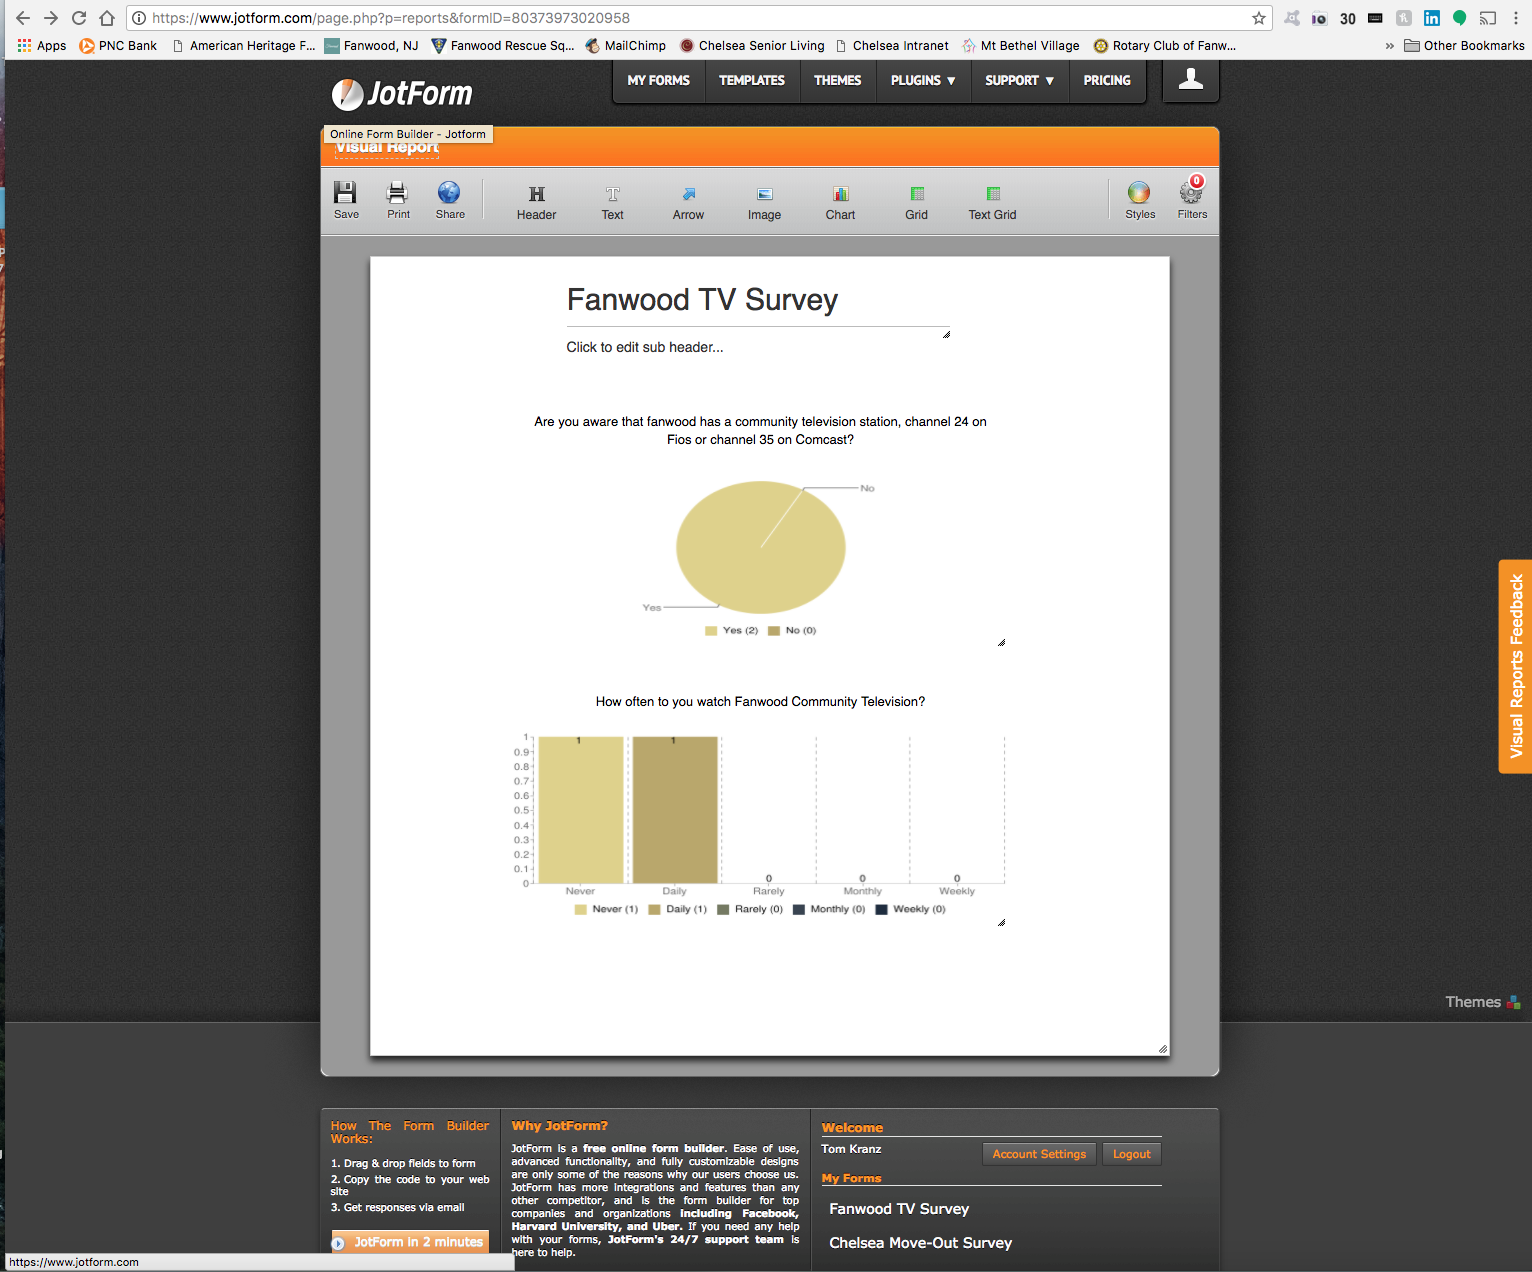
Once I see the two "example" charts (see screenshot), I can see how to change the data of those two, but I can't see how to add additional charts beyond the first two. I'm sure it's simple.
Tom
-
David JotForm Support ManagerReplied on February 13, 2018 at 12:11 PM
Pull down the page from the bottom right corner, then click on the "Chart" button, see this example:

- Templates
- Integrations
- INTEGRATIONS
- See 100+ integrations
- FEATURED INTEGRATIONS
 PayPal
- Slack
- Google Sheets
- Mailchimp
- Zoom
- Dropbox
- Google Calendar
- Hubspot
- Salesforce
- See more Integrations
- Products
- PRODUCTS
- Form Builder
- Jotform Enterprise
- Jotform Apps
- Store Builder
- Jotform Tables
- Jotform Inbox
- Jotform Mobile App
- Jotform Approvals
- Report Builder
- Smart PDF Forms
- PDF Editor
- Jotform Sign
- Jotform for Salesforce Discover Now
- Support


