


-
SylviaHelmAsked on July 5, 2019 at 8:25 AM
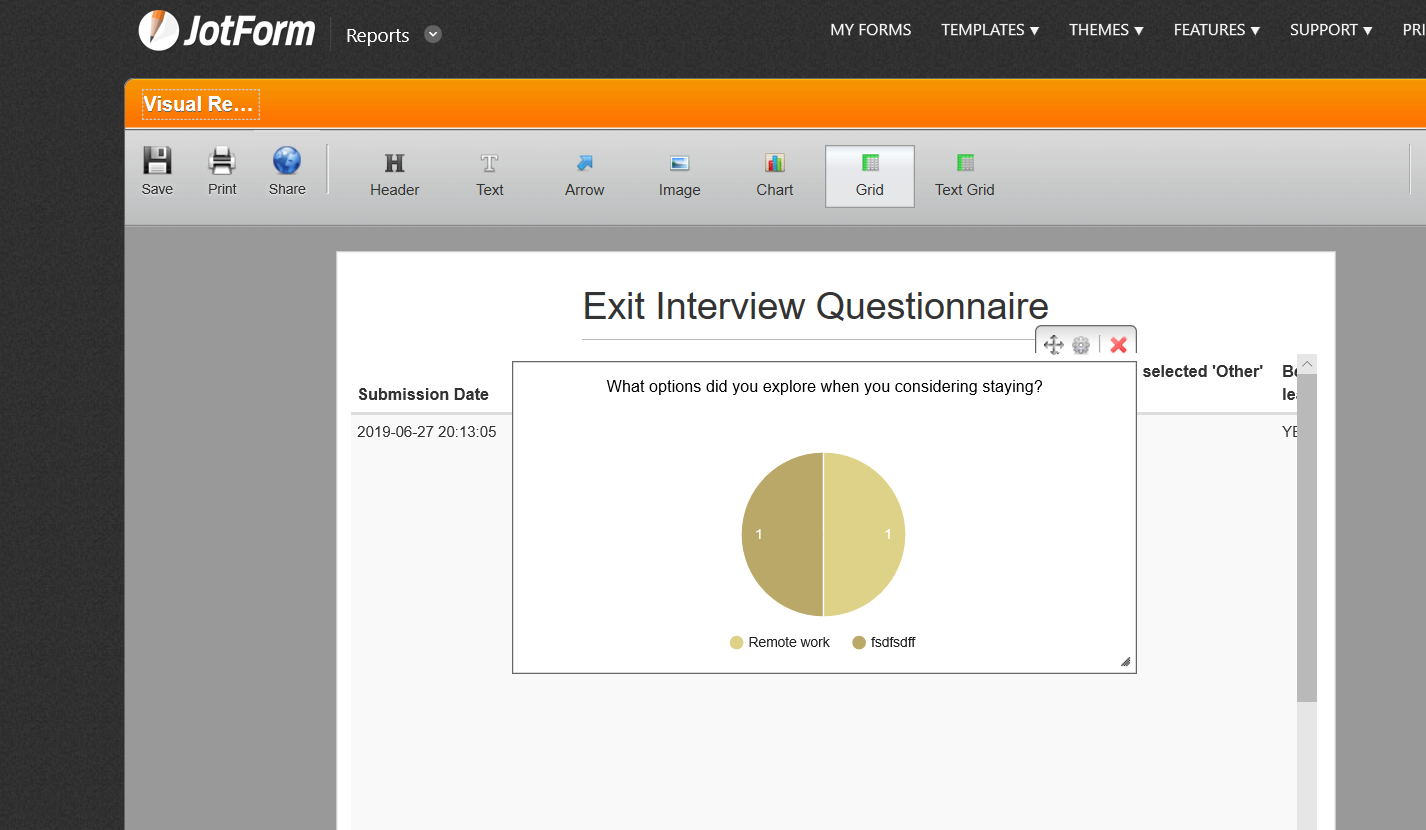
I am unable to make the visual report builder work, it will only show the chart for one of my questions.
-
utkuyildirim Enterprise RepresentativeReplied on July 5, 2019 at 9:02 AM
When you create a Visual Report, example charts will be automatically created from your submission data. To add more charts, first click on "Chart" and do the following:
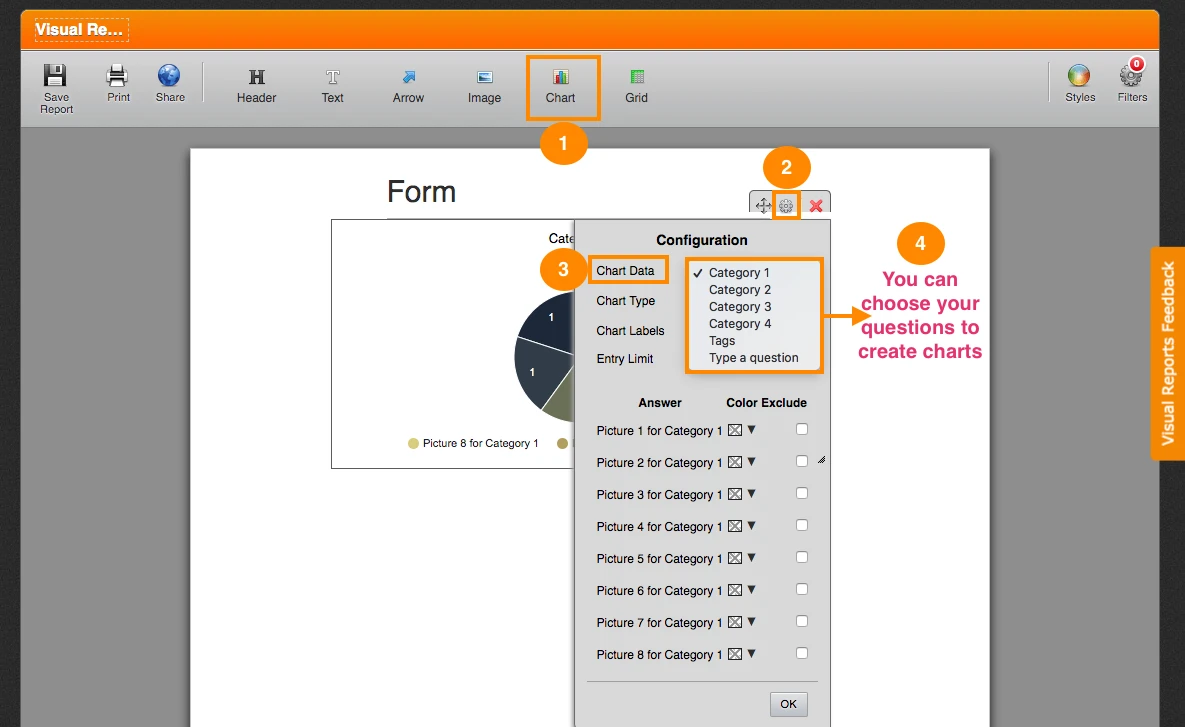
Now, click "OK" to create your new chart.
Please note that charts of the questions with selection options can be created with Visual Report.
If you have further questions, let us know!
Regards.
-
SylviaHelmReplied on July 5, 2019 at 9:05 AM
Yes I am clicking on the drop down but not all of my questions are displayed- only my free form answer questions are showing up as options. I thought that multiple choice and scale rating questions were also viable to have as graphs on report builder?
-
Girish JotForm SupportReplied on July 5, 2019 at 9:46 AM
Yes, the multiple choice fields types and the scale rating fields are visible in the reports builder. Here are the field types:

However, from your form, I can see that instead of the multiple choice field, you have used Checkbox in Dropdown widget and for the scale rating, you have used the Sliders with Calculated result widget.
These are not supported in the Visual Reports builder. That is why you are not able to view them. Please check this guide for details regarding what field types are supported in the Visual Reports builder: How-to-Create-a-Visual-Report-with-Your-Form-Submissions
Hope this info helps.
-
Sonnyfer JotForm SupportReplied on August 23, 2020 at 4:43 AM
Greetings! We're glad to inform you that we recently launched the new JotForm Report Builder with vastly improved features. To see the list of its newest functionalities, you can check it out here.
- Templates
- Integrations
- INTEGRATIONS
- See 100+ integrations
- FEATURED INTEGRATIONS
 PayPal
- Slack
- Google Sheets
- Mailchimp
- Zoom
- Dropbox
- Google Calendar
- Hubspot
- Salesforce
- See more Integrations
- Products
- PRODUCTS
- Form Builder
- Jotform Enterprise
- Jotform Apps
- Store Builder
- Jotform Tables
- Jotform Inbox
- Jotform Mobile App
- Jotform Approvals
- Report Builder
- Smart PDF Forms
- PDF Editor
- Jotform Sign
- Jotform for Salesforce Discover Now
- Support


