


-
natashamariemendozaAsked on March 11, 2014 at 9:34 PM
I have about 25 questions and more than half of it should be able to provide me with a visual report.
-
David JotForm Support ManagerReplied on March 11, 2014 at 10:17 PM
Unfortunately there's no way you can group all questions into one chart. You need to Edit the Visual Report, add another chart and set the next question on each chart and so on.
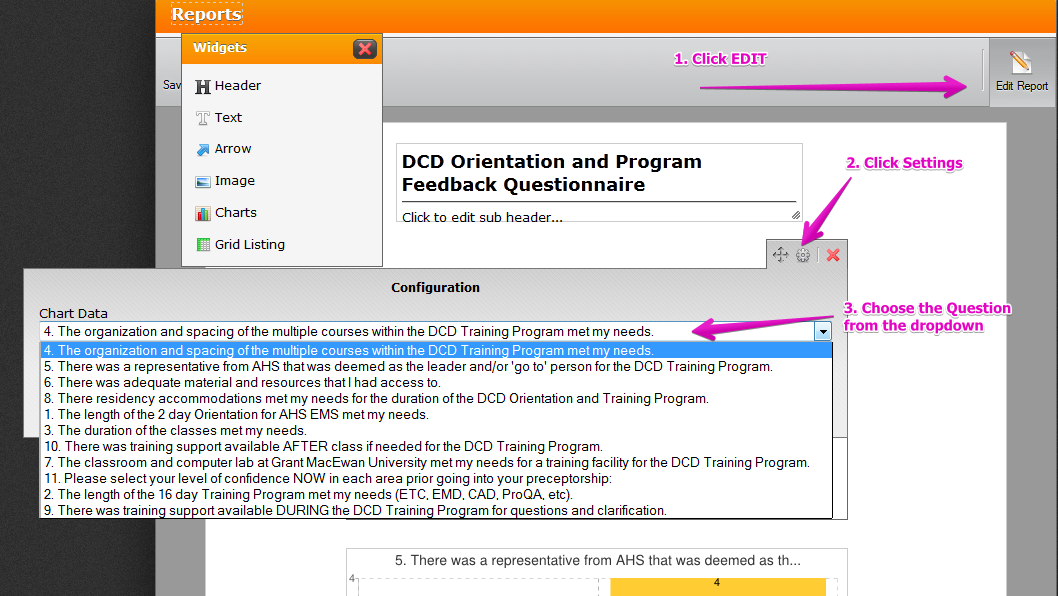
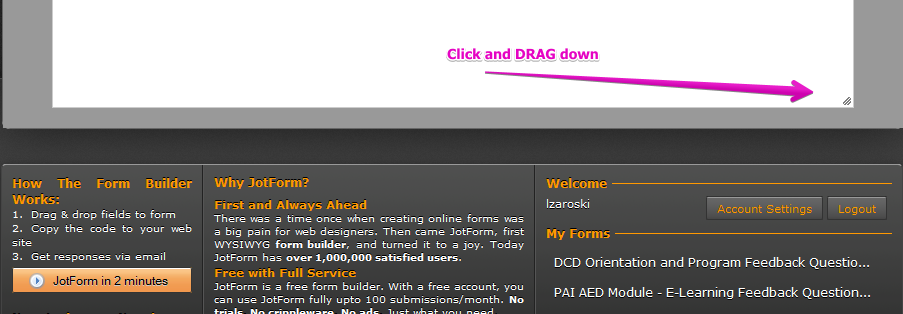
While editing, you can "drag" the the window to add extra space below or adjust the height of the visual report:
- Templates
- Integrations
- INTEGRATIONS
- See 100+ integrations
- FEATURED INTEGRATIONS
 PayPal
- Slack
- Google Sheets
- Mailchimp
- Zoom
- Dropbox
- Google Calendar
- Hubspot
- Salesforce
- See more Integrations
- Products
- PRODUCTS
- Form Builder
- Jotform Enterprise
- Jotform Apps
- Store Builder
- Jotform Tables
- Jotform Inbox
- Jotform Mobile App
- Jotform Approvals
- Report Builder
- Smart PDF Forms
- PDF Editor
- Jotform Sign
- Jotform for Salesforce Discover Now
- Support
