


-
JewishHumboldtAsked on February 6, 2015 at 4:43 PM
-
David JotForm Support ManagerReplied on February 6, 2015 at 5:50 PM
You can create visual reports with JotForm, please see this step by step guide: https://www.jotform.com/help/187-How-to-Create-a-Visual-Report-with-your-Form-Submissions
Chart is the main feature of the Visual Report Builder. Use to display your form submission in a graphical representation. The Chart Type are the following: Pie, Pie 2, Bar, Bar 2 and Line:
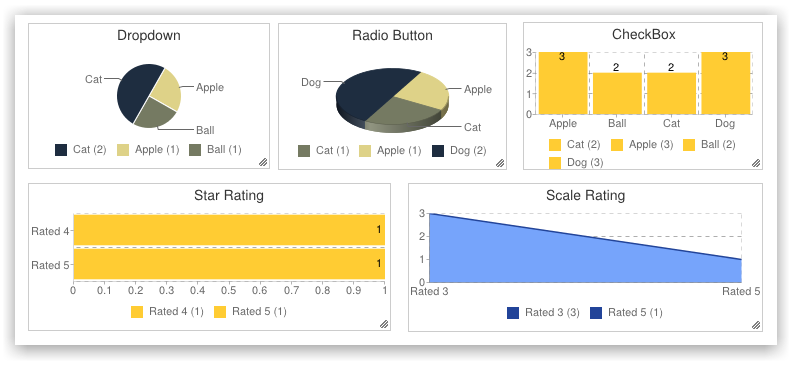
So, the closest to a thermometer graph would be the Bar chart, since it would not be possible to do a thermometer chart with the current features we have.
Here I found a tutorial to create a thermometer char with Excel. You could some how try to implement it in your downloaded Excel report.
Hope this helps you, let us know if you have more questions, we will be glad to assist you.
- Templates
- Integrations
- INTEGRATIONS
- See 100+ integrations
- FEATURED INTEGRATIONS
 PayPal
- Slack
- Google Sheets
- Mailchimp
- Zoom
- Dropbox
- Google Calendar
- Hubspot
- Salesforce
- See more Integrations
- Products
- PRODUCTS
- Form Builder
- Jotform Enterprise
- Jotform Apps
- Store Builder
- Jotform Tables
- Jotform Inbox
- Jotform Mobile App
- Jotform Approvals
- Report Builder
- Smart PDF Forms
- PDF Editor
- Jotform Sign
- Jotform for Salesforce Discover Now
- Support
