


-
StaffdevelopmentTTHAsked on April 23, 2015 at 4:29 PM
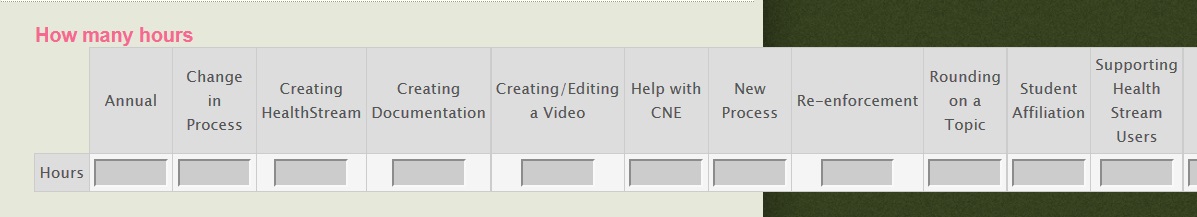
I need to be able to report on a list of items and the time it took. The only way I found to make it so I can have a bar graph is to do the matrix however as you can see it is too big. Also, I would like to track what other is.
I would like it ideally to be
How many hours did it take for the task?
Annual review 3 hours
Change in process 3
so that I can have a graph showing how much hours are spent on annual review versus change in process
-
David JotForm SupportReplied on April 23, 2015 at 6:05 PM
Hi,
Unfortunately, visual reports can only be run on the following field types:
- Drop Down
- Radio Button
- Check Box
- Star Rating
- Scale Rating
- Grading
- Slider
- MatrixFor the purpose of what it looks like you are trying to do, the Matrix would be the only way I can see to accomplish it. With the way the matrix works, it is not possible to split it into two rows.
You could always setup your matrix vertically instead. Here is what it would look like:
http://form.jotformpro.com/form/51127279348965
If you have any further questions, let us know and we will be happy to help.
- Templates
- Integrations
- INTEGRATIONS
- See 100+ integrations
- FEATURED INTEGRATIONS
 PayPal
- Slack
- Google Sheets
- Mailchimp
- Zoom
- Dropbox
- Google Calendar
- Hubspot
- Salesforce
- See more Integrations
- Products
- PRODUCTS
- Form Builder
- Jotform Enterprise
- Jotform Apps
- Store Builder
- Jotform Tables
- Jotform Inbox
- Jotform Mobile App
- Jotform Approvals
- Report Builder
- Smart PDF Forms
- PDF Editor
- Jotform Sign
- Jotform for Salesforce Discover Now
- Support
