


-
sgstlcAsked on September 30, 2015 at 2:56 PM
Hi,
I'm trying to make some graphs via my template "daily ticket totals". I'm trying to graph by "class" and by student name, ex" Jabion". However when I choose that in the visual report builder on the drop down menu, it tells me "no data". Can you help me fix this?
Thanks,
Meaghan Ohrenberger
Sarah Greenwood School
-
BorisReplied on September 30, 2015 at 5:12 PM
I believe this is about the following form: http://www.jotformpro.com/form/51384898372974
If that is the form in question, the problem comes from the fact that you are using Text Box fields to collect the values for students. Text Boxes can be filled with any text, which means that usually their entries are more or less unique. Additionally, textual values can't be computed for the charts, so text fields don't show correctly in the charts.
If you wish to have charts displaying the data for your students, you may want to collect student points through Number fields instead:
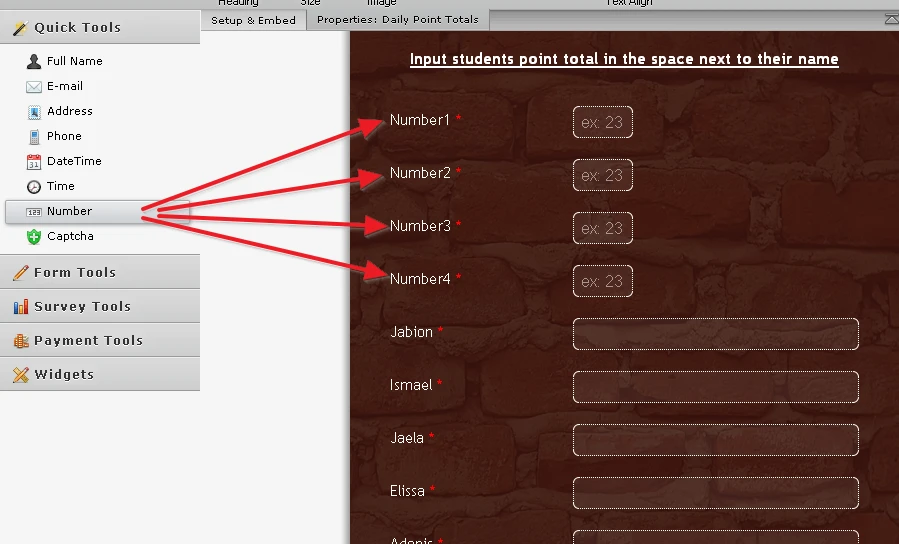
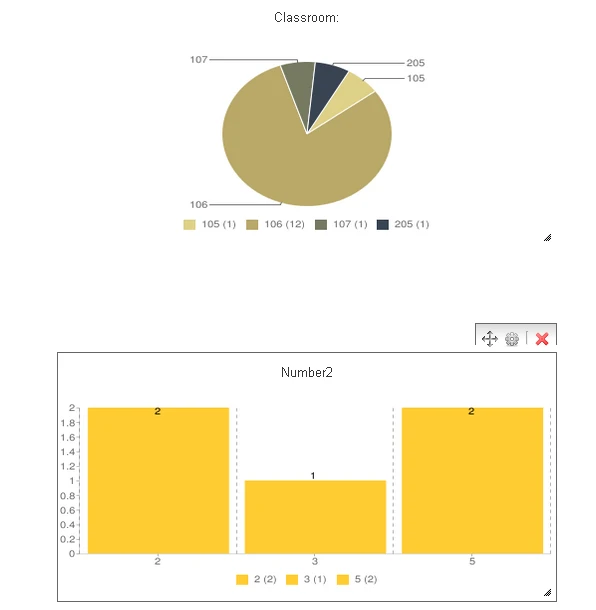
Values from number fields can be used to create charts and graphs in the Visual Report Builder:
I hope this helps.
-
sgstlcReplied on October 1, 2015 at 11:47 AMTHat is so helpful and such a simple fix. Thank you for your quick
response!
*Meaghan Ohrenberger *
*TLC Cluster Coordinator *
*617-635-8710 x108*
*Sarah Greenwood School *
***The contents of this e-mail message and any attachments are confidential
and are intended solely for addressee. The information may also be legally
privileged. This transmission is sent in trust, for the sole purpose of
delivery to the intended recipient. If you have received this transmission
in error, any use, reproduction or dissemination of this transmission is
strictly prohibited. If you are not the intended recipient, please
immediately notify the sender by reply e-mail or phone and delete this
message and its attachments, if any.***
...
- Templates
- Integrations
- INTEGRATIONS
- See 100+ integrations
- FEATURED INTEGRATIONS
 PayPal
- Slack
- Google Sheets
- Mailchimp
- Zoom
- Dropbox
- Google Calendar
- Hubspot
- Salesforce
- See more Integrations
- Products
- PRODUCTS
- Form Builder
- Jotform Enterprise
- Jotform Apps
- Store Builder
- Jotform Tables
- Jotform Inbox
- Jotform Mobile App
- Jotform Approvals
- Report Builder
- Smart PDF Forms
- PDF Editor
- Jotform Sign
- Jotform for Salesforce Discover Now
- Support
