


-
GoldsmithPRAsked on February 5, 2016 at 3:31 PM
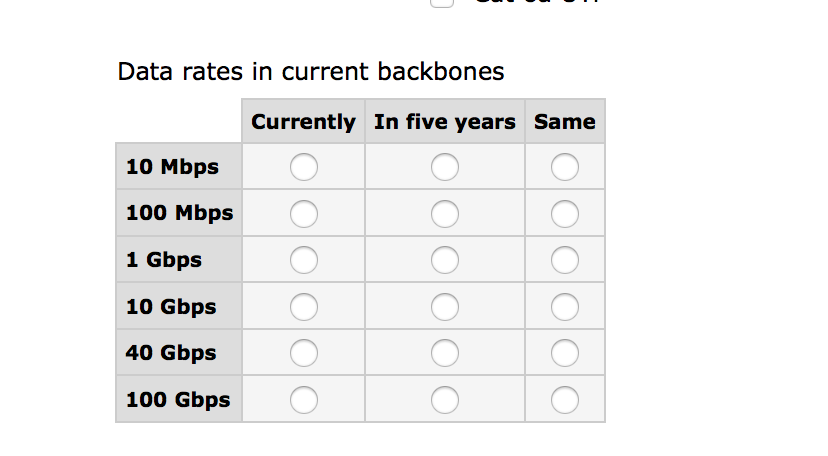
We ask some very important questions in our survey for which I need to show visual comparisons. Here is a link to the survey. https://form.jotform.com/60114323509142.
I am disappointed that I cannot figure out a way to display this. Also I cannot seem to change the colors in the bar charts, only the pie charts.
Please advise.
 Page URL: https://form.jotform.com/60114323509142
 -
BenReplied on February 5, 2016 at 4:27 PM
Since you mention "in the survey" I would like to confirm if you would like to have the report shown on the form, or if you want to have a visual chart report of the data submitted on the form instead?
Once we know more we would be happy to assist and help with the setup of the same.
- Templates
- Integrations
- INTEGRATIONS
- See 100+ integrations
- FEATURED INTEGRATIONS
 PayPal
- Slack
- Google Sheets
- Mailchimp
- Zoom
- Dropbox
- Google Calendar
- Hubspot
- Salesforce
- See more Integrations
- Products
- PRODUCTS
- Form Builder
- Jotform Enterprise
- Jotform Apps
- Store Builder
- Jotform Tables
- Jotform Inbox
- Jotform Mobile App
- Jotform Approvals
- Report Builder
- Smart PDF Forms
- PDF Editor
- Jotform Sign
- Jotform for Salesforce Discover Now
- Support
