


-
naggarAsked on August 10, 2016 at 6:41 AM
Dear Support,
I find the visual reporting option in Jotform very frustrating and incredibly hard to use.
-For example it's really hard to edit a graph size and if I try to expand it for the graph goes away and I cannot bring it back unless I insert a new one.
-It's also extremely hard to export multiple graphs on the same page, most of the time the graphs get cut in halves when exported, and there are no margins or pages shown on the editing view to help you place the graphs correctly.
Can you please help fix this. I have been wanting to use this tool for so long, but it feels very limited and outdated. Do you have other partners that I can use to produce reports externally as well? Please advice thank you.
Kind Regards,
-
Kiran Support Team LeadReplied on August 10, 2016 at 8:23 AM
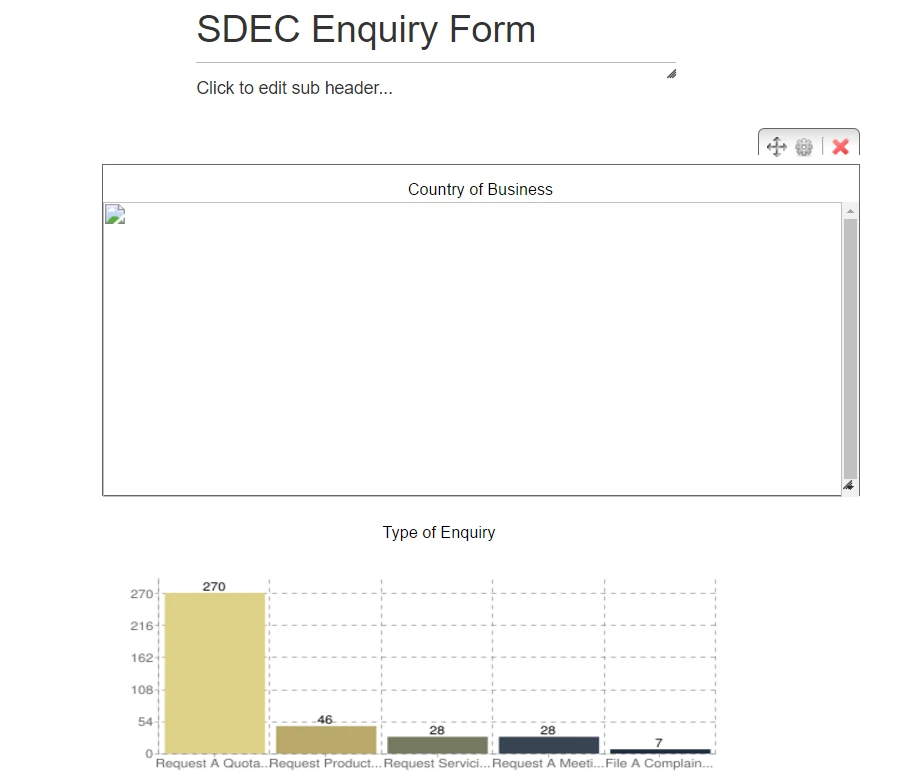
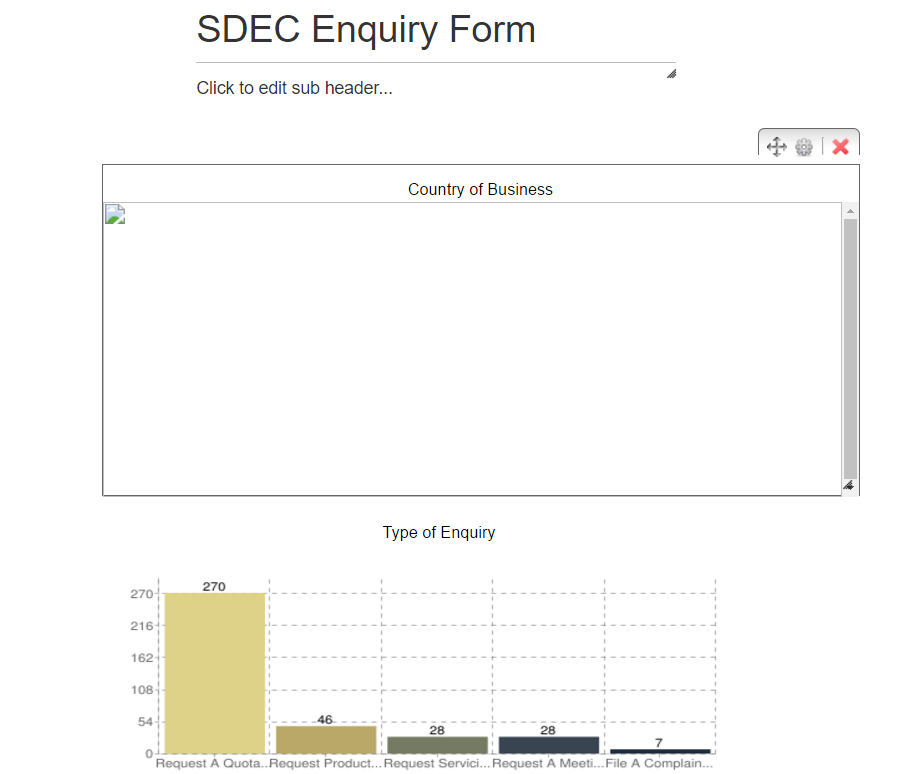
Please be noted that the size of the visual report can only be extended vertically. I have tried creating a new graph for the Enquiry form in your account and tried enlarging the graphs. The graphs are displayed without any issue at my end.
Please see the newly created visual report in your account and see how it is displayed.
https://www.jotform.com/report/62223767973061
You may try adding new graphs to the report and expand them. If you experience any issues, let us know.
Unforutnately, there are no other integrations avialable to generate the reports externally. However, you may download the submissions to Excel spreadsheet so that you may generate charts from Excel itself.
Hope this information helps!
- Templates
- Integrations
- INTEGRATIONS
- See 100+ integrations
- FEATURED INTEGRATIONS
 PayPal
- Slack
- Google Sheets
- Mailchimp
- Zoom
- Dropbox
- Google Calendar
- Hubspot
- Salesforce
- See more Integrations
- Products
- PRODUCTS
- Form Builder
- Jotform Enterprise
- Jotform Apps
- Store Builder
- Jotform Tables
- Jotform Inbox
- Jotform Mobile App
- Jotform Approvals
- Report Builder
- Smart PDF Forms
- PDF Editor
- Jotform Sign
- Jotform for Salesforce Discover Now
- Support
