


-
MinnesotaAITCAsked on October 10, 2016 at 2:24 PM
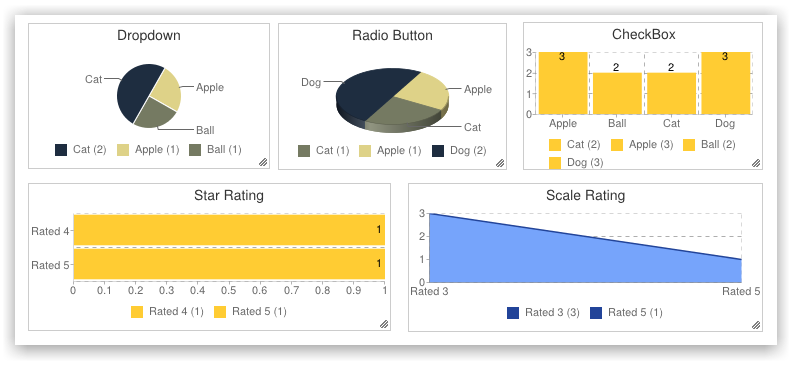
I would like to use the responses to a workshop feedback form to create a bar graph or circle graph that shows the percentages of how people responded to each question. Is this possible in jot form?
-
IrshadReplied on October 10, 2016 at 4:53 PM
I assume you are talking about these visual graphs and charts, right?
Please check this guide:
https://www.jotform.com/help/187-How-to-Create-a-Visual-Report-with-your-Form-Submissions
I would also like to mention the following guide since it gives you an insight into all of our reports and their features: How To Get Detailed Form Reports in JotForm
If you face any issue, or need further assistance, feel free to revert back.
Thanks.
- Templates
- Integrations
- INTEGRATIONS
- See 100+ integrations
- FEATURED INTEGRATIONS
 PayPal
- Slack
- Google Sheets
- Mailchimp
- Zoom
- Dropbox
- Google Calendar
- Hubspot
- Salesforce
- See more Integrations
- Products
- PRODUCTS
- Form Builder
- Jotform Enterprise
- Jotform Apps
- Store Builder
- Jotform Tables
- Jotform Inbox
- Jotform Mobile App
- Jotform Approvals
- Report Builder
- Smart PDF Forms
- PDF Editor
- Jotform Sign
- Jotform for Salesforce Discover Now
- Support
