If you have big amounts of data that you want to display in tabular shape within an HTML document, you should always keep an eye on the website’s performance. In general, it is possible to make a table with multiple hundreds or thousands of lines. However, it’s not always fun to work through a table of this length. Especially when using the mouse wheel, you will quickly notice that scrolling is not as smooth as it usually is. The amount of data in the table pressures the browser. Clusterize.js is a JavaScript library that helps with that issue by only loading and displaying certain parts of the table.
Simple concept, big impact
Clusterize.js requires that only a piece of a table is displayed within a scrollable container. Instead of all lines, you’ll only see a few lines. The container has a scrollbar, which allows you to move through the entire table. However, Clusterize.js makes sure that not the entire table is loaded. Instead, only the visible part of the table will be created in the DOM structure. As soon as someone scrolls within the table container, new table data is loaded. To make the scrollbar work, a certain height is added to the invisible areas. This allows you to scroll through the chart just like usual.
The difference is especially noticeable when dealing with huge amounts of data. The automatic reload via JavaScript makes sure that there are only a few chart lines at once. That’s the reason for the slim source and it prevents performance problems. Besides the acceleration, the user won’t notice a difference. The loading of the data happens in the background.
Loading tables via Clusterize.js
In order to be able to use Clusterize.js, you need to integrate the library’s JavaScript and stylesheet file at the end of the HTML body. Afterwards, you can choose between two loading options. When you already have a table with all lines, Clusterize.js causes the lines to be removed and saved in an array that is outside of the visible area. Alternatively, you can also mark an empty chart and directly transfer the lines as a JavaScript array. Then, the single lines need to be marked via HTML, however.
<div class="clusterize">
<table>
<thead></thead>
</table>
<div id="scrollArea" class="clusterize-scroll">
<table>
<tbody id="contentArea" class="clusterize-content">
<tr class="clusterize-no-data">
<td>Lade Daten …</td>
</tr>
</tbody>
</table>
</div>
</div>
This example shows, how a chart needs to be labelled to make it useable for Clusterize.js. Two „<table>“ elements are created, so that the table’s body lines can be scrolled independently from the headers. This means, that the first table contains the fixed headers. The second table, which is placed within a „<div>“ element, is scrollable. The paling container element makes sure that only a section of the chart is visible. It’s important that the respective classes are also given („clusterize“, „clusterize-scroll“ and „clusterize-content“). The table is addressed via Clusterize.js using the ID of the „<div>“ element and the included „<table>“ element.
var daten = ["<tr>…</tr>", "<tr>…</tr>", …];
var clusterize = new Clusterize({
rows: daten,
scrollId: "scrollArea",
contentId: "contentArea"
});
As the table doesn’t contain any content yet, the content needs to be transferred using an array. Here, the array „data“, which contains entirely marked lines that are initiated via „<tr>“ element, is used. This array is handed over to the „Clusterize()“ object option „rows“. When the lines are all labelled within the „<table>“ element, the „rows“ option is simply left out.
You can set the area that defines the scrollable area, in which the actual table is placed, by using the option „scrollId“. The chart is addressed via „contentId“.
There’s nothing else to do. Clusterize.js makes sure that the right lines are loaded and displayed automatically. The whole thing is not restricted to tables, it also works for lists. You can load sorted („<ol>“) as well as unsorted lists („<ul>“) the same way. Naturally, this only makes sense when you have accordingly long lists where you can expect an improved performance.
Changeable amount of lines per block
By default, there are always 50 lines loaded in one block which is then placed within the table. However, the number of lines can be set individually in the options. For example, when there are always more than 50 visible lines due to the chart’s design, you should adjust the amount of loaded lines per block accordingly.
The amount of blocks in a cluster can also be edited. By default, there is a maximum of four clusters in the table.
var clusterize = new Clusterize({
…
rows_in_block: 50,
blocks_in_cluster: 4
});
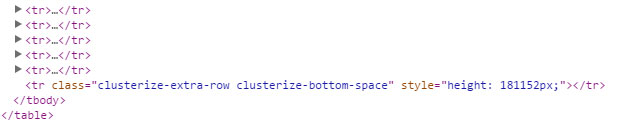
There are other optional settings as well. Notably, the option to define an element to fill the table using „tag“. When no element is chosen via „tag“, Clusterize.js automatically selects a fitting one – for example, „<tr>“ for charts and „<li>“ for lists. A height equivalent to the height of the not loaded table lines or list elements is assigned to these placeholder elements via the CSS attribute „height“.
Although the framework deals with the loading of content by itself, there are methods to update data and add new lines to a chart.
clusterize.append();
The example with the method „append()“ causes new data to be attached to the end of the table. This usually happens when scrolling down. Analogously, there is the method „prepend()“, which adds the data to the beginning. This usually happens when scrolling up.
Browser Support and Download Link
Clusterize.js works on all modern and mobile browsers, including the Internet Explorer from version 8 and up. However, there is one thing to keep in mind. The height for the not displayed content is defined via CSS. This height can end up being rather big when dealing with hundreds or thousands of chart lines. The problem is, that all browsers have different maximum values for heights. Webkit browsers, for example, can go up to around 134 million pixels, while Gecko browsers can „only“ interpret ten million pixels of height. You should keep these limits in mind.
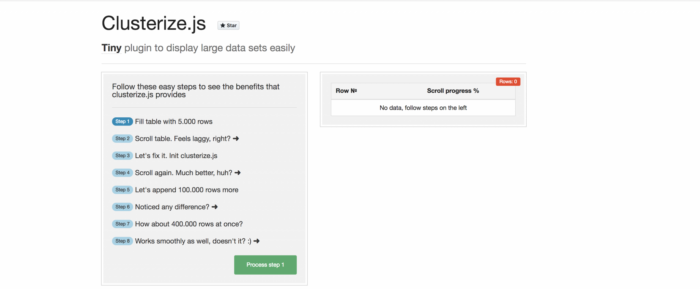
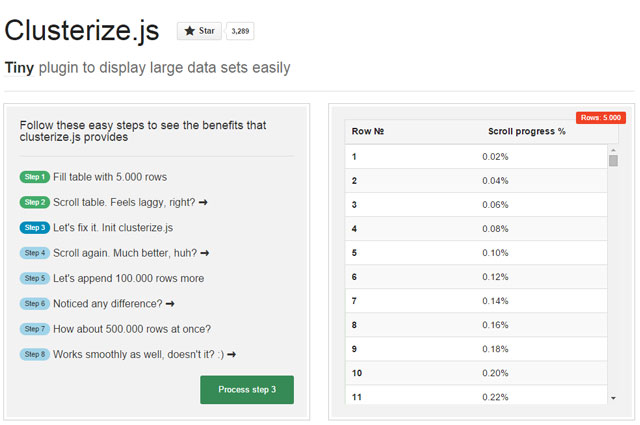
The library is available under the liberal MIT license and can thus also be used commercially. When you want to convince yourself of the performance difference, you can find a very convincing example on the project website. You can compare a „normal“ table to a Clusterize.js optimised table there.


Send Comment:
2 Comments:
December 25, 2018
Please provide examples
January 13, 2016
looks like a sweet little plugin - thanks!