Jotform’s Diagrams.net (formerly Draw.io) widget lets you embed diagrams such as flowcharts, wireframes, and organizational charts directly into your form. This makes it easier to display visual content within your form layout, helping users better understand processes, structures, or instructions.
Here are a few ways to use it:
- Add professional diagrams to your forms.
- Display flowcharts, wireframes, or process visuals.
- Provide visual explanations for instructions or workflows.
Make your forms more engaging with clear visual elements.
Whether you’re building a new form or editing an existing one, you can add and configure the Diagrams.net in just a few steps. This is how it’s done:
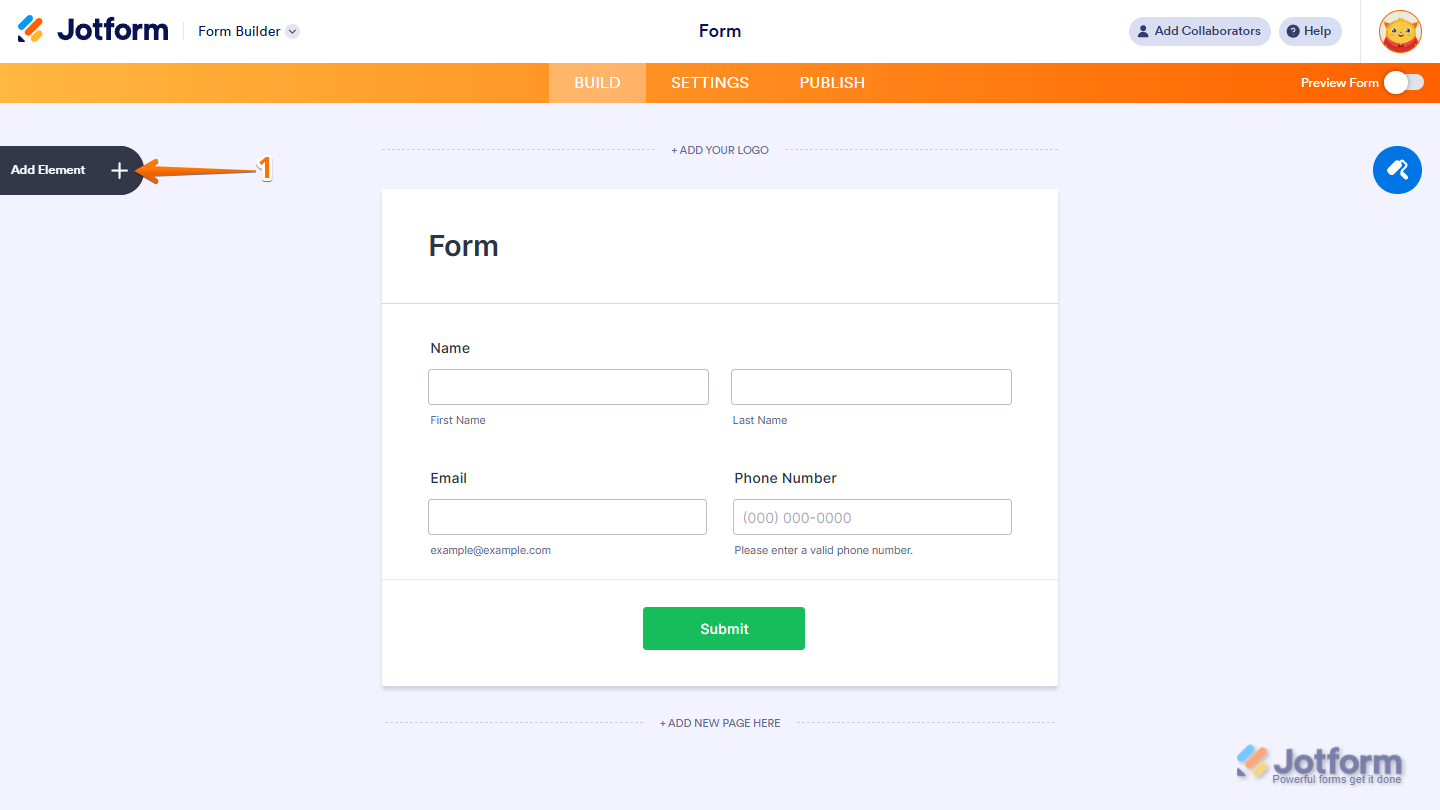
- In Form Builder, click on Add Element on the left side of the page.
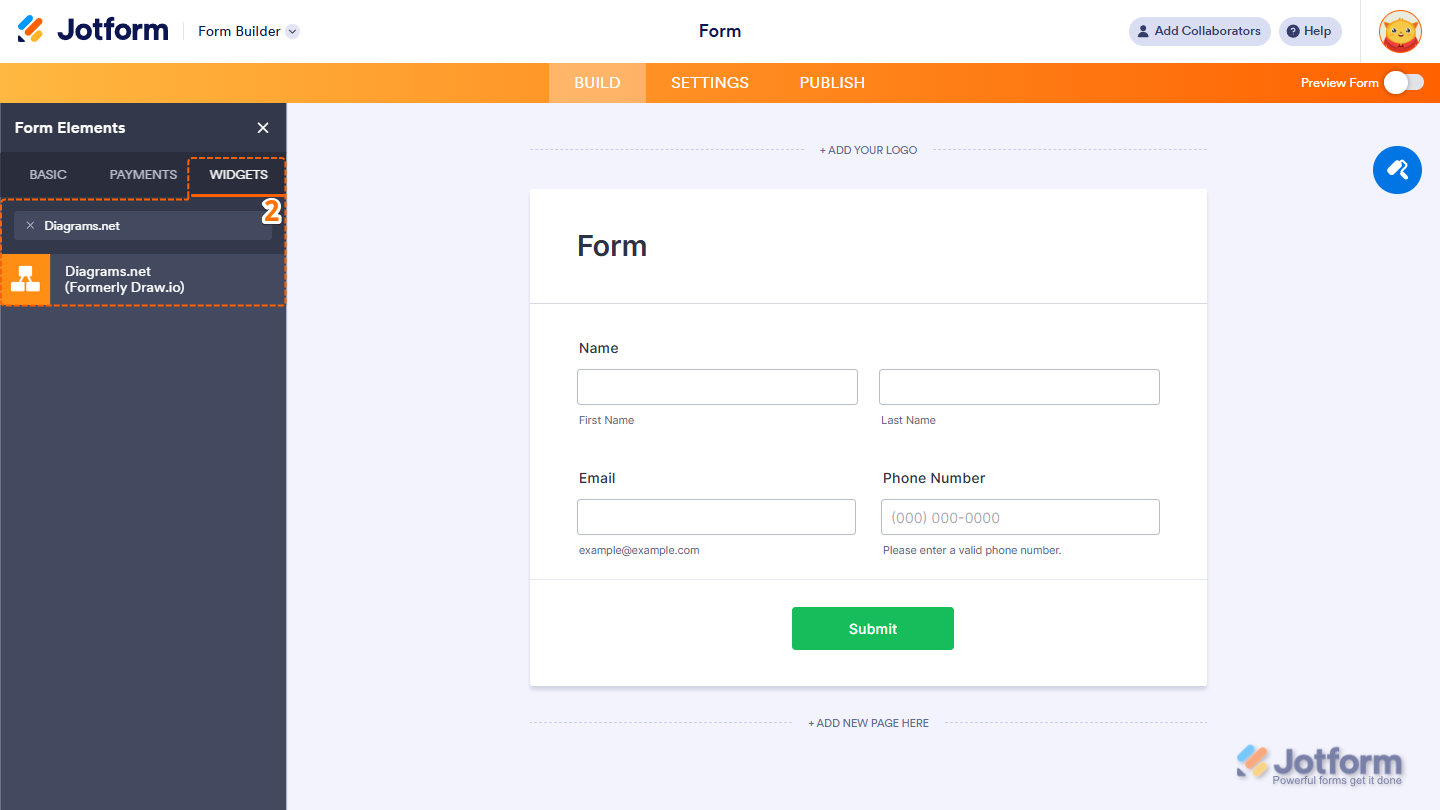
- Now, in the Form Elements menu, under the Widgets tab, search for Diagrams.net and click on it. Or, just drag and drop it to where you want it to be on your form.
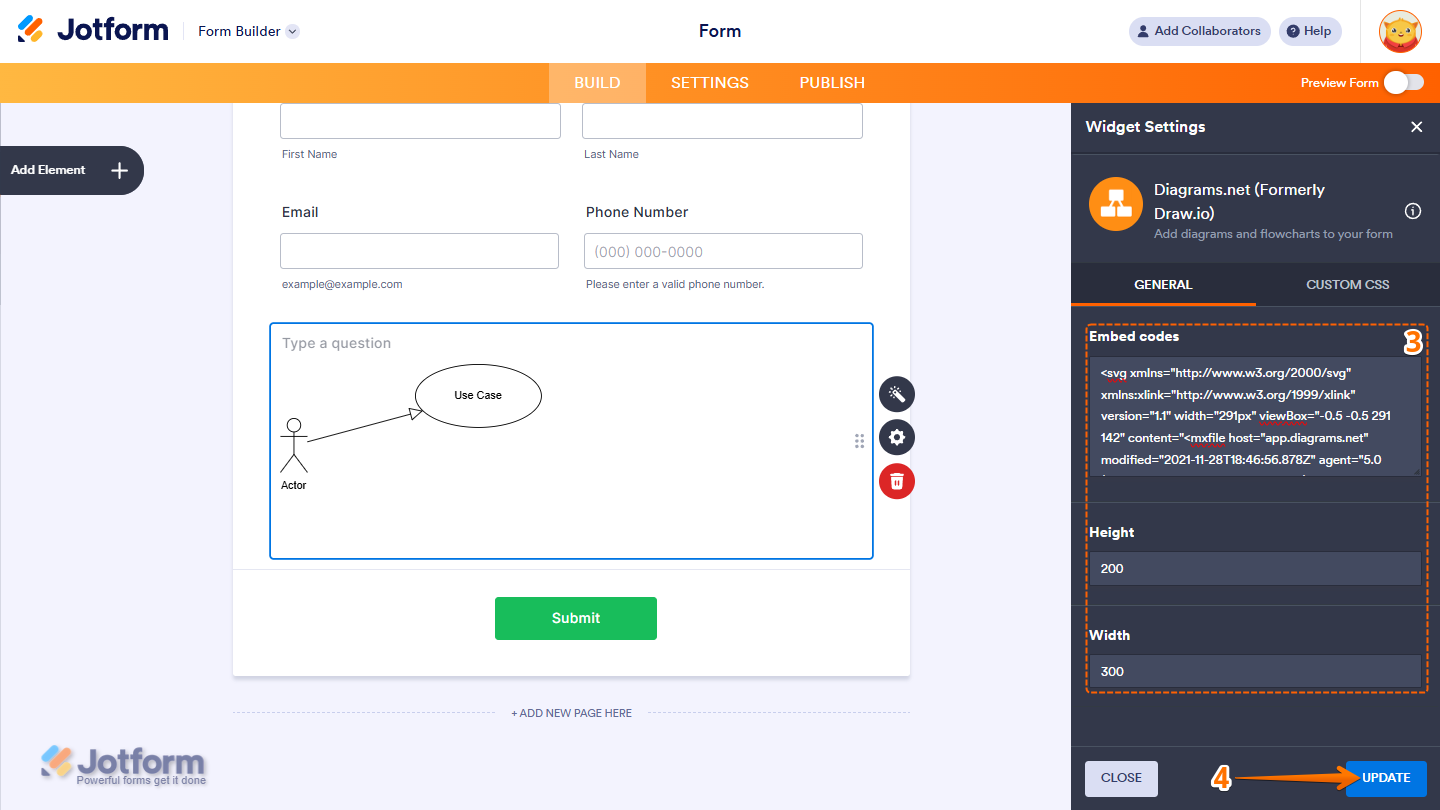
- Next, in the Widget Settings window that opens on the right side of the page, under the General tab, set up these things:
- Embed Codes — Paste the embed code for your diagram from Diagrams.net. Take a look at this guide on Generate Code to Embed a Diagram in a Webpage for more details.
- Height — Set the height of the embedded diagram on your form.
- Width — Set the width of the embedded diagram on your form.
- When your settings are ready, click on Update.
That’s it. Now you’ve added and set up the Diagrams.net widget on your form. You can explore how it looks with this demo form.
Note
- For advanced styling of the widget, you can add your own custom CSS code under the Custom CSS tab in the Widget Settings. Our guide on How to Inject CSS Codes to Widgets walks you through everything.
- You can also configure the widget properties, like alignment, labels, size, visibility, and more, to control how it looks and behaves in your form. Check out our guide on How to Access and Configure the Question Properties of a Widget to learn more.

Send Comment: