
If you’re looking to create a survey to measure how an audience truly feels about your product or service, consider including a Likert scale. By using a Likert scale — essentially a rating scale that helps measure people’s opinions and overall satisfaction levels — you’ll be able to collect better, more valuable feedback that can help guide future business decisions. In fact, there are many examples that proves the value of Likert scales.
One of the best, most popular types of Likert scales is the 5-point scale, as it provides respondents with a manageable range of options to choose from: two positive (e.g., strongly agree and somewhat agree), two negative (strongly disagree and somewhat disagree), and one neutral.
Likert scales can deliver a number of benefits:
- They’re easy to understand and navigate.
- They don’t require a lot of time to complete.
- They produce useful, at-a-glance views of data distribution.
- They quantify your customers’ feelings and opinions.
Here’s a breakdown of how they work.


Creating a 5-point Likert scale
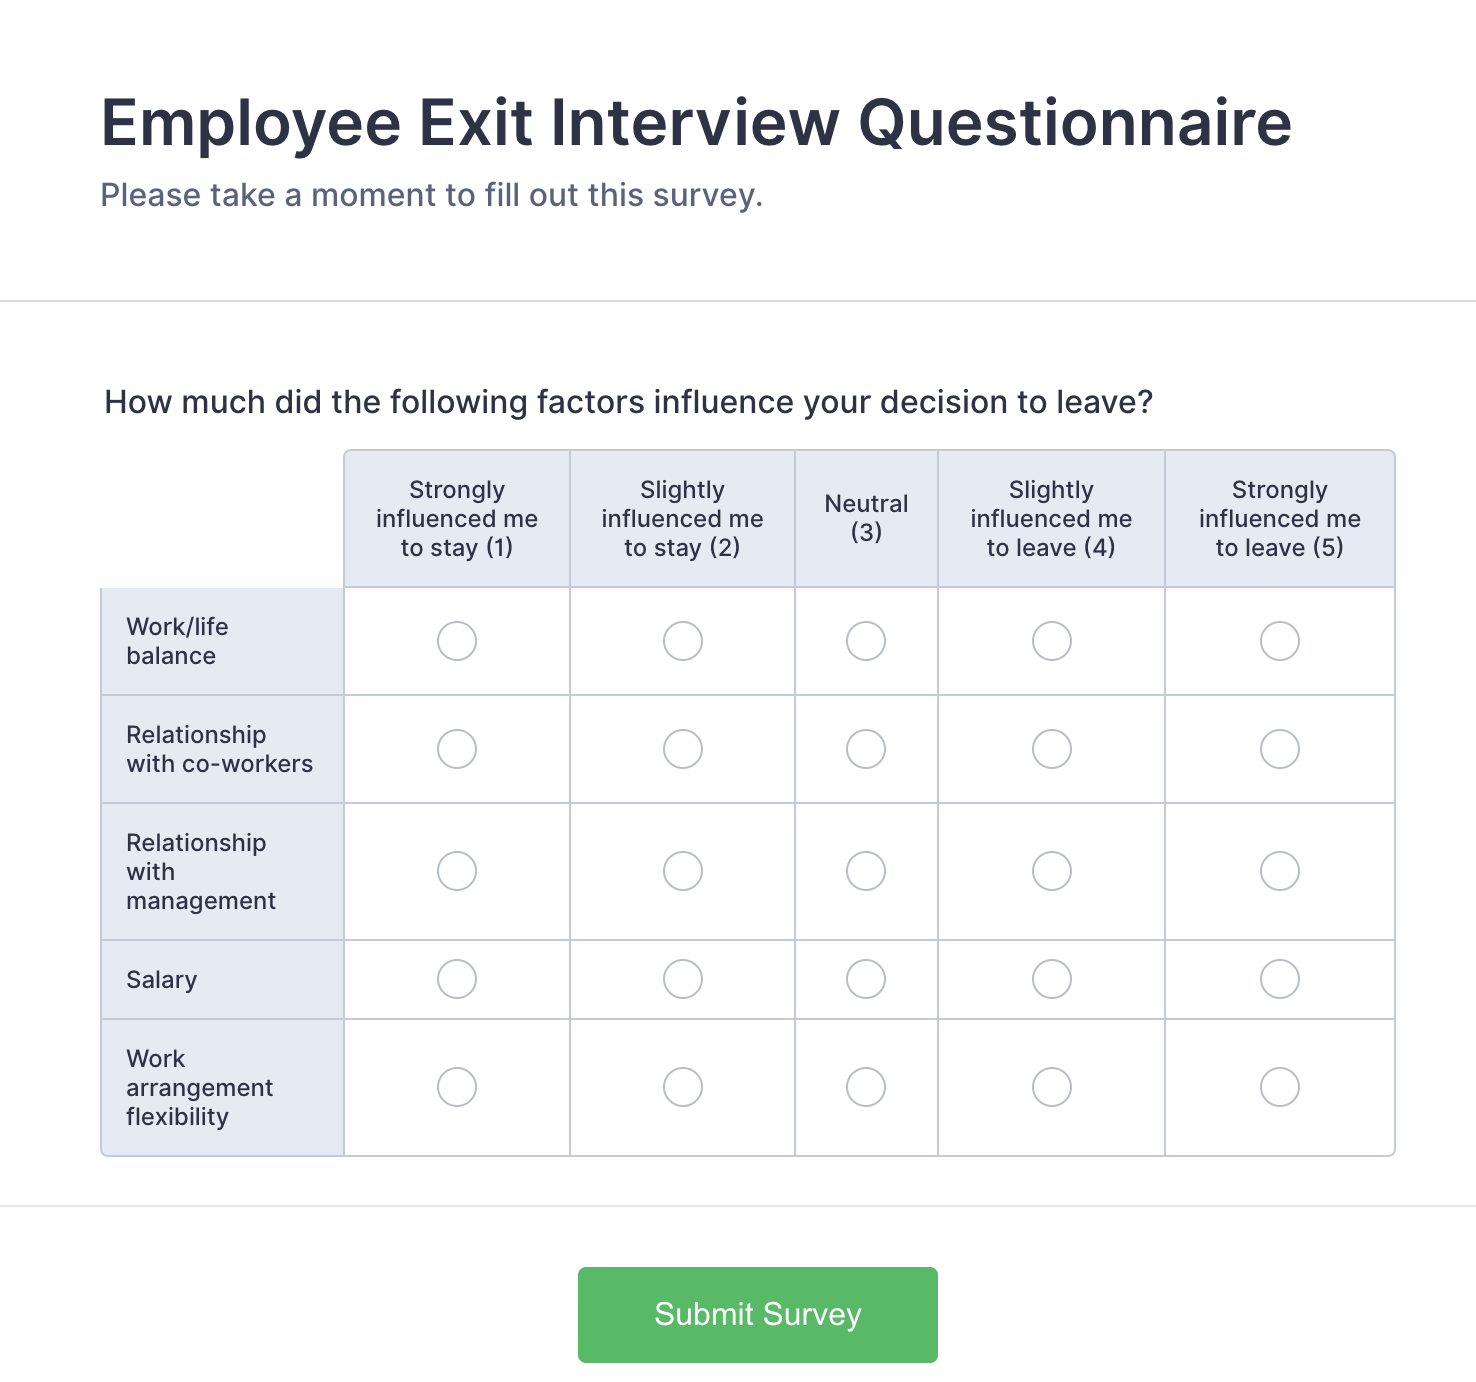
To get a better idea of how to create and analyze a 5-point Likert scale, let’s imagine you want to create an employee exit interview questionnaire to better understand a recent increase in employee turnover at your company. Perhaps you have your suspicions about what could be causing the uptick, but you’d feel more comfortable having tangible data to back up your concerns in order to prepare for an upcoming staff meeting.
As a baseline, your exit interview survey includes the following five aspects of working for your company for your respondents to rate (though you could always make it much longer and more granular): work/life balance, relationship with colleagues, relationship with management, salary, and work arrangement flexibility (e.g., whether your organization allows employees to work remotely). Based on the responses you receive, you can assess which factor most influenced their decision to leave.
Once you add the response options to the exit interview survey, it should look something like this survey sample below (created using Jotform’s online form builder).
Analyzing a 5-point Likert scale
Now that you’ve collected all the surveys from former employees, it’s time to analyze the results by finding the mode of the responses, which isolates the value that appears most often in a set of data.
By assigning numerical values for each sentiment level — 1 for “Strongly influenced me to stay” and 5 for “Strongly influenced me to leave” — you can quantify how your respondents feel about each category and the job overall.
To illustrate, let’s assume you gave the exit interview survey to five people and these were their responses:
- Person 1
- Work/life balance = 2
- Relationship with colleagues = 3
- Relationship with management = 4
- Salary = 5
- Work arrangement inflexibility = 3
- Person 2
- Work/life balance = 4
- Relationship with colleagues = 5
- Relationship with management = 3
- Salary = 3
- Work arrangement inflexibility = 2
- Person 3
- Work/life balance = 1
- Relationship with colleagues = 1
- Relationship with management = 5
- Salary = 5
- Work arrangement inflexibility = 5
- Person 4
- Work/life balance = 1
- Relationship with colleagues = 2
- Relationship with management = 4
- Salary = 5
- Work arrangement inflexibility = 5
- Person 5
- Work/life balance = 3
- Relationship with colleagues = 2
- Relationship with management = 4
- Salary = 4
- Work arrangement inflexibility = 5
Next, multiply the number associated with each sentiment by the number of respondents.
Let’s start with work/life balance:
| Sentiment | Numerical Value | Responses | Total |
|---|---|---|---|
| Strongly influenced me to stay | 1 | 2 | 2 |
| Slightly influenced me to stay | 2 | 1 | 2 |
| Neutral | 3 | 1 | 3 |
| Slightly influenced me to leave | 4 | 1 | 4 |
| Strongly influenced me to leave | 5 | 0 | 0 |
Then, add the totals and divide that number by the total number of respondents to get the sentiment score: 2 + 2 + 3 + 4 + 0 = 11. Eleven divided by five respondents equals an average score of 2.2.
Since the numerical value 2 means “Slightly influenced me to stay,” you can safely deduce that work/life balance is probably not the reason for your increased turnover. In fact, it appears to be one of the benefits of working for your company.
By repeating the same steps for the other four categories, you can learn the following:
- With a sentiment score of 2.6 (“Slightly influenced me to stay” leaning slightly toward the “Neutral” zone), your former employees likely didn’t leave because of their relationship with their colleagues.
- Based on a sentiment score of 4 (“Slightly influenced me to leave”), your former employees didn’t appear to have the best relationship with management. Though it’s not the only factor that’s pushing them toward the door, it’s certainly worth exploring.
- With a sentiment score of 4.4 (“Slightly influenced me to leave”), salary was definitely a factor that caused your former employees to look elsewhere for work. Consider doing some research to see where your company’s pay and benefits align compared to others in your industry.
- Finally, with a sentiment score of 4.8 (“Slightly influenced me to leave”), work arrangement flexibility is the closest your analysis has come to getting to the root of your turnover problem. And though it’s not quite a 5 (“Strongly influenced me to leave”), it’s close, so it might be time to figure out ways to create a more adaptable, flexible work environment.
Additionally, by totaling each category’s average sentiment score and dividing that sum by the number of total categories (2.2 + 2.6 + 4 + 4.4 + 4.8 / 5), you get an average sentiment score for the entire employee exit interview questionnaire of 3.6.
And though 3.6 (“Neutral” leaning toward “Slightly influenced me to leave”) may not seem particularly significant, it does indicate that the factors you’re asking about are indeed affecting turnover, so you’re on the right track with this survey.
If your overall sentiment score was a 1 or 2, for instance, you wouldn’t be gathering much information about why your employees have left. Instead, you’d have to switch up the factors in your survey to better narrow down employees’ reasons for quitting.
From school and employee surveys to marketing and product questionnaires, surveys make data collection and analysis both manageable and actionable. And now that you’re a 5-point Likert scale expert, you can create your own.
Just so you know
If you want to create your own Likert scale surveys, you can use Jotform’s Likert scale creator.


Send Comment: