Polling forms can serve as a tool for gauging public opinion. They can provide a quick snapshot of how a majority of people feel about a particular topic or issue. Allowing users to see overall results after submitting their entries can increase engagement. It promotes transparency and trust in the polling process and provides immediate feedback to participants, showing them how their responses fit into the larger group.
Showing Poll Results With Visual Report
Jotform’s Visual Report allows you to transform data into visually appealing charts and graphs, making it easier to identify trends and insights at a glance.


To show poll results using Visual Report
- Create a Visual Report from your polling form. See How to Create a Visual Report for more information.
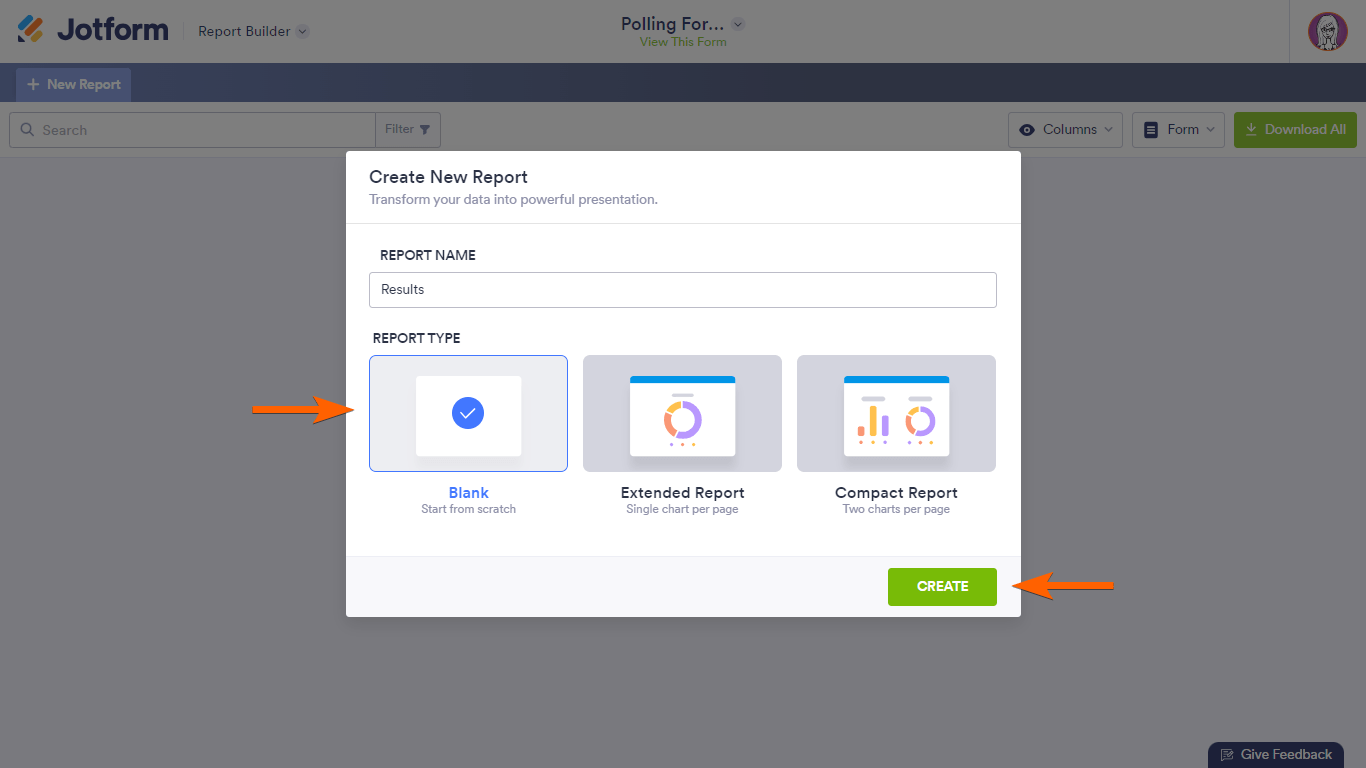
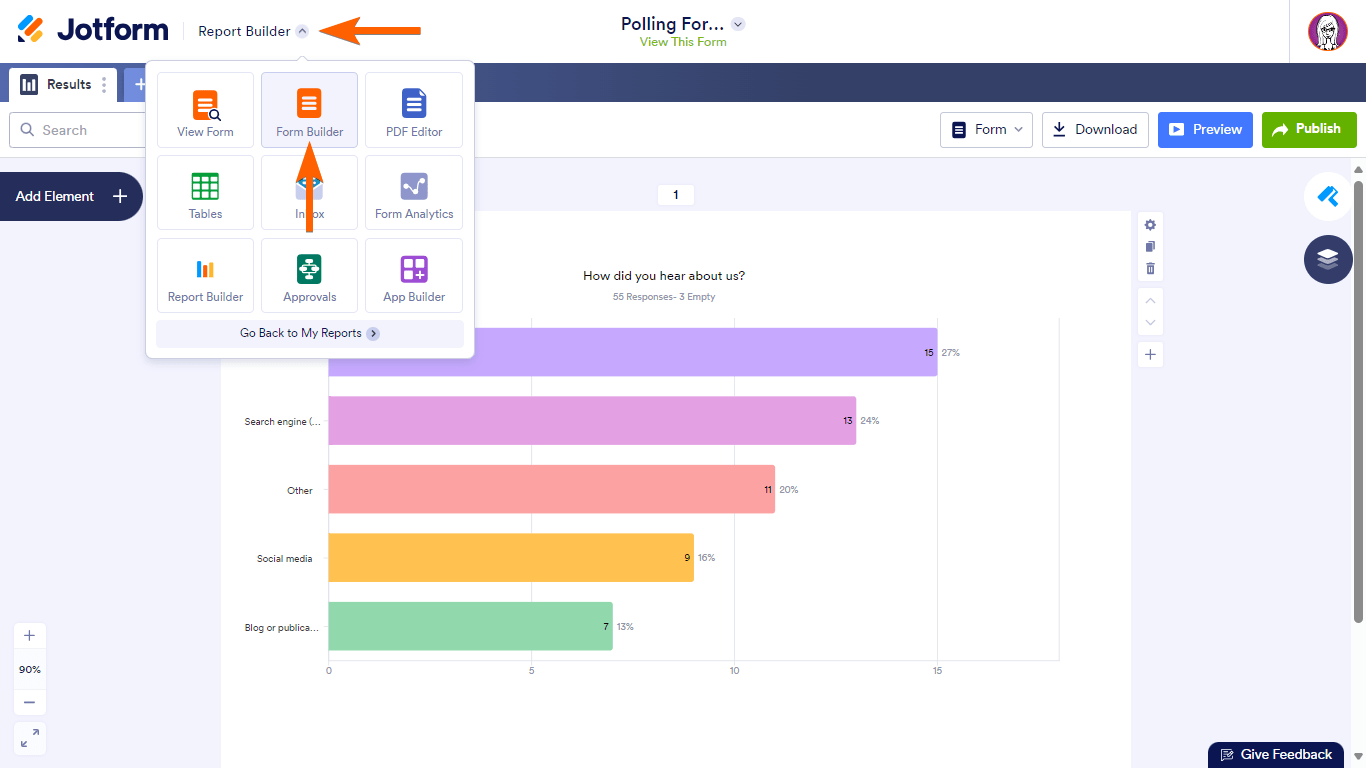
- In the Report Builder, start with a Blank report type.
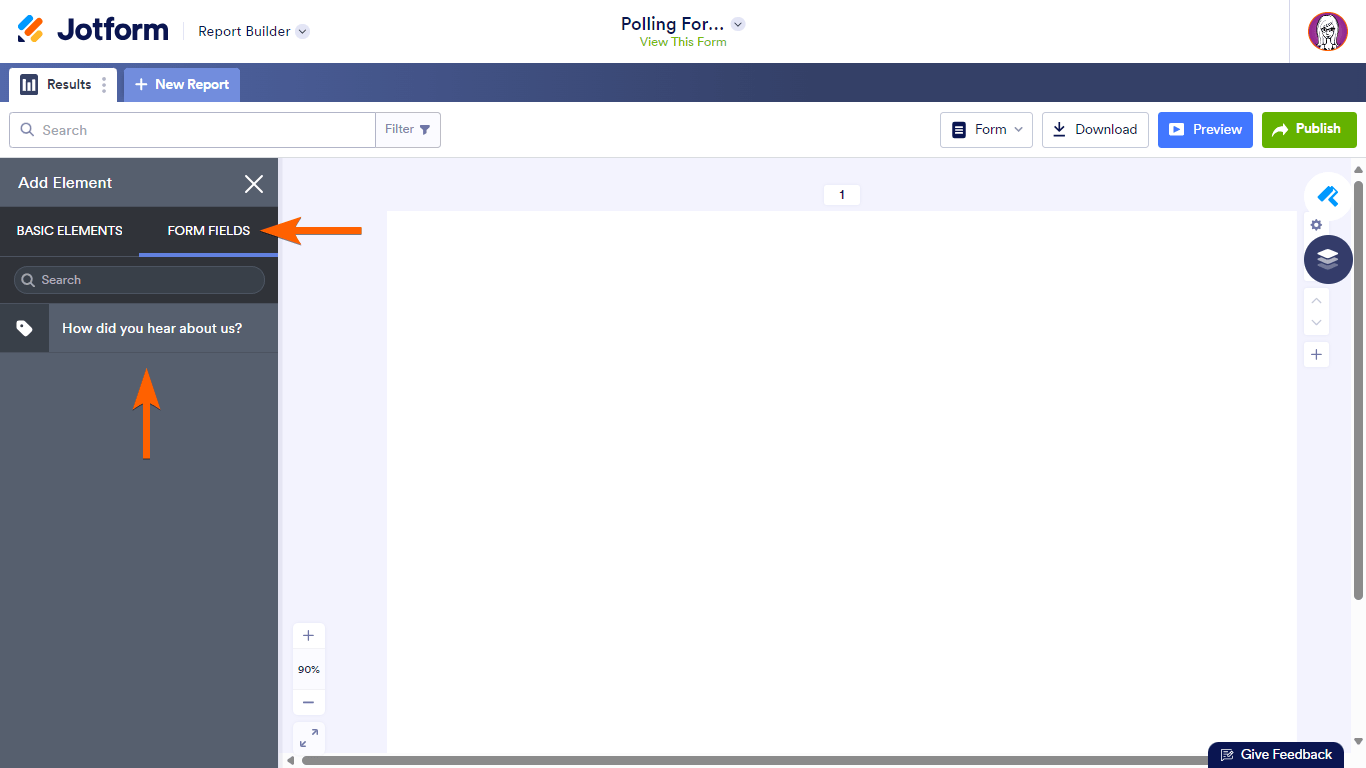
- In Add Element, go to Form Fields at the top, then select your poll question.
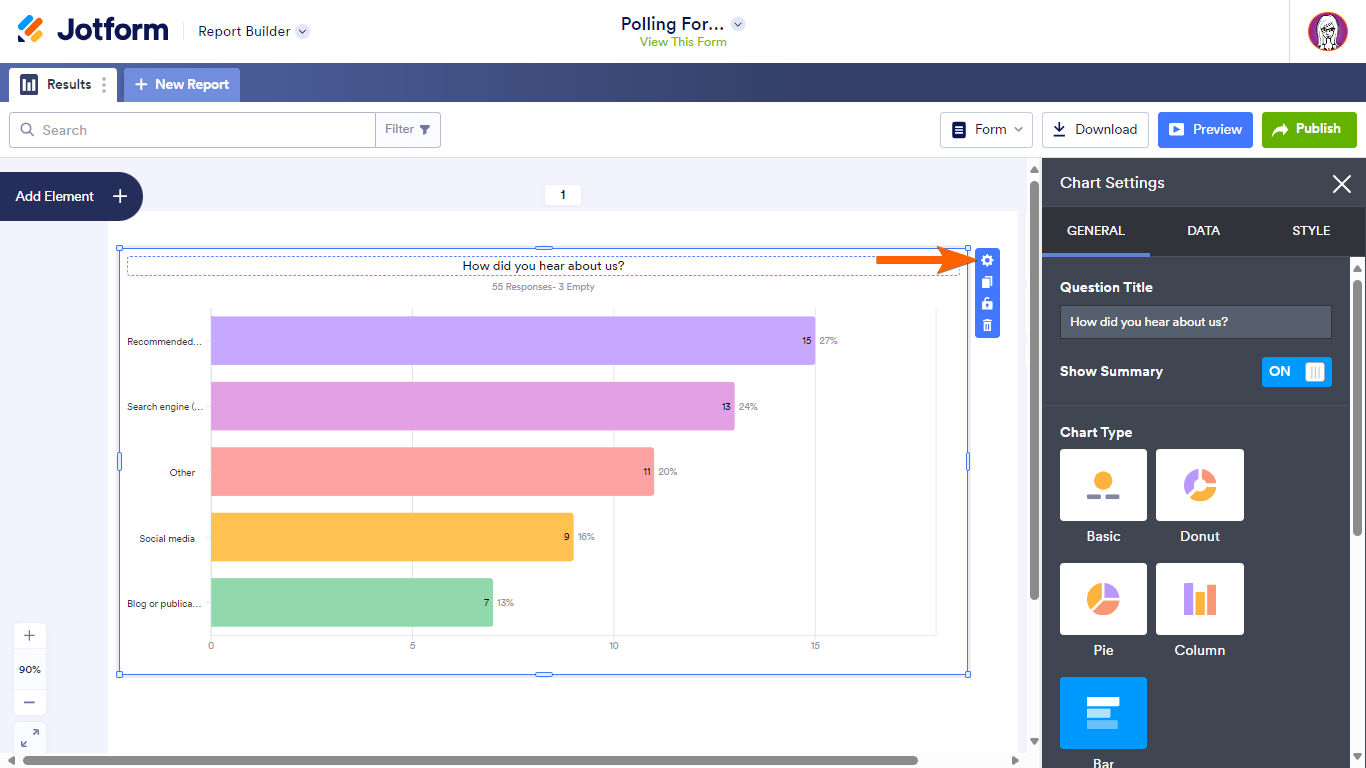
- Resize and customize your chart (select the gear icon to open Chart Settings).
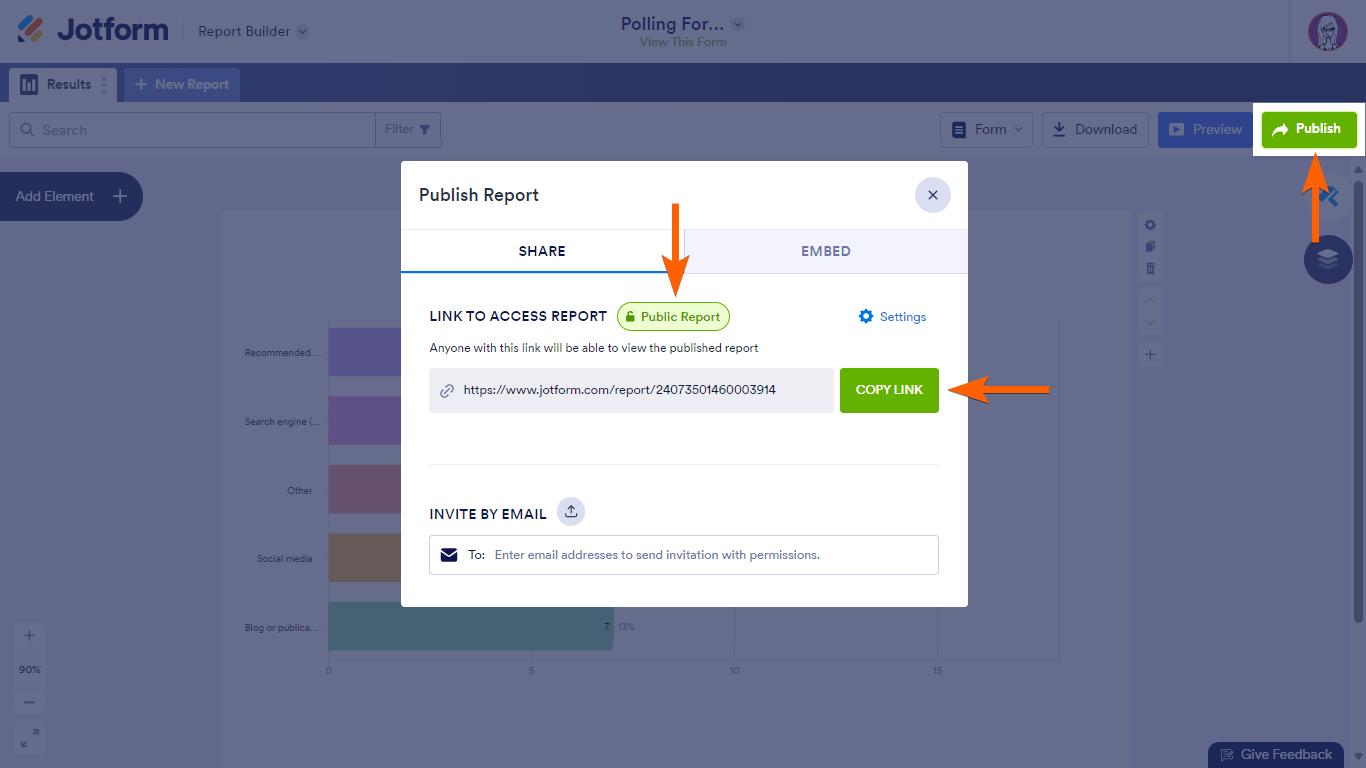
- Select Publish in the upper-right corner.
- Set your report to Public, then copy the provided link. See How to Share Your Visual Report to learn more.
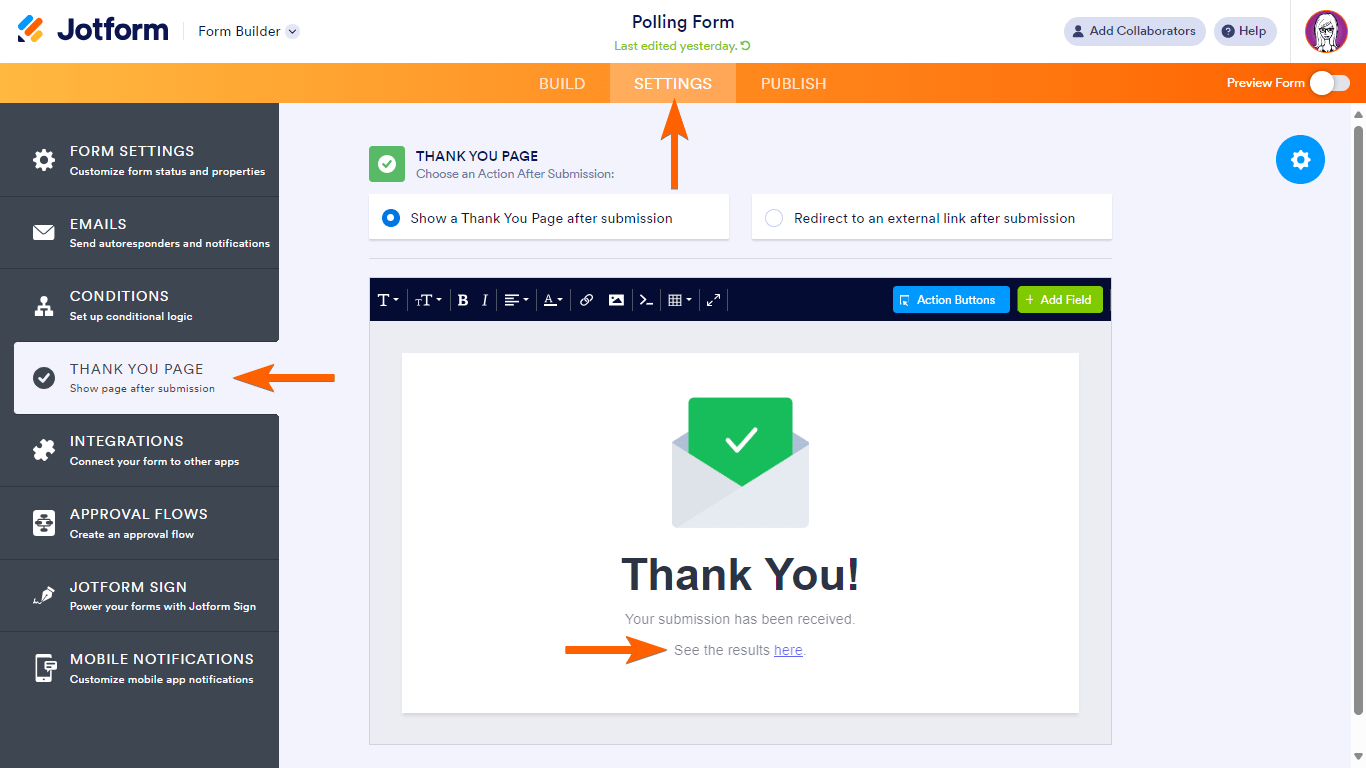
- To share the poll results, edit your polling form in the Form Builder.
- Go to Settings > Thank You Page.
- Add the report link to your Thank You page. Or redirect your form fillers to the report after submission.
Showing Poll Results With JotPoll
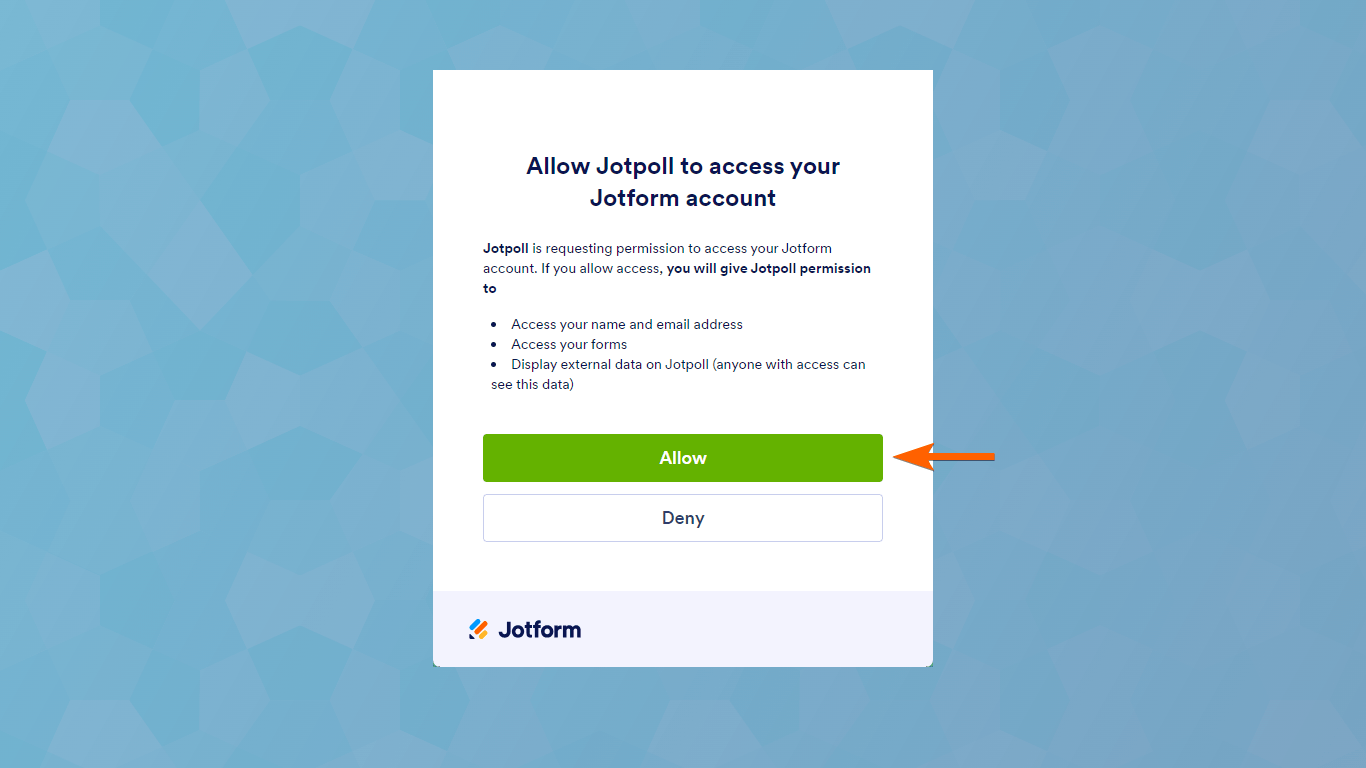
JotPoll is a tool that allows you to generate charts and analyze polls or surveys. It provides a user-friendly interface for creating and viewing poll results. JotPoll supports Single Choice, Dropdown, Star Rating, and Scale Rating form elements.

To use JotPoll
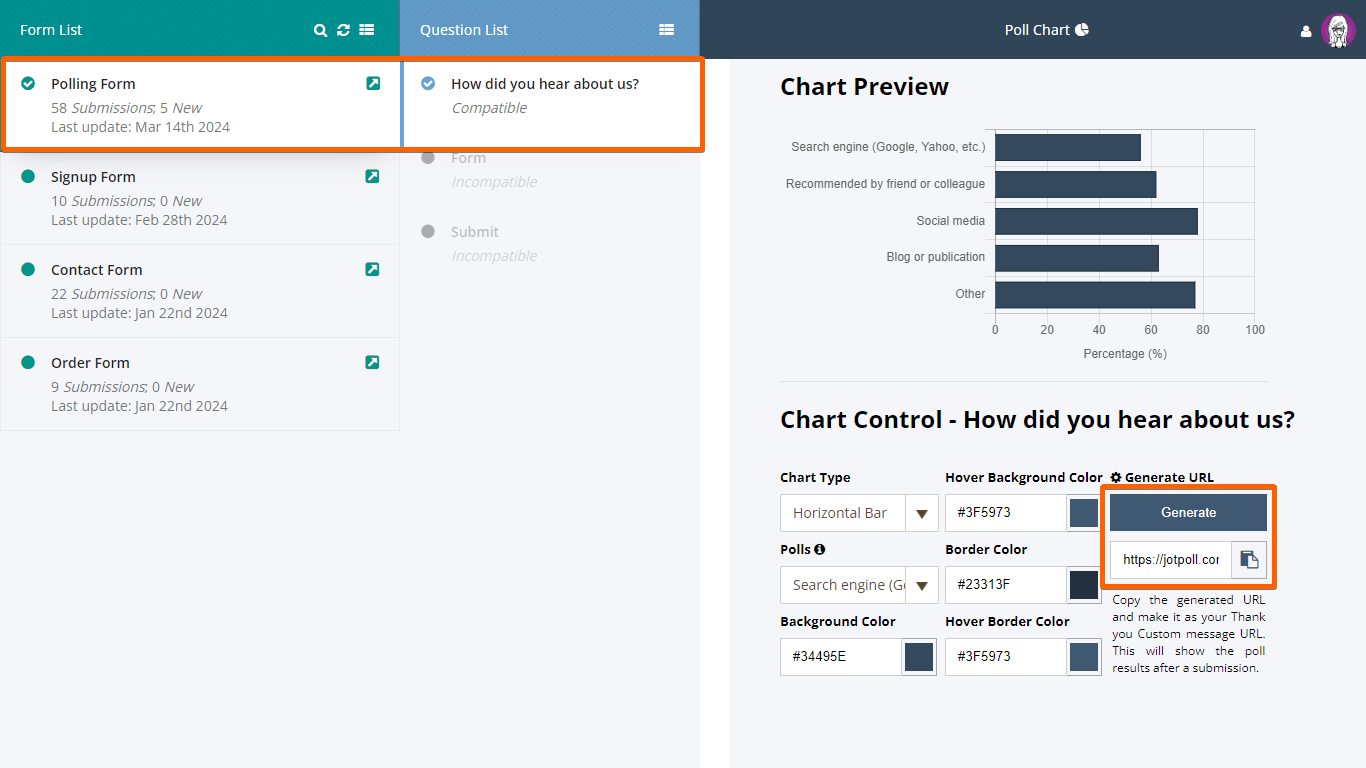
- Choose your polling form and question.
- Customize your chart if needed, then generate and copy the chart URL.
- To share the poll results, edit your polling form in the Form Builder.
- Go to Settings > Thank You Page.
- Add the chart link to your Thank You page. Or redirect your form fillers to the chart after submission.

Send Comment: