
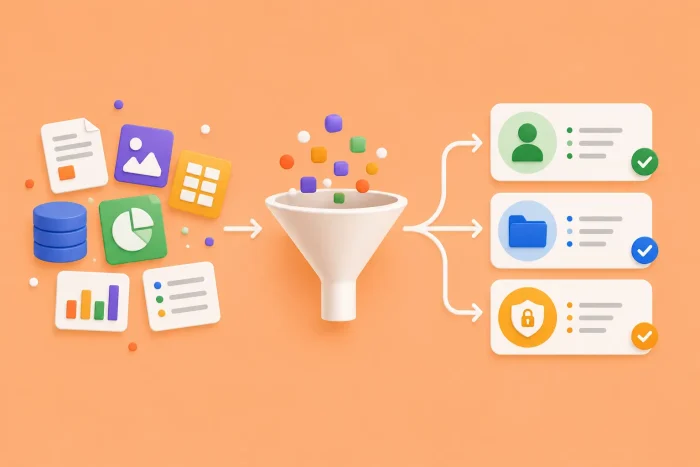
In today’s marketing landscape, there’s no shortage of data available to help you make informed business decisions — and there’s a long list of data-collection tools to make your intelligence gathering more streamlined and effective.
Collecting and analyzing customer data can help you create more effective marketing campaigns, improve customer retention, develop new products and services, and optimize your business in other ways.
But when it comes to putting the intel you’ve collected to good use, things can get a little complicated if you don’t apply good data classification and filtering principles. What if you want to look at only a subset of data — like maybe all sales over $500 from the first quarter or just responses from two-parent households with two children under the age of five?
Raw data isn’t that useful unless it’s categorized. Once you’ve developed categories, that’s where data filtering — selecting a smaller subset of the data you’ve collected to review and analyze it — comes in. You can filter data in a number of ways, including by a date, a question, a demographic, a location, and other parameters.
Once you’ve filtered your data, you’ll begin to notice key trends and patterns. These are the kinds of insights that will help you optimize business performance.
Let’s talk about a few ways you can filter data.
Common ways to use filters
One of the most common ways to use filters is by demographics, such as age and gender. For example, you might want to find out whether more men or women use your product and what age range they fall into. Once you know that, you can target your next marketing campaign or lead generation effort more effectively.
Filtering by date is another option. If you’re tracking the results of an event or other benchmark — say, a recent marketing campaign or company press release — you can run a continuous survey that tracks responses both before and after the event to gauge its impact.
If you’re interested in finding out how many of your respondents gave your product the highest ratings, you can filter by question to see only those answers.
Other data subsets you can use as filters include interest groups, product attributes, special requests, form submission dates, and form submission devices. Some tools also allow you to filter out those who fill out your survey too quickly — which can lead to bad data, respondents who don’t represent your desired audience, and incomplete survey responses.
An easy way to collect and filter data
Data collection, classification, filtering, and analysis are key to uncovering meaningful insights that can help you improve your business’s key performance indicators. After all, the best business decisions rely on good data, not wild guesses.
Jotform provides complementary tools for analyzing and presenting the information you collect. Jotform Report Builder includes data analysis features that let you classify and analyze responses with date and time filters. Applying a filter is as simple as clicking the Filter icon, selecting a form field, and adding the appropriate conditions.
Report Builder then transforms filtered data, such as customer feedback, survey responses, and poll answers, into polished reports for executives and other stakeholders. You can use charts, tables, and other visual elements to communicate your findings clearly.
Alongside Report Builder, Jotform AI Data Assistant provides a conversational way to organize, classify, and analyze submissions across Jotform Tables and Inbox. AI Columns can categorize open-ended responses, classify sentiment, translate text, or extract key information from each submission. You can then filter matching records, summarize results, calculate totals and averages, and uncover patterns or outliers using simple prompts.
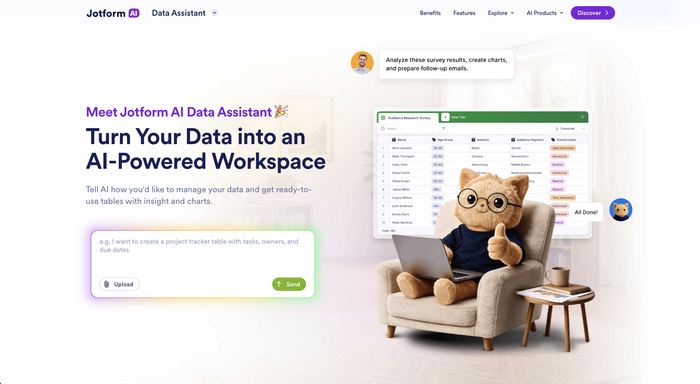
While Report Builder helps you present your findings, Data Assistant helps you prepare the underlying records and act on what you discover. It can generate charts or markdown tables, apply bulk updates or cleanup actions, and create follow-up emails without requiring you to leave Jotform. tables, apply bulk updates or cleanup actions, and create follow-up emails without leaving Jotform.
Photo by Filiberto Santillán on Unsplash
This article is aimed at marketers, analysts, and business professionals who want to turn raw data into actionable insights by learning how to properly classify and filter customer information for more effective decision-making, campaign planning, and performance tracking.





Send Comment: