


With Jotform Report Builder, you can easily create eye-catching visual reports from your submission data. It allows you to customize your report with text, images, bar graphs, pie charts, and data grids.
Creating a Visual Report in My Forms
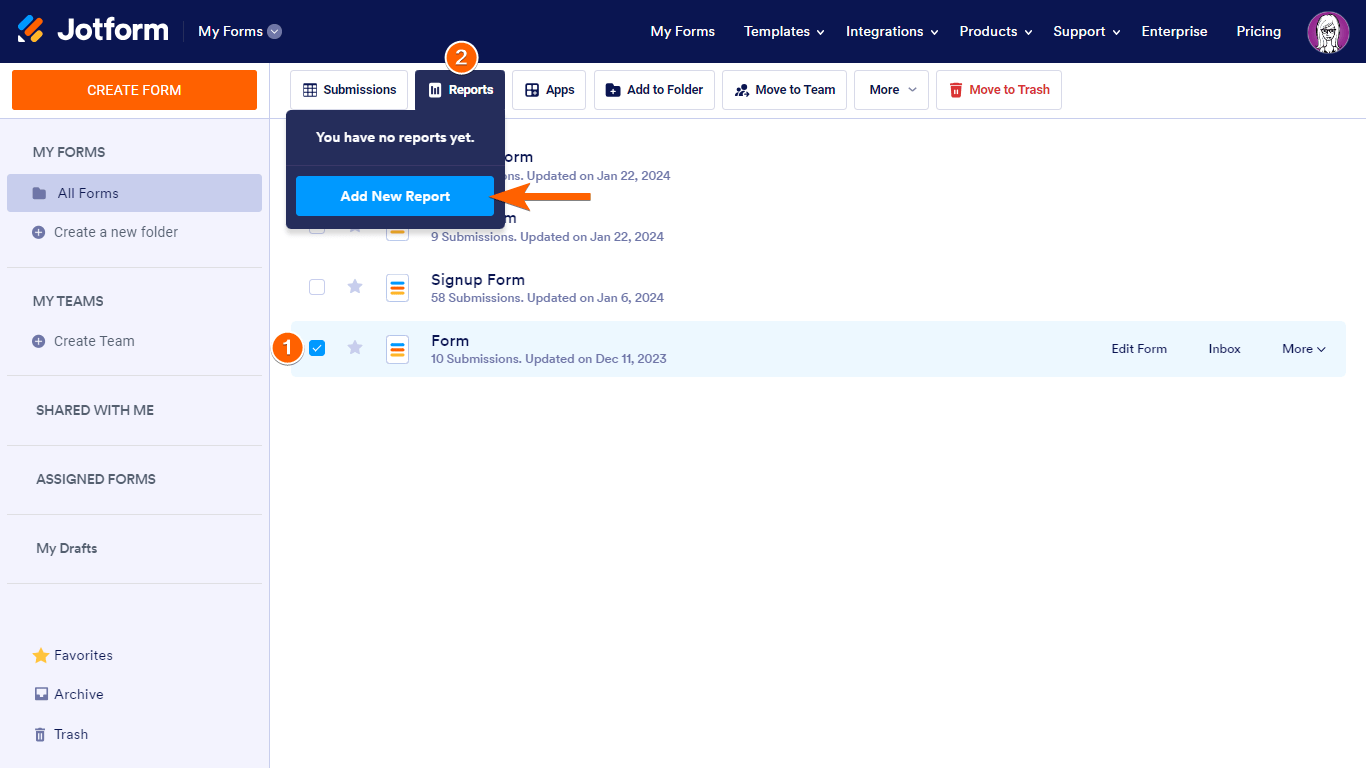
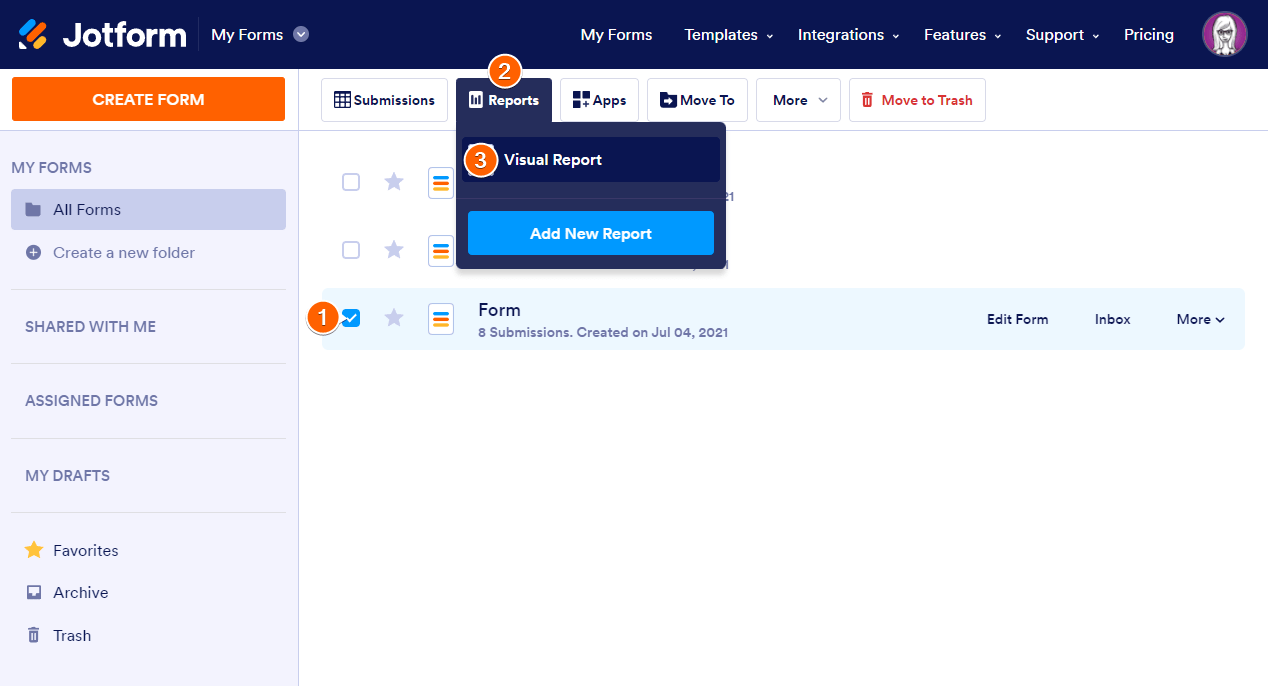
To create a visual report from the main dashboard
- Go to My Forms and choose a form.
- Open Reports at the top, then select Add New Report.
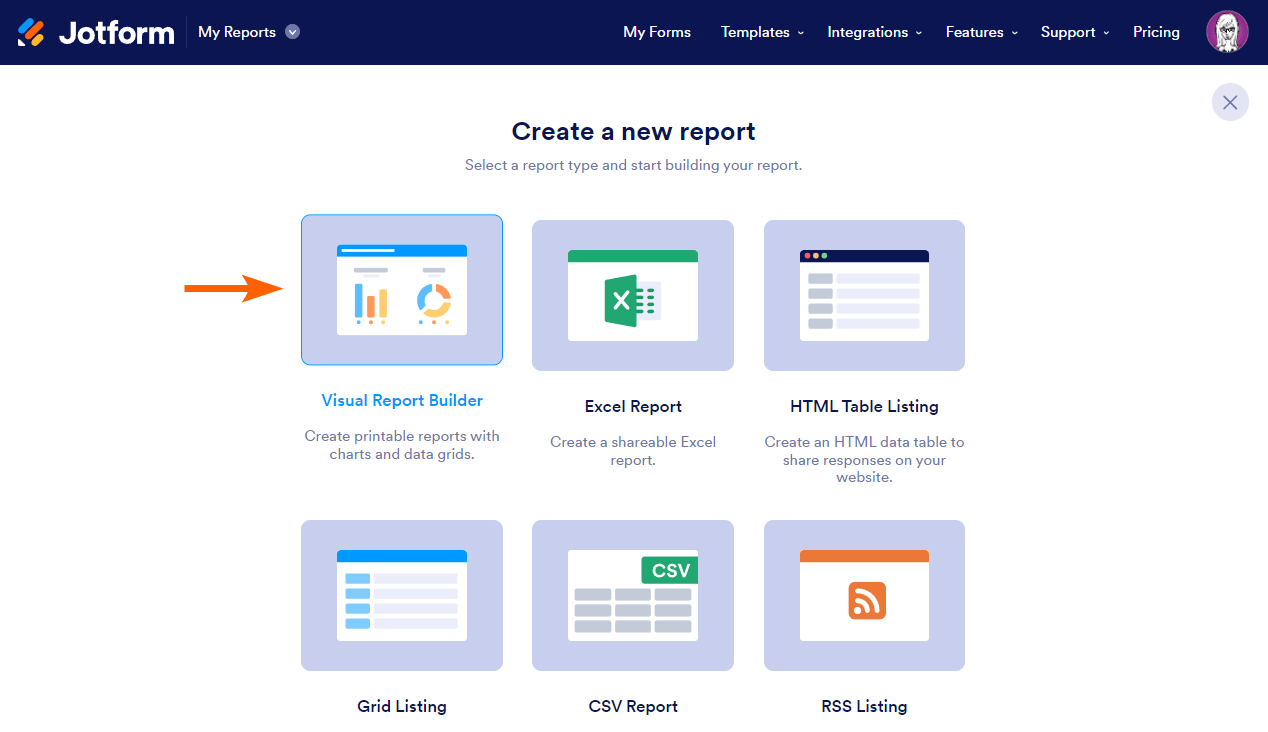
- Select Visual Report Builder.
- In the dialog, enter your desired report name.
- Choose a Report Type, then select Create at the bottom.
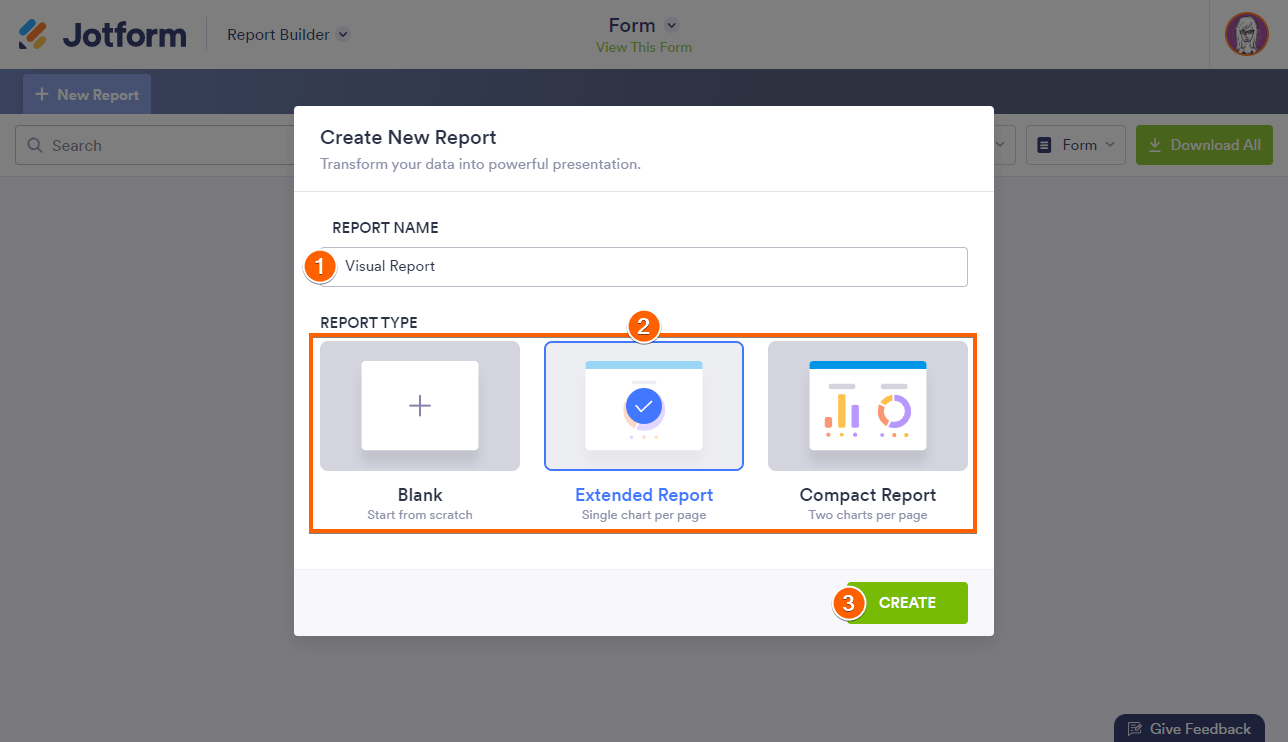
Here are the available report types:
- Blank — Start from scratch and add your charts manually.
- Extended Report — A single chart is shown per page.
- Compact Report — Two charts are shown per page.
For the Extended and the Compact report types, the Report Builder will automatically create a chart for supported form fields and widgets.
Creating a Visual Report in My Reports
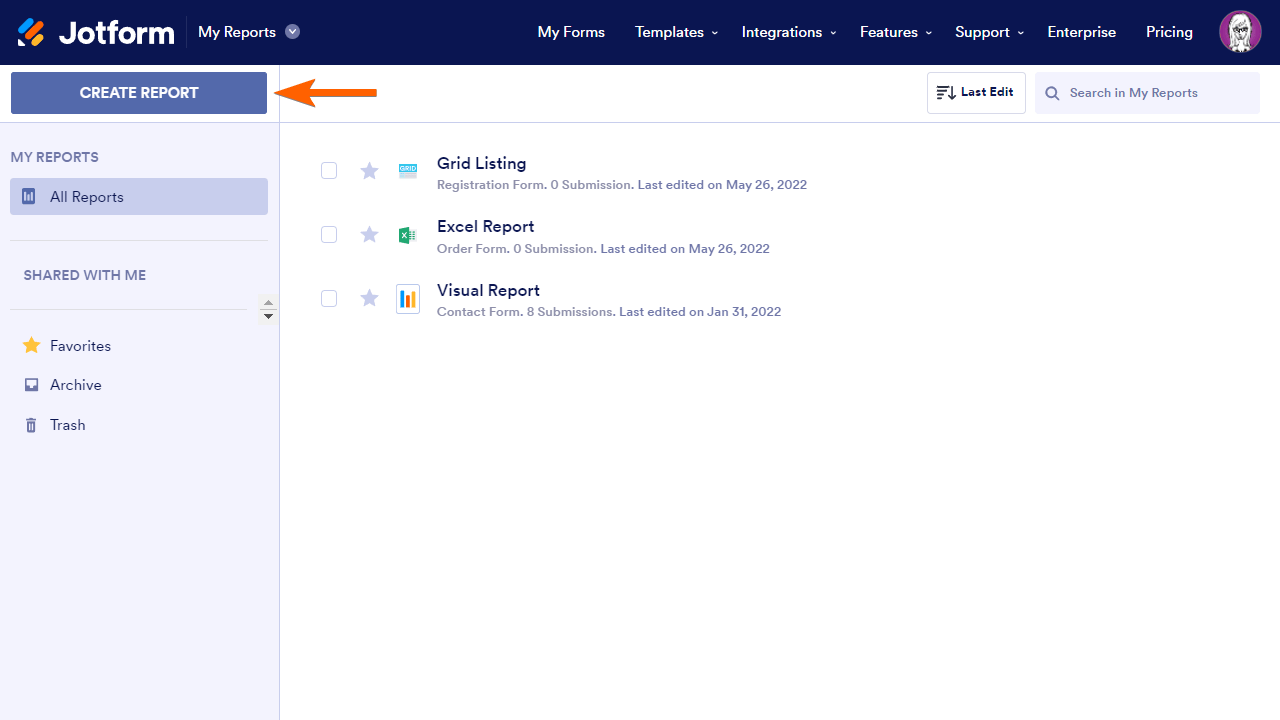
The My Reports page is where you can find and manage all your form reports.
To create a visual report
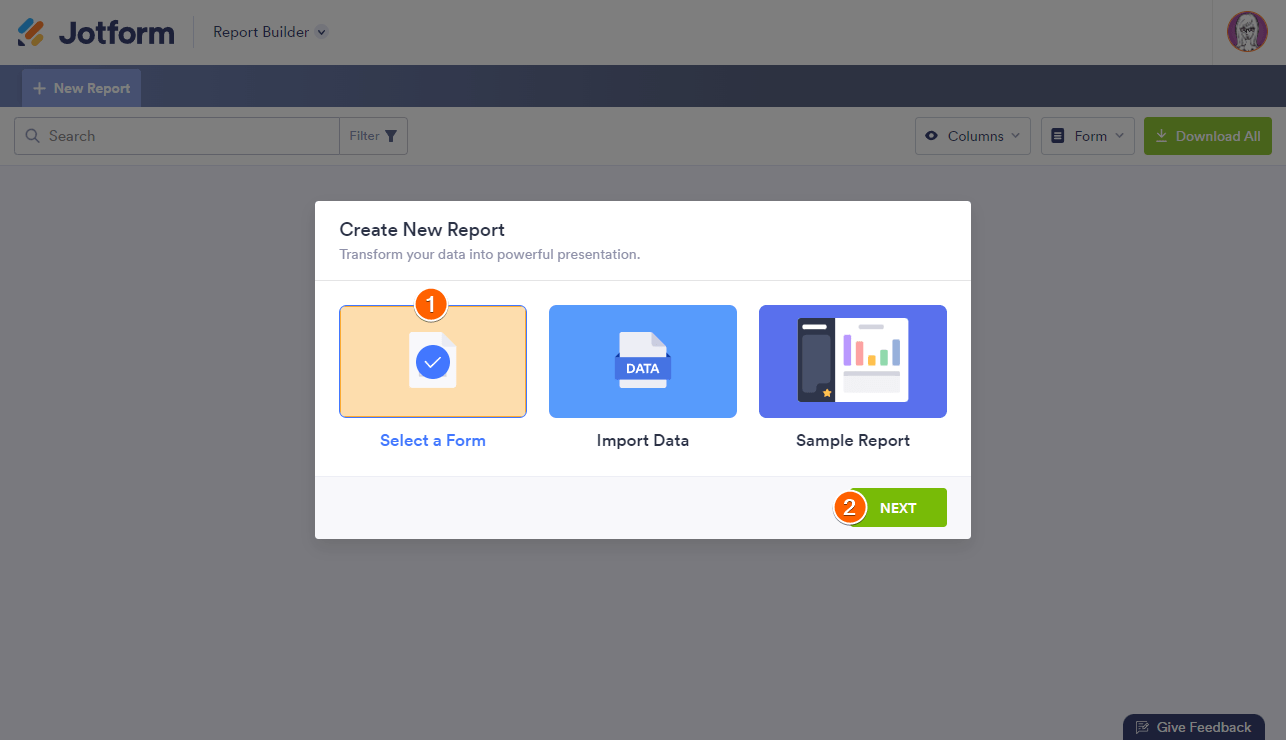
- Go to My Reports and select Create Report in the upper-left corner.
- Select Visual Report Builder.
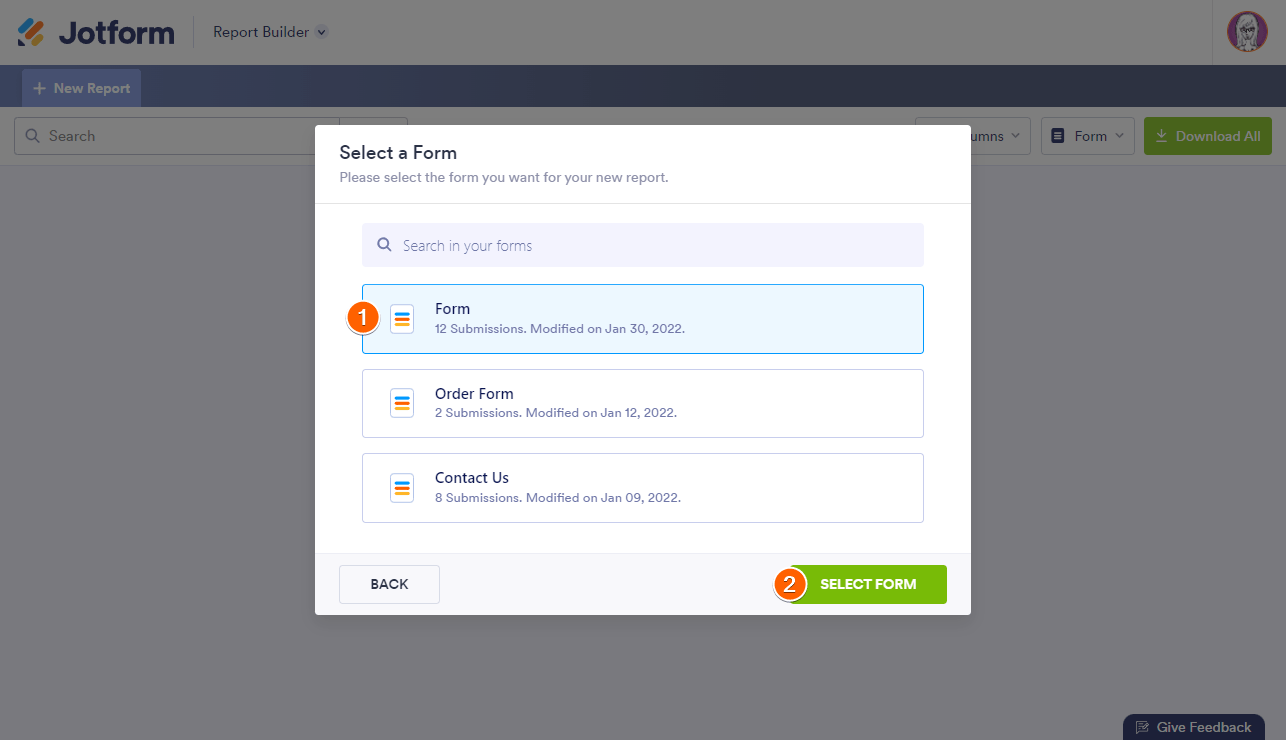
- In the dialog, click Select a Form.
- Choose a form, then click Select Form.
- Specify your desired report name and type, then select Create at the bottom.
Creating a Visual Report From the Form Builder
To create a visual report from the Form Builder
- Open the App Selector panel in the upper-left corner
- Select Report Builder.
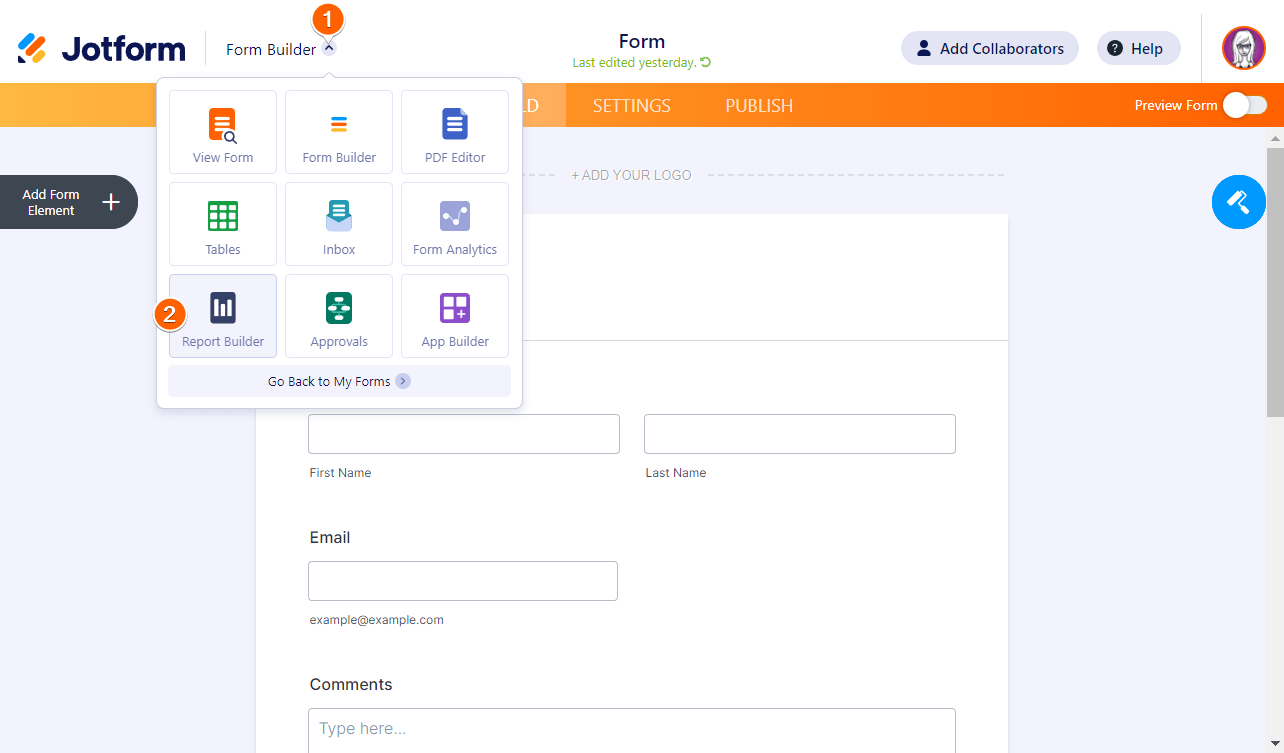
This creates a visual report for the active form.
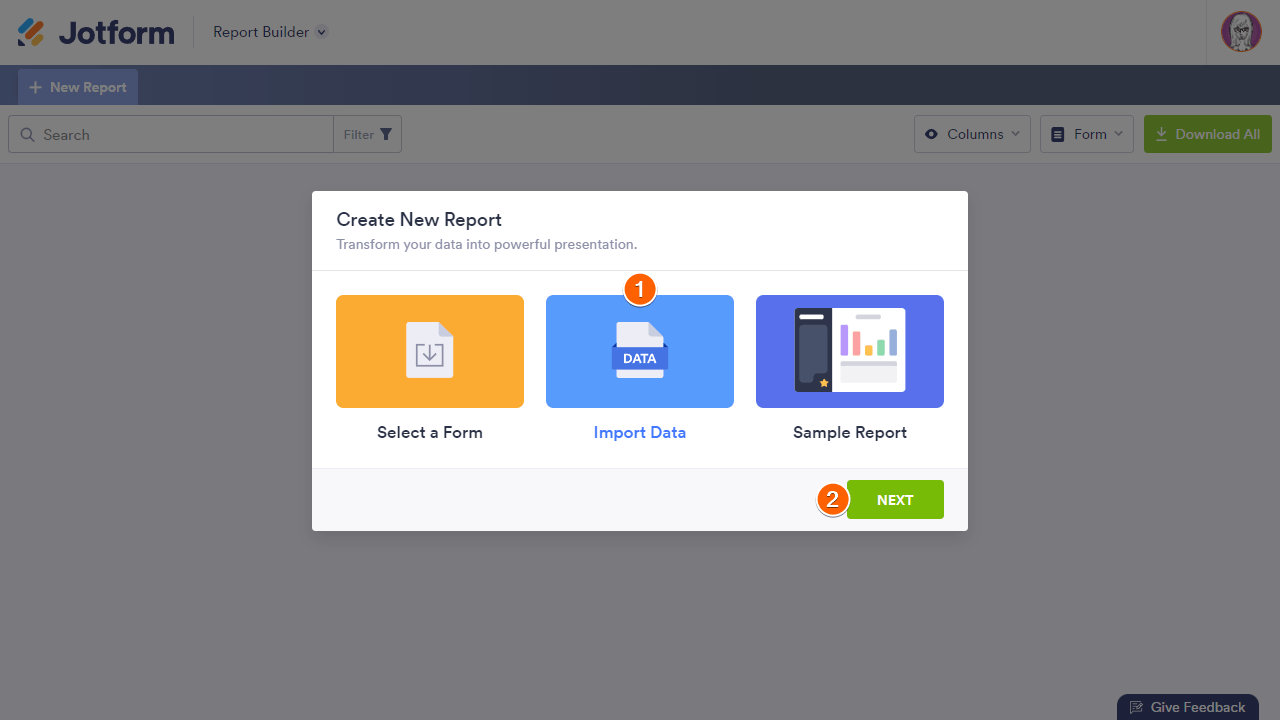
Creating a Report From Imported Data
You can import data for your visual report when creating a report from My Reports. For more information, see How to Import Your Excel or CSV File Data to Create a Visual Report.
Creating a Sample Report
There is an option to generate a sample report when you create a visual report from My Reports.
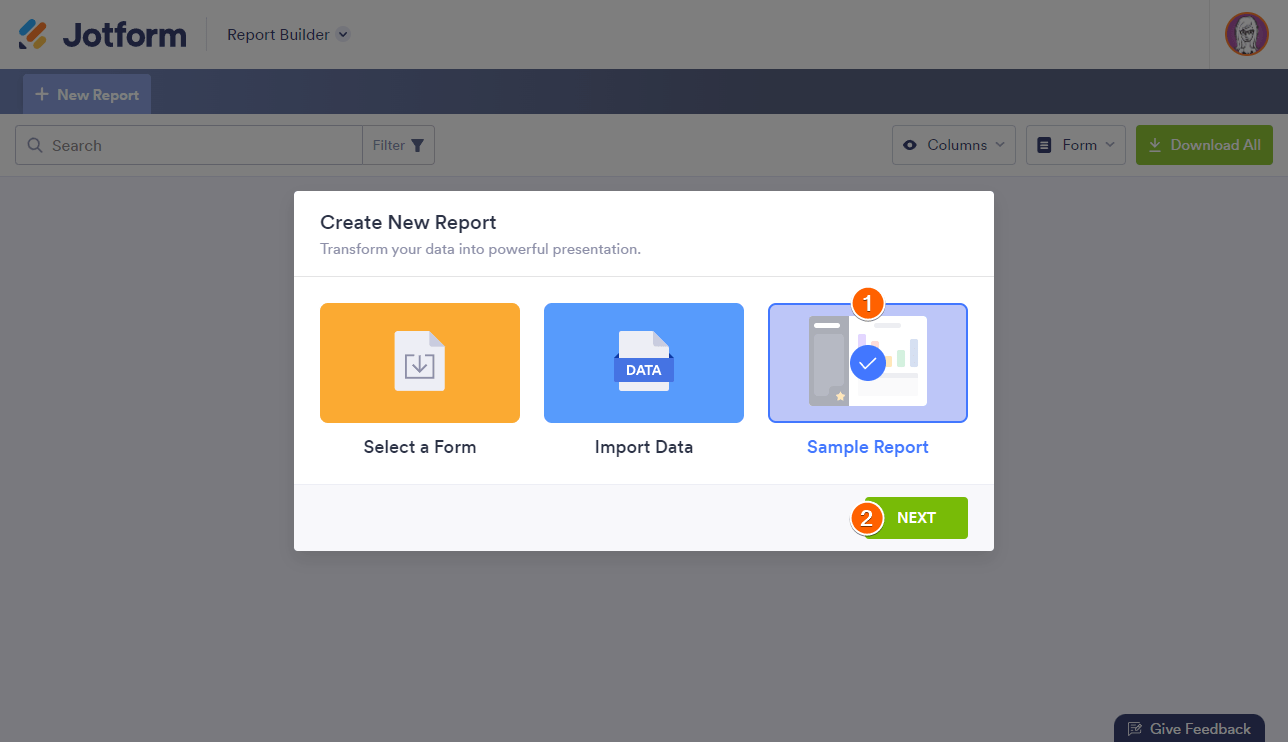
The Sample Report option allows you to select from various sample report templates.
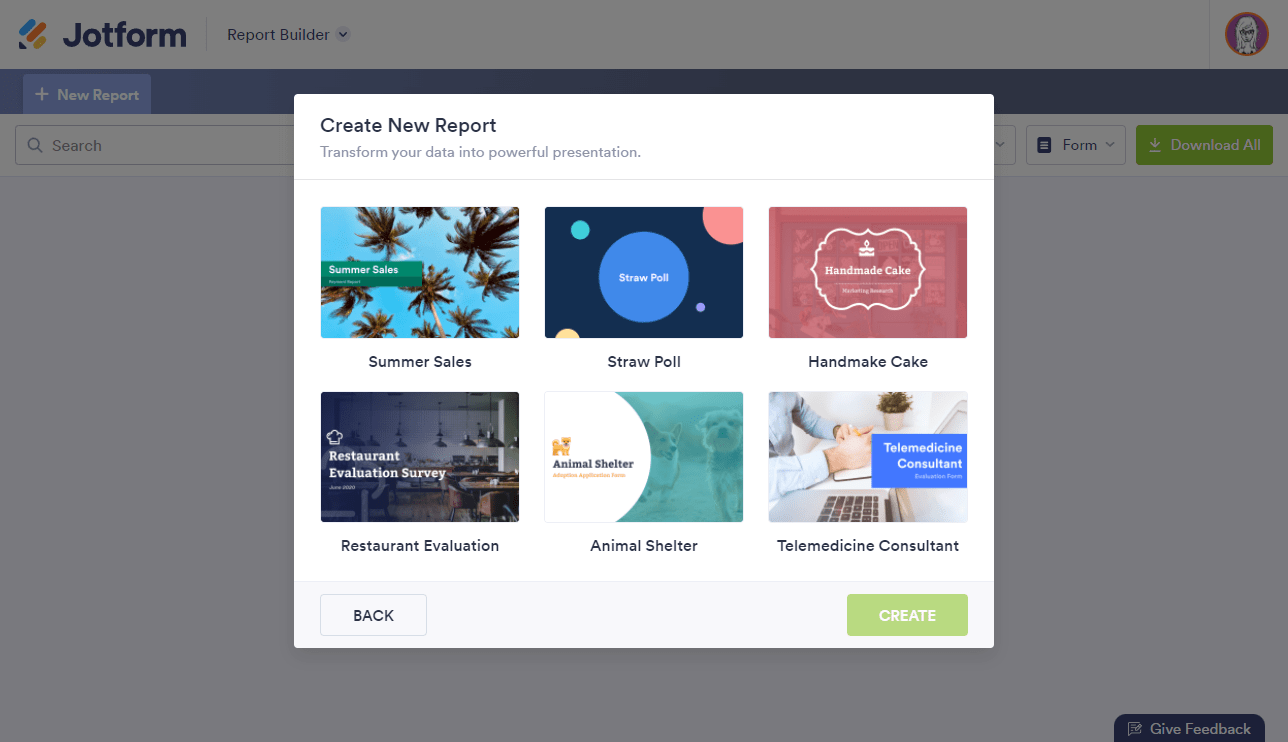
Selecting Create in the Create New Report dialog will open your chosen visual report template with sample submission data. The sample submissions on the report come from the form that is also created automatically. The sample submission data will not be counted toward your account limits. You can update both the report and the form created during this process.
What Are the Report Elements You Can Add to Your Report?
The Add Element button in the Report Builder opens the Add Elements panel for customizing your visual report.
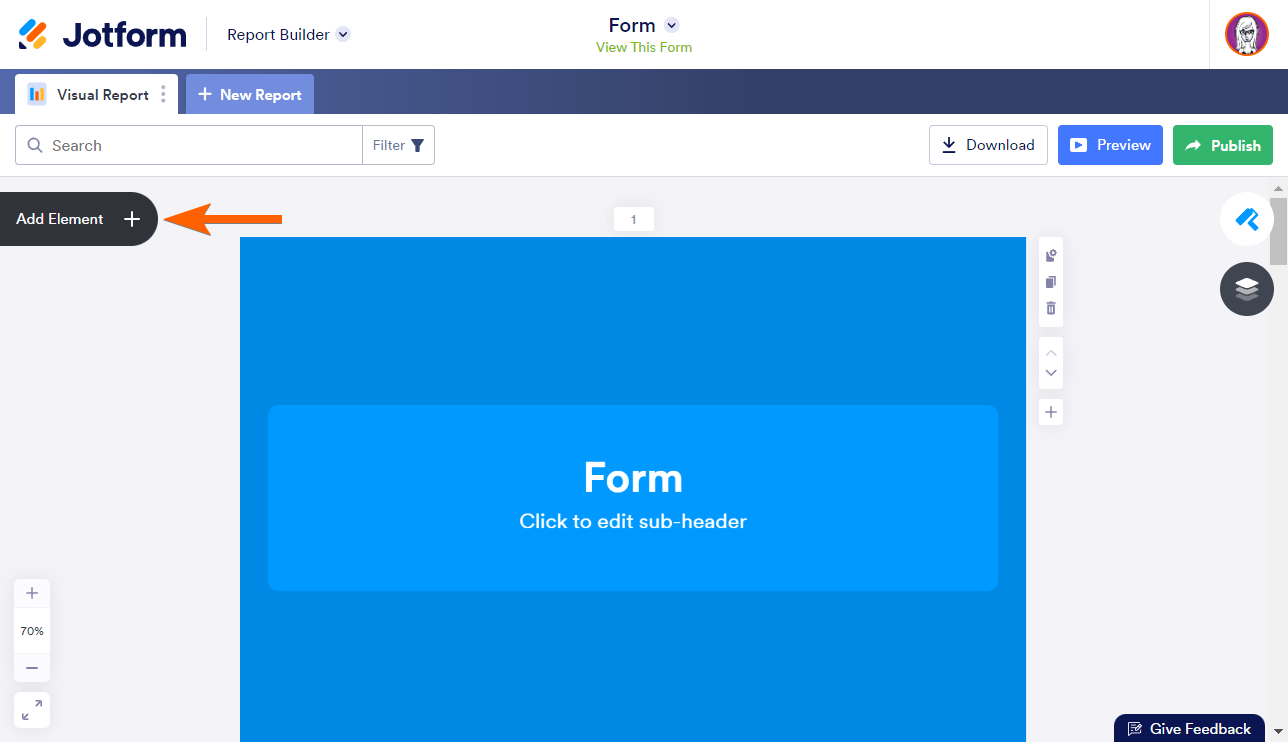
You can select the elements or move them from the Add Elements panel to add them to your report page.

Basic Elements
The Basic Elements tab contains common elements for customizing your visual report:
- Text — Display long paragraphs or hyperlinks.
- Header — Display heading text for titles.
- Image — Add your company logo or custom images.
- Shapes — Include shapes in your report.
- Icon — Include icons in your report.
- Grid — Display submission data in your report.
Form Fields
Supported form fields are listed in the Form Fields tab and are displayed as charts when added to the report. You can use the search bar to filter supported form fields.
Accessing Your Visual Reports
You can access all your form reports in My Reports. You can also open a specific form’s report in My Forms from the Reports menu.
Customizing Your Visual Report
The Report Builder is equipped with just the right tools that you can use to customize your visual report’s layout, pages, and elements. For more information, see How to Customize Your Visual Report.
Sharing Your Visual Report
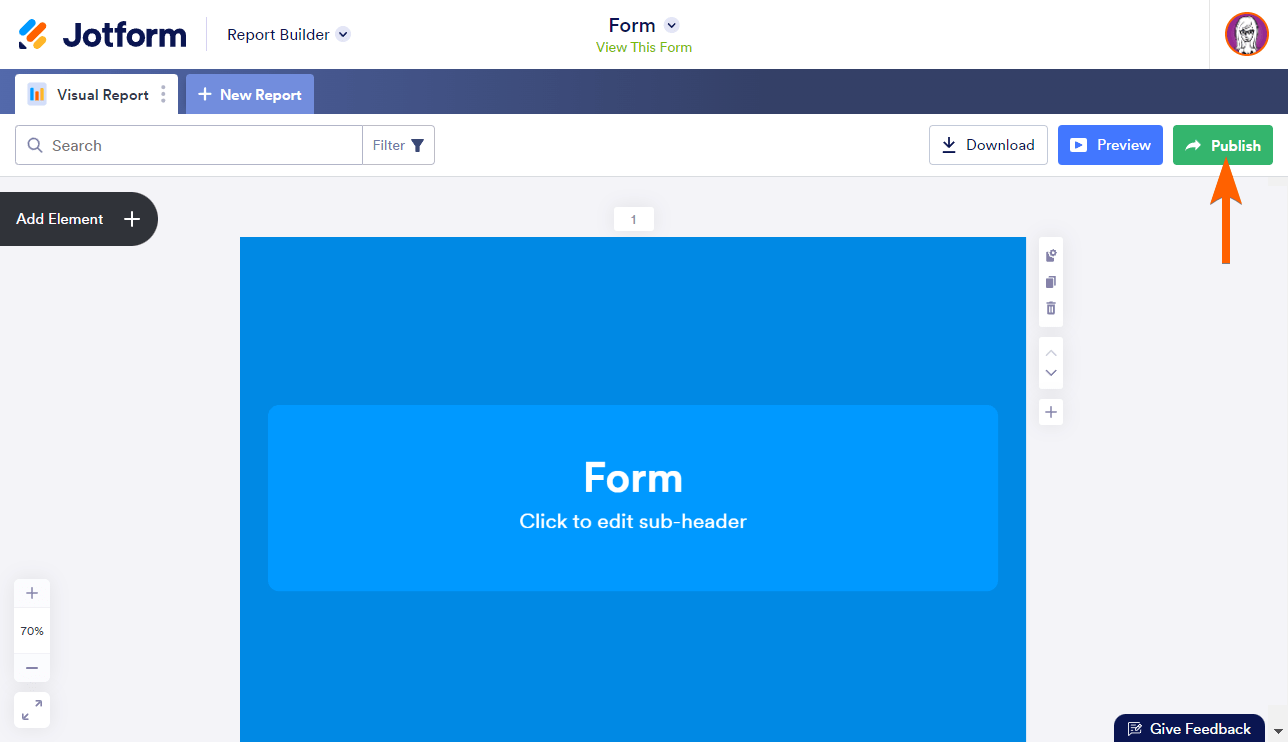
Once your visual report is complete, select Publish in the upper-right corner to share the report link or embed the report into your website.
To learn more, see How to Share the Visual Report.
Send Comment:
29 Comments:
69 days ago
I submitted my application 3 weeks ago until now i have no response
184 days ago
Maintenant il faut faire un compte avec vous plaît monsieur
202 days ago
I had sent my document 3weeks ago,but still have no any response
212 days ago
C'est meilleur
230 days ago
We were submited our application form but we don't get any message. Please send email please.
252 days ago
I cannot see a signed report I sent for signature. This is an urgent situation, please help ASAP
259 days ago
Unafanyaje huu kilipu
306 days ago
Cancel canpaingn I had
On your website please
Thank you!!
306 days ago
Make a video on it. Rgds Ra
318 days ago
Je suis Wolkendy Antoine j'ai besoin d'un sponsors, j'envoie mon document mais je n'ai pas encore reçu votre réponse
More than a year ago
thanks for this and the great app! Is it possible to generate a report based on each form submission that is then automatically sent to the submitting individual ?
More than a year ago
Superbly majestic!
More than a year ago
I was able to create different kinds of forms from what i learnt and it teachers me what it means to be alert
More than a year ago
Hello, thank you for the tips. I tried ways above, but it produced separate page of report. Is it possible to insert the graph in the report?
More than a year ago
How can I decode this knowledge incase am a beginner?
More than a year ago
Hi i am Justus Kyalo Mutua i sent my documents but i didn't get feedback thakyou
More than a year ago
Can I create a report using selected data? Ie I want a report that only shows the evaluation reports created in June (I would like to create monthly reports).
More than a year ago
Thanks you so much for sharing.
More than a year ago
Nice
More than a year ago
Hi, I will thanks u for all clear answers Ur are expected as
More than a year ago
Great! Thanks a lot for your support of the what I have challenged with about the elements of the good report
More than a year ago
The best
More than a year ago
all the best
More than a year ago
I added a built visual report in the jotform app by adding a link, after sending new formular answers the report will not update the data by himself. Is it possible that a report will update the incoming data automatically? How?
Thanks
Dominique
More than a year ago
i admire your aggressive awareness but you give me few time for work with you
More than a year ago
So l love the site
More than a year ago
Happy
More than a year ago
Thank you so much
More than a year ago
Form o need is the one n applicant can fill nd submit to my account