The impact Google has as a company is immeasurable. The tech giant has completely changed the way we communicate and access information.
The brand is so ingrained in culture that if you want to know the answer to something, someone will tell you to “Google it.” There aren’t very many companies that have risen to this level of recognition — let alone any that are considered both a noun and a verb.
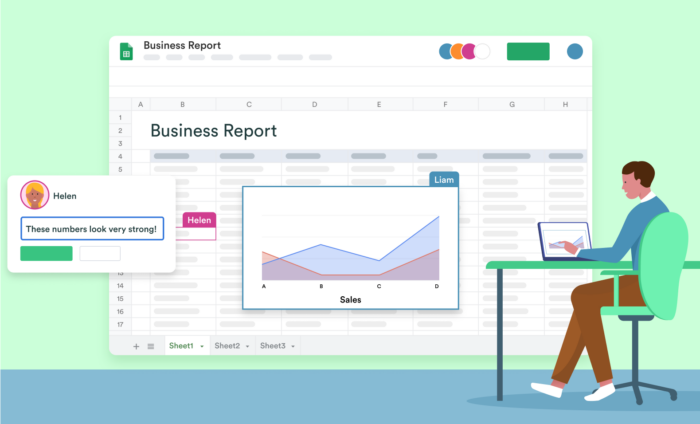
Google could have stopped there, but that’s not the type of company it is. It has maintained staying power by making it clear that it’s more than a search engine. There’s Google’s email service, Gmail. There’s Google Chat for instant messaging. And there’s Google’s word processor, Google Docs, which offers real-time writing and editing collaboration.
But where Google has significantly expanded its reach is in workflow management tools, particularly with Google Sheets. Understanding how to use Google Sheets means learning all you can accomplish within its interface.
Google Sheets takes the spreadsheet concept into the 21st century, connecting it straight to your Google account with a flexible interface that can be molded to your unique operation. Using Google Sheets will help streamline your workflow, giving you the ultimate space to host all of your data, communication, and business processes.
In this chapter, we’ll explore Google Docs, Google Sheets, and the ways Google can serve as a catalyst for mistake-free and efficient business operations.
Word processing with Google Docs
Google didn’t invent word processors, but it has certainly made its mark in the industry. Entirely based online, Google Docs allows users to create, share, and edit articles; project outlines; or whatever you might need across different teams.
That’s what separates it from something like Microsoft Word — because everything is cloud-based, sharing and collaborating is easier than it would be otherwise. Instead of saving the file to your computer and sending an email with your file attached, all you have to do to share a Google Doc is make a few clicks. You can even edit the sharing settings to specify whether the person you’re sending your document to has editing privileges.
Even better, your recipients don’t need a Google account to access and edit a Google Doc. You can track individual changes as a writer and make specific suggestions as an editor — and each of these actions is individually cataloged.
There’s no limit to how many people can work on a document at the same time, and each of your employees can look at the version history to see how the document has taken shape.
All you need is an internet connection; Google Docs takes care of the rest — automatically saving each revision, storing documents in your Google Drive, and providing a clean interface to understand the evolution of your document from start to finish.
An online spreadsheet
Much in the same way you can collaborate and store documents online with Google Docs, you can do the same with Google Sheets. Before Google Sheets, the idea of a cloud-based spreadsheet was novel. But in 2012, Google launched its spreadsheet software, and everything changed.
The ability to create a spreadsheet online — and pair it with Google’s suite of products, from Gmail to Google Forms — makes Google Sheets a multidimensional tool valuable for businesses of all sizes. You can switch from desktop to mobile mode without losing functionality. Plus, it’s easy to use — if you’re familiar with Microsoft Excel, you’ll have no trouble learning Google Sheets.
Since it exists entirely online, any changes you make will be automatically saved. You’ll have the same collaboration features as you do with Google Docs, making data entry and analysis a breeze.
On top of that, Google Sheets has tons of different add-ons, including an API integration that lets you filter your entries and shape your data the way you need it. You can also create pivot tables to break down specific data points within your spreadsheet. There’s even formula editing to conduct data calculations, as well as embed capabilities to share your findings far and wide on your website.
Google Sheets — and its evolution over the past several years — has made a giant impact on spreadsheet software and expanded the limits of what it can be.
The influence of Google Sheets
Given how popular Google Sheets has become and how far it’s spread, it was inevitable that other companies would throw their hat into the spreadsheet ring. And there are some good alternatives out there that serve as worthy competitors to Google Sheets. Let’s explore some of the best spreadsheet software:
- Quip. This combination software brings together documents, team communication, and spreadsheets. It’s now under the umbrella of Salesforce, so you can pair all of its capabilities, too. You can switch between document and spreadsheet view as you work and create charts and graphs for a visual representation of your data.
- Zoho Sheets. Cloud-based software Zoho Sheets has a bit more functionality compared to Google Sheets, with 350 available operational processes to choose from. Pivot tables and conditional formatting are included. You can also import data from outside sources. Zoho Sheets is an international platform, supporting 23 different languages.
- Apple Numbers. When you’re considering the best spreadsheet software, emphasize interconnectivity. Apple Numbers certainly falls into that category, with the ability to sync your spreadsheet across your Apple devices. While its features might be limited compared to other spreadsheet software, it’s very simple to learn and has an intuitive navigation display. There’s also a table function to arrange data to your liking.
- Smartsheet. Perhaps more than any other of the best spreadsheet software tools, Smartsheet is made for project management. You can create timeline and Gantt chart views to personalize your workflow and keep track of your progress and your team’s progress. Plus, Smartsheet integrates with a lot of different outside tools, including Google Suite, Slack, and Dropbox, to name a few.
- Airtable. Consider Airtable as an evolved Google Sheets. It’s designed as a one-stop productivity shop, featuring a built-in project tracker, product planning tools, content calendars, formula creation, and collaboration capabilities. Airtable is great for juggling a lot of projects at once, and it’s especially helpful for larger businesses that need to manage different moving parts across teams. Plus, with so many templates, you can customize your workflow to fit what you’re trying to accomplish.
The best of both worlds
Though spreadsheet software has advantages, your organization might need a more elastic platform. Thankfully, there’s software that combines the best of a spreadsheet and a database. Here’s the best when it comes to spreadsheet-database software:
- Jotform Tables. Jotform Tables is Jotform at its best. Pulling from everything that makes Jotform great — its templates, shareability, and collaborative features — this software has top-notch spreadsheet-database functionality. You can connect a form to create new tables or import data, perform calculations and formulate analyses based on that data, and easily generate reports to share with clients and your teams. Jotform Tables puts data collection and organization back in your hands, serving as a trusty assistant through every step of your workflow process.
- Notion. If you want a platform that works as well for individual members of your team as it does for team-wide collaboration, Notion is the spreadsheet-database software for you. A top-notch project management platform in its own right, Notion helps you stay organized with the ability to shape your tables in many different ways. You can add images, attach widgets, and connect each of your tables to one of your Notion templates internally.
- Microsoft Lists. While Microsoft has long been a leader in spreadsheet building, it knew it had to keep up with the way the technology has evolved. Its solution came with the creation of Microsoft Lists, which is best used along with the host of Microsoft Office 365 Professional products. Microsoft Lists is essentially a supercharged version of Excel, giving you the power of the spreadsheet software along with added information tracking and different list views for project management and collaboration.
- Coda. Coda is built around document creation. It has a lot of different integrations and is a bit more flexible when it comes to how you can format the tables you create. Big-name companies like The New York Times and Square have used Coda to establish an all-in-one location for project sharing and storage. Coda also offers different ways to view your documents, so you’ll have customization options as well.
- ClickUp. ClickUp does a little bit of everything. This spreadsheet-database software allows you to create to-do lists, documents, and time management strategies, as well as set and track goals. And that’s just the beginning. Just like other great spreadsheet-database hybrid tools, you can toggle through dashboards to ensure you’re organized and have easy access to your information. The platform emphasizes list-making, and you can arrange different unique views to see the specific tasks you have left to complete.
Whatever you need, on-demand
Google Sheets provided the seed from which all other spreadsheet software has grown. There would be no spreadsheet-database hybrids without Google’s innovative and forward-thinking spreadsheet software.
You can use Google Sheets for project tracking, building out a budget, keeping a list of applicants for a new position — whatever data your business collects or whatever information it takes in, Google Sheets is the place to store it.
The software has automation capabilities, and it’s a great and easy-to-use tool for collaboration, issue tracking, and communicating with your teams. Because Google has such a wide range of product offerings, you can connect other workflow processes with Google Sheets to seamlessly integrate your data and projects.
However, if you’re a longtime user of Microsoft Excel, the prospect of switching platforms and learning new software can be understandably scary. If you want to ensure you have a complete understanding of how Excel compares to Google Sheets, read the next section, where we’ll compare and contrast the two and examine how Google Sheets expands upon what Excel can do.
Google Sheets basics
Evolution is a natural part of life. Change can be a good thing — and in business, when the pressure is on to stay relevant and successful, evolving means staying current and adjusting to what the market demands.
When it launched, Google Sheets positioned itself as the latest and greatest version of what Microsoft Excel started, taking the best of what that product does and expanding on it. It would be easy to classify Google Sheets as the “internet spreadsheet software.” And though it shares similarities with Excel, its functionality and what it can be used for are where it differs.
In this section, we’ll walk through an Excel tutorial, compare and contrast Microsoft’s spreadsheet software with Google’s, and learn how to maximize the features of both to maintain an efficient and successful business.
The foundations of Excel
Our Microsoft Excel tutorial starts by examining exactly what it’s used for. The applications reach far and wide across many different industries.
A shipping company can use Excel to track its daily, weekly, and monthly packages. A bank can use it to keep internal records of its transactions as well as its customers. And marketers can track leads, product strategy, and project assignments, as well as break down individual sales data.
What’s more, Excel enables businesses to perform complicated mathematical calculations by creating formulas based on the type of information they’re examining. There’s also the ability to create growth charts and forecast future earnings.
Learning how to use the software puts the power of the spreadsheet in your hands. Every Excel spreadsheet starts as a blank canvas for a business to paint on.
It’s important to know which spreadsheet software is right for you: Google Sheets? Excel? Let’s detail each and go deeper into the different parts of the software and how they work together.
Google Sheets vs Excel
It’s fair to say that there is no Google Sheets without Excel, so to examine the similarities and differences between the two, let’s look at the actions you can perform with both, where they’re lacking, and where they diverge.
Collaboration
- Google Sheets. You could argue that the ease of collaboration in Google Sheets is its best feature. At any given time, your team members can view and make suggestions to a Google Sheet. Each user is clearly defined, and Google Sheets tracks which user made a particular change — keeping everyone organized and accountable. There’s also total control over who has editing and sharing permissions on a document, so if you deal with sensitive information, you can make sure only those with the proper credentials have access.
- Microsoft Excel. One of the biggest differences when it comes to Google Sheets vs Excel is collaboration capability. On the desktop version of Excel, only one person at a time can access the document. That’s because it’s not cloud-based software like Google Sheets. And while Microsoft has made some adjustments by adding collaboration functionality to its online suite, if you’re using the desktop application, working in real time with your team isn’t possible.
Sharing work
- Google Sheets. The ability to collaborate and share documents in Google Sheets go hand in hand. Because the software is cloud-based, every spreadsheet exists online. This makes sharing work as easy as pushing a button. Google’s suite is set up so that each of its platforms connects with the other. Just click Share to send a document to a team member’s Gmail address.
- Microsoft Excel. There’s a small difference in sharing spreadsheets using Excel, but it’s a noticeable one. If you’re operating off the desktop version of Excel, to share a document, you must attach it to an email in a different application. This makes tracking the document history and keeping a paper trail more complicated than it is with Google Sheets.
Because Google Sheets includes built-in collaboration features, any email message sent within Gmail contains the changes made and who made them. Excel doesn’t have this functionality without pairing it with online Microsoft software, which means keeping up with which user made a specific change could get messy.
Saving documents
- Google Sheets. Google Sheets has an autosave feature that can keep you from losing all the work you’ve done. Everything is backed up on Google Drive, keeping a clear record of each sheet along with the ability to organize each into folders and subfolders. Google Sheets also has a mobile app, so accessing a document on the go within the cloud is as simple as pushing a button.
- Microsoft Excel. In Excel, the only way to access the same type of cloud functionality as Google Sheets is through a subscription. This means cataloging and finding files quickly might take a bit more work. If a business does splurge for a supercharged Microsoft subscription, Excel has a OneDrive online database for documents. But Google Sheets has the clear advantage in this category with its free document storage and tracking.
Charts and graphs
- Google Sheets. Google Sheets is limited in the types and overall quality of the charts it can produce. Simply put, Excel has better built-in chart applications than Google Sheets. While Google Sheets is great for data entry and project tracking, the number of charts it can host and the automation within falls short compared to Excel.
- Microsoft Excel. In comparing Google Sheets vs Excel, Excel has the clear edge in creating data models and graphs. You can design and create more of them than with Sheets, allowing for better data analysis and charting. Excel will also recommend different charts based on the type of data you’re inputting, so you won’t have to spend as much time thinking about how to best model your data. Even better, Excel can combine two charts, providing a plethora of options for arranging and plotting data.
Data analysis
- Google Sheets. Because of the limited charting capabilities in Google Sheets, you might have to do more manual work to shape your data the way you need it. From a numbers standpoint, Google Sheets offers a maximum of 1,000 rows, so a business that regularly deals with a lot of data might find it restrictive.
Adding new rows is also a manual process, so the workflow for this type of data processing might be slower than what you’re looking for. This lack of processing power is something to keep in mind when choosing software — the last thing you want is to be halfway through a hefty project on Google Sheets and realize it doesn’t have the capacity you need.
- Microsoft Excel. Excel’s advanced charting capabilities make it easier to draw quick conclusions and make better decisions than with Google Sheets. And while Google Sheets has pivot table capabilities — a summary further breaking down data — there’s just more built into Excel.
The spreadsheet software was created to host large amounts of data and has advanced abilities to organize and condense that data. You can create charts for data sets, stack one product’s sales against another, and find common ground within. Excel has long been the leader in this type of data analysis, and it remains the standard by which all other spreadsheet software is judged.
Google Sheets 101
After examining the intricacies of Google Sheets vs Microsoft Excel, you have a choice to make. If that choice is Google Sheets, it’s important to understand the features and operations within Google Sheets that will help you get the most out of the software.
How to create a Google Sheet
Creating a Google Sheet is pretty simple. Make sure you’ve set up a Google account first so you’ll have access to Google’s cloud connectivity. After that, there are a few options to get started:
- Access Google Drive, click New on the dashboard, and select Google Sheets.
- Launch Google Sheets, click File, and select New and then Spreadsheet from the dropdown menu.
- Select a template from the Google Sheets homepage.
Now you can start inputting data and personalizing your spreadsheet. You can also add new sheets within your master spreadsheet to separate different categories.
Google Sheets are defined by individual cells — this is the space where a single data entry lives. Each entry is entered into a row and a column, so make sure you’re only entering a single data point in each. If that sounds too time-consuming, you can copy and paste data into a sheet from an outside source — or even better, import data in from an outside file.
How to convert an Excel file to Google Sheets
Though Google Sheets and Microsoft Excel are seen as competitors, there is some compatibility when it comes to importing data from one to the other. If you want to convert Excel to Google Sheets, you can do so with a few quick clicks. Upload your Excel file to your Google Drive. Once it’s in your browser, you’ll have the option to select Save as Google Sheets.
This creates a newly converted file, along with the original. You can also adjust the settings within Google Sheets to streamline the process each time you upload any Microsoft files to Google. Even better, this functionality extends to spreadsheet-database hybrid tools like Jotform Tables where Excel files, along with other file types, can easily be imported into the platform.
Operating within Google Sheets
It’s important to understand how to work within Google Sheets and how to perform its basic functions.
Dropdown menus
Google Sheets gives you the ability to create dropdown lists to input data based on set criteria. You can create lists from a range of values in certain cells or an assortment of numbers or text.
The main reason to do this is to ensure the data you collect arrives exactly as you want it to. Plus, it moves the process along for users who, for example, answer a survey or are asked to rate an experience numerically. This guide from Google gets further into the technical specifics.
Locking cells and freezing rows
Learning how to lock cells in Google Sheets is a way to isolate them from the rest of the sheet. All you have to do is highlight the range of cells you want to protect and change the editing privileges based on what you’re trying to do.
You can also freeze single or multiple rows to separate different numerical values or create a data group for analysis. There are lots of different ways to complete this action within the Sheets interface.
Sort and alphabetize your data
It helps to arrange the data you enter into Google Sheets. This can mean recategorizing a client list based on the state clients live in, alphabetizing last names, or sorting clients by the amount of business they’ve contributed, to name a few examples.
When it comes to sorting in Google Sheets, all you have to do is choose the column you want to sort, select the Data tab in the Google Sheets menu, and click the Sort range option. Customization takes over from there, allowing you to sort columns however you need.
Wrap text within a cell
Another valuable function Google Sheets offers is the ability to wrap text within a cell. There are a few different ways to do this. This guide is a good place to start. It only takes a few clicks within the Format tab.
Wrapping text in Google Sheets is especially helpful when cells include a list, because you can see each item without having to click on them individually.
Hiding columns
Learning how to hide columns in Google Sheets is worthwhile if a business traffics in sensitive information.
There might be an instance where a company works within a Google Sheet but only wants certain employees to see certain aspects of that sheet. That’s where hiding columns is beneficial.
This is a simple one-click maneuver — and you can choose to hide a single column or multiple columns. This doesn’t mean they’ll stay hidden permanently, so if you change your mind or make a mistake, this setting can be toggled on and off.
The world on a string
With Google Sheets, there are many functions to take advantage of. Excel’s fingerprints are all over Google Sheets, but the software has differentiated its offerings and the ways a business can use its workflow processes to accomplish its goals.
Now that we’ve examined Excel and Google Sheets, we’re going to explore how to go even further into Google Sheets’s data analysis and table creation capabilities.
Formatting with Google Sheets
Businesses collect many different kinds of data. For example, there’s data to learn more about customers, examine where money is spent, and even what users like about a company. But in any data-gathering enterprise, there has to be a reason for collecting information and a way to store and analyze it all.
Google Sheets can shift, shape, and store data in many different ways to help businesses draw clear conclusions about the state of their affairs and where they’re headed.
How to arrange data
It’s important to understand how to operate within these functions, so we’ll break down the different ways you can view and present data and how Google Sheets works as a data processing companion.
Conditional formatting
One of the most widely used ways to arrange data in Google Sheets involves conditional formatting. Conditional formatting revolves around automating font colors, bolding data points, and creating custom settings based on the data you collect. Conditional formatting is often associated with large or complicated data sets.
If you have a lot of data to sift through, the margin for error grows. And if you’re specifically looking at data to determine patterns, you’ll need organizational tactics to ensure you don’t miss anything.
That’s how best to use conditional formatting. We’ll get more into conditional formatting later on, but it’s important to be aware of what it is before we go too far.
Pivot tables
Pivot tables are a close cousin to conditional formatting in that both isolate data to draw larger conclusions. Creating a Google Sheets pivot table means shifting your data within its rows and columns to home in on a specific pattern or data set with more clarity.
Pivot tables take less time to put together and are easier to work with than a complex mathematical formula. But if you don’t know how to put them together, you won’t be able to realize their benefits. Here’s how to create a pivot table in Google Sheets:
- Within your Google Sheet, select all the cells in your spreadsheet, and click the Data dropdown menu.
- Select Pivot table when prompted. You’ll be asked if you want your table to populate in a new sheet or within an existing one. From there, click Create.
After creating a pivot table, there are a few options to choose from regardless of whether it’s in a new or a current sheet. Google Sheets is nothing if not a smart software, and it will offer suggestions for different table templates within its pivot table editor. From there, it’s up to you to decide how to arrange your data.
Finding specific values within a Google Sheet
For businesses looking to level up the way they navigate data within a Google Sheet, the VLOOKUP feature is the way to go. The “V” stands for vertical — the feature is designed to search for a value from the first column of a data range and find its match from the same row, a column to the right, or from a different sheet.
Because this feature is precise, when it comes to performing a VLOOKUP in Google Sheets, you need to have some coding knowledge regarding the entries you’ll place in the Google Sheets search bar.
The search pathway is “search_key”, which designates the value VLOOKUP discovers. These entries don’t have to be case sensitive, and you can get specific with the type of data you’re looking for depending on the search you conduct.
It’s worth noting that Jotform Tables, Jotform’s entry in the spreadsheet-database hybrid space, also has a VLOOKUP feature that works similarly to Google Sheets. It searches for data in a column that’s part of a separate table.
Jotform Tables also has a chart summary feature that will suggest a chart based on the type of data you’ve supplied. And if you want to change this suggestion, you can toggle between different chart options until your data is presented in a way that makes sense.
Visual data representation
Because a business produces unique data based on its processes and strategies, the graphs it generates to present this data will be specific to its needs. There are a few different options for displaying data visually in Google Sheets — let’s break them down.
Pie charts
Before learning how to make a pie chart in Google Sheets, you should know about its applications. A pie chart shows the different pieces of a data sample. If you’re conducting user research, you might use a pie chart to display the percentages of different responses or the demographic makeup of those sampled.
When it comes to making a pie chart in Google Sheets, it’s fairly simple. All you have to do is select Insert and click Chart. You’ll have a few different pie chart designs to choose from, and Google Sheets provides full customization options to shape your data.
Bar charts
A bar chart is most effective when comparing multiple different independent variables against each other. Maybe you’ve tested various marketing strategies and want to see which led to the most sales, or you want to discover how your revenue figures stack up to your competitors’.
A bar chart is a clear way to represent this type of information. And learning how to create a bar chart in Google Sheets is painless.
Similar to the pie chart workflow, you’ll highlight the cells with the data you want in your chart, select Chart, and choose a bar chart template. From there, you can customize the chart by adjusting labels on each axis to fit the models you want to create and more.
X-Y graphs
X-Y graphs are great for identifying where the majority of your data points lie. And if you’re wondering how to create an X-Y graph in Google Sheets, this guide is a good place to start. The x-axis in charts of this type represents a category, and the y-axis represents a numerical value.
To create an X-Y graph in Google Sheets, first highlight the cells you want to include. Make sure you include the cells with the entries that will represent your x-axis and y-axis. From there, click Insert chart, and select a scatter plot from the chart options. Just as with pie and bar charts, you can customize your chart and pick the format that works best for you.
Jotform Report Builder
Jotform’s Report Builder is a great alternative to Google Sheets for shaping and creating visual representations of your data.
If you use Jotform, you know that it offers tons of form templates to conduct research, but you can also turn the responses and data you gather from users into organized reports with customized formatting.
Jotform’s smart technology will automatically turn your form data into visuals, with several different options to choose from, including the same types of bar charts and pie charts found in Google Sheets. And once you have a completed report, it’s easy to share via an online link, embedding on a website, or through a PDF.
Physical printouts
While there’s a lot of value in building spreadsheets and hosting them online, sometimes you might need a paper copy. Different clients have different expectations, so you need to have the capability to print out relevant parts of a spreadsheet for that big sales pitch.
Once your sheet is fully formatted and complete, you can create printouts from specific cells of your sheet. If you want to set a print area in Google Sheets, don’t fret. Here’s how it works:
- Highlight the cells you want to print.
- Select File and click Print on the Google Sheets menu bar. In the print menu, specify that you only want to print Selected cells instead of Current sheet. This is important, as Current sheet is the default.
- Customize to your needs. You can format the page, orientation, and margins to make sure the final product comes out the way you want it to.
Becoming a Google Sheets pro
To get the most out of Google Sheets — and for it to function the way you need it to — there’s going to be a learning curve. While the software is very intuitive, you’ll still need to do some input to see its full potential.
Now that we’ve covered how to plot your data and make it presentable in a professional setting, we’re going to explore how to manipulate that same data within mathematical formulas for in-depth investigations. For a crash course on Google Sheets’s calculation capabilities, head to the next section.
Pro Tip
To create a fillable form in Google Sheets, turn each column into a response field, add dropdown menus for consistent answers, and protect formula cells so respondents only edit the areas meant for input.
Google Sheets functions and formulas
Forming an action plan for data collection is an involved and comprehensive process. Not only do you have to design methods for gathering data, but you also have to know how to work with the functions within your spreadsheet software to analyze that data.
Sometimes, collecting raw data isn’t enough. If you buy meat at the grocery store, you’re not going to serve it right out of the package. You have to add spices, put it on the grill or stovetop, and cook it before you serve it to guests.
The same idea applies in business — you might have to arrange and manipulate your data before the results become clear. And you need a formula to do that.
With Google Sheets, as with Microsoft Excel, there are tons of different functions and formulas to shape your data and perform complex mathematical problems for big-picture analysis. Let’s examine what these functions are — and the process needed to carry them out.
Google Sheets functions
Identifying duplicates
In Chapter 3, we covered Google Sheets’s VLOOKUP feature, which relates to searching for values in the first column of a data set and finding their match. But there’s more value searching you can perform, such as the ability to highlight duplicates in Google Sheets.
The reason you might want to find duplicates relates to data entry — if there’s an errant or extra record in your sheet, it’s going to throw your whole analysis off. And since you make decisions based on the analysis you perform, ensuring that there aren’t unwanted duplicates in your data is important. Here’s how it works:
- Highlight the columns where you want to find duplicates.
- In the Google Sheets menu, select Data and click Remove duplicates.
- You’ll see a prompt asking which columns you’d like to search, and
Google Sheets will show whether your data has any duplicates.
There’s also a more complex way to identify duplicates that’s worth learning, and it involves what’s known as the COUNTIF formula. This formula is designed to search for specific criteria you provide and identify the number of cells that match.
This function begins in the Format menu under Conditional formatting. You’ll be prompted to include a range of data that you suspect might contain duplicates.
For example, B1: B120 would refer to the data set included from column B1 to your last entry in that column, B120. Below that, there’s a Format cells if section, which is where you’ll choose Custom formula is and enter the formula =COUNTIF (B:B, B1) > 1. Google Sheets will automatically highlight each duplicate as soon as you click Done.
It sounds complicated, but all you’re doing is inputting language that tells Google Sheets to search for duplicates within the B column of your sheet from B1 through B120.
You can also search within multiple columns with the COUNTIFS formula. Here, you’ll enter the plural, COUNTIFS, and input the same language with commas separating each command. For example, to examine columns B and C, you’ll enter (B:B, B1, C:C, C1) > 1. If you’re confused at first, practice makes perfect, and you’ll have it down after trying out the process a few times.
The SUMIF function
The SUMIF function in Google Sheets adds the numbers in a given range together based on the provided condition. The SUM portion of the formula is the action command, and the IF represents the ability of the chosen cells to meet a given condition. To initiate the SUMIF function in Google Sheets, use the formula =SUMIF(range, criterion, [sum_range]).
Let’s break down each of these components:
- Criterion. Specify the condition you’re telling Google Sheets to meet within the criterion. This will be the guiding principle in a SUMIF data search. It can be a number, a cell reference, or a test of which numbers are greater than or equal to.
- Range. These are the cells you’re testing against your criterion.
- sum_range. This is the range of cells that accurately meets the condition set to be summed. For SUMIF to work correctly, this range must be the same as the size of your range.
You can use the SUMIF function with specific number sets by conducting comparisons like greater than (>), less than (<), greater than or equal to (>=), less than or equal to (<=), or not equal to (<>).
As an example, you can look into the number of values equal to or greater or less than a specific sales figure. You can also test against date ranges and text ranges. How you carry out these functions depends on what you’re hoping to learn from your data and the type of data you’ve collected.
What’s more, if you have some incomplete data entries related to, for example, shipping dates, you can sum only the cells in which shipping dates are entered by using the <> symbol. The full formula for a range of cells in B and C columns would read (B1: B20 “<>”, C1: C20). This function is especially useful for searching across a wide range, and as long as the syntax is correct, you’ll be able to use it for all different kinds of data gathering processes.
Calculating standard deviation
In addition to searching for several values, Google Sheets also has built-in statistical processes. If you have a large data set, one of the most common and helpful statistics is standard deviation.
Standard deviation concerns the average of your numbers, or the center, and the calculations surrounding the percentage of data that falls inside or outside that average. It’s calculated as the square root of the data’s variance, which is a measure of how far your data is spread in relation to its average.
To calculate standard deviation with Google Sheets, there’s a simple formula. The syntax for this formula is =STD (C7, C8, C9) or =STD (C2:C6), where the values are individual cell numbers or a range. You can specify the calculation needed and add filters if you want a standard deviation related to a specific condition.
Keep in mind that these calculations refer to a sample within a total population, and you’ll need a different formula to find the standard deviation of a population.
The array formula
The array formula in Google Sheets provides a shortcut to apply a formula to an entire column. This can be helpful to duplicate data from one column to the next, as well as create a column with calculations based on the specifications you provide.
To use the array formula in Google Sheets, enter =ARRAYFORMULA(B1:B). In this example, you’re telling Google Sheets to pull in every cell in the B column.
You can also use this formula for mathematical equations, multiplying all the values in one column by the values in another column.
There are also actions you can carry out with conditions — whatever you need, the array formula is a great way to get specific with the type and amount of data you want to work with.
Conditional functions
Conditional functions within Google Sheets are based on logic. There are two prominent conditional functions worth learning in data exploration: IF-THEN and IFERROR. When you enter an IF-THEN formula in Google Sheets, you’re essentially asking a question about the specifications you provide.
For example, if you want to see whether a value in one column is less than or greater than the value of a cell in another column, you would input =If (CELL1<CELL2, “LESS THAN,” “GREATER”). Google Sheets will then return a value that answers the question you posed.
Along with IF-THEN statements, you can also use the IFERROR conditional function. IFERROR in Google Sheets is a great resource to spot any mistakes you make in the data calculation process, like dividing a number by zero or performing a calculation in a cell that contains text.
There are a few different types of errors you might encounter, and IFERROR in Google Sheets is equipped to handle each of them. Think of IFERROR as a safety net — if you’re entering a specific formula and wrap IFERROR around it, you’ll be able to find any mistakes or values that don’t square with that formula. Google Sheets will then produce a blank cell or allow you to change it manually.
The other way to use IFERROR is after the fact — if you enter a formula and discover faulty cells, you can reenter it with an IFERROR condition built in to eliminate any errors within your cell.
Getting into the weeds with Google Sheets
If you’re a novice when it comes to producing and writing formulas in spreadsheet software, the formulas — and the proper way to enter them — might seem overwhelming at first. But as with anything difficult, you’ll learn the more you do it.
Without these formulas, the analysis you can conduct will be limited, which means you won’t have enough information to draw effective conclusions about your data. But with them, you’ll feel like you have a superpower, equipped with the knowledge to manipulate and shape your data exactly the way you picture it in your head.
And now that we’ve done a deep dive into the technical side of Google Sheets, let’s explore its different use cases for project management and streamlining your workflow processes.
Google Sheets uses
Technology evolves by building off of what came before it. The iPhone was born out of the ability to send instant messages and connect to the internet on flip phones. Software updates fix bugs and adapt to counter offerings from competitors. This type of healthy competition is essential for businesses searching for the latest and greatest to maintain efficiency.
Google Sheets falls into this category. Drawing inspiration from Microsoft Excel, Sheets arrived on the scene with enough features to differentiate itself while still containing the touchstones that made Excel so useful.
The majority of use cases for Google Sheets fall into countable cases. This means performing calculations, tracking progress over time, and keeping up with revenue figures.
In this chapter, let’s study the use cases for Google Sheets, how to implement them, and how they can help you continue to innovate.
Use cases for Excel
Creating a budget
Google Sheets has taken into account all the different ways you might need to use it and designed templates for those exact purposes. One of the most popular is a way to create budgets.
With this template, you can switch between two different tabs. The first tab includes a summary of the money you earned and lost, along with projections versus actual income. The second tab lists transactions and serves as the living document for continuous entry updating. These two sheets are linked, so a change in one will automatically make adjustments in the other.
And if you’re willing to make a budget from scratch, Google Sheets has that capability as well. It’s a more involved process, but you’ll have increased flexibility about how you shape your data. What’s more, within this workflow, you can create formulas to calculate expenses and gather internal data about your spending.
That’s what’s great about creating a budget in Google Sheets — whether you simply need a centralized place to store your transactions or want to break down your revenue into further detail, there are processes that fit your needs.
Project management
There are plenty of ways to use Google Sheets to store your project information and progress. The software’s project management and project tracking templates are designed for easy organization and workflow.
You can set goals and follow your progress, plan budgets, and take stock of the big picture in your projects. Plus, you can track your expenses against the amount you expect to spend, classify the priorities of tasks, and institute a system for monitoring the progress of everyone on your team.
Even better, with a Gantt chart in Google Sheets, you can establish timelines and follow along as you work to accomplish your goals throughout your project. A Gantt chart also includes information about the different stages of a project, as well as due dates and more detailed breakdowns.
Creating reports
Once you’ve completed a project, you might want to produce reports that summarize your findings. To that end, Google Sheets has report building capabilities, with two different templates best suited for this use:
- Paid traffic reports. This template reports on paid traffic assorted by yearly and general overview categories. You can even connect it with Google Analytics to import data and examine different time frames. This template is a great all-around tool for taking stock of how your paid traffic campaigns are performing and where any possible adjustments can be made.
- Customer relationship management (CRM). Maintaining lasting and healthy relationships with customers is an integral part of doing business. Staying organized and being able to access customer information at the drop of a hat keeps customer relationship management workflow processes humming, which is exactly what you can do with Google Sheets. Be sure to share this template with others on your team to make sure everyone has the most up-to-date information and access to your client lists. Plus, if a separate department needs access to your records, Google Sheets’s cloud-based interface makes it easy to pass along and share templates.
Create to-do lists
Though you might have a running log in your head of your tasks for the day, it still helps to write them down. Google Sheets’s to-do list template is the place to store day-to-day goals and cross them off one by one.
It’s easily customizable, and if the tasks you’re completing are more complex, you can establish priorities to make sure you have a clear picture of what’s ahead. You can also bold text and change colors to create a digestible and personalized look for your hourly to-do list.
Establish schedules and calendars
If you’re wondering how to make a calendar in Google Sheets, there are a few templates to choose from to organize monthly tasks and meetings to your liking.
And if you’d rather input everything yourself, there are several formulas that allow you to do just that in Google Sheets. After typing the date you want your calendar to start in cell A1, input the formula (=today()+1). Google Sheets will populate the rest of the dates for the month, and you’ll have a personalized calendar at your fingertips.
Meanwhile, if it’s a schedule or planner you’re after, Google Sheets has templates for that too. It works by establishing an x-axis with days of the week and a y-axis with time periods to line up a certain task with a given day. This is useful for smaller teams that don’t have too much clutter when it comes to tasks to complete, meeting schedules, and other day-to-day processes.
Google Sheets for teachers
Google Sheets is all about personalization. Its template gallery is filled to the brim with sheets for different kinds of business operations. One example is education.
With Google Sheets, educators have an online location to keep gradebooks, take attendance, and chart student records. Teachers can set shorthand around the way they like to grade and give marks, and they can pair Google Sheets with Google Classroom to keep everything connected within Google’s suite of products.
Exploring outside Google Sheets
While you can do a lot with Google Sheets, it might not be able to do what you want in terms of data cataloging and analysis.
If that’s the case, consider Jotform Tables, Jotform’s spreadsheet-database resource. Powered by online forms, Jotform Tables’s collaborative interface turns the data gathering process into an all-in-one solution with customizable templates, unlimited entries, and smart automation that learns as you go.
Jotform Tables is more than just a spreadsheet, and its interconnectivity with the rest of the Jotform suite makes data collection, reporting, and analysis effortless. Plus, just like Google Sheets, Jotform Tables has more than 20 budget sheets for expense tracking and balancing transactions.
There are also several different calendar templates for social media, content planning, email marketing, and event management, to name a few.
If you’re a hotel manager, for example, keeping track of your hotel’s different events and parties week to week is an essential part of staying organized. You could use Jotform Tables to classify the different types of events the hotel hosts and make sure everyone, from the planners to the caterers, are on the same page.
In total, there are more than 250 table templates across all kinds of industries. You can personalize any of them to view and shape your upcoming tasks in ways that make sense for your workflow.
Learning how to use Google Sheets
Google Sheets is only going to work for you if you know how to use it. You can have the best intentions in tracking and monitoring your business expenses, but if you don’t understand how to take advantage of Google Sheets’s templates and work with them, you won’t get very far. But if you take the time to dive in and understand all that Google Sheets can do for you, processes that once took a day will now take only hours or even minutes.
If you’ve done your due diligence and decided that Google Sheets isn’t for you, there are other options. In our next section, we’ll explore alternatives to Google Sheets and how they stack up.
Google Sheets alternatives
Think about the greatest athletes of all time. For as many Super Bowls as he’s won, Tom Brady has plenty of playoff losses. Serena Williams has more than 20 Grand Slam wins, but there have been tournaments where she’s lost early on too. Even those at the top of their game have bad days.
And as great as Google Sheets can be for business operations, you might find it has its shortcomings. There might be functions you need that it either doesn’t provide or you find lacking. In this chapter, we’re looking into what those issues might be and the alternative software you can use instead to help you stay organized.
Alternatives to Google Sheets
There are a few reasons you might consider taking your workflow processes somewhere other than Google Sheets. Maybe your business doesn’t do as much database processing and only needs a few of its functions. The process of converting all your operations to Google Suite is a big undertaking as well, so you might find it’s not worth the time.
Regardless of the reason, you’re still going to need to use something to help you arrange and categorize your data and keep track of your projects. Here are several alternatives to Google Sheets.
- Smartsheet. Like Google Sheets, Smartsheet is a cloud-based tool. But where it differs is in its elasticity. Smartsheet is where spreadsheet software is headed, as it evolves to become more like what you might think of as a database. Smartsheet offers several different views of your work in progress with a click of the mouse, including the project timeline, calendar, and grid options. It’s a great tool for project management and has an easy-to-use interface.
- ClickUp. ClickUp has its hands in a little bit of everything. It includes project tracking, time management, to-do lists, and document creation capabilities, all in an easy-to-use interface. It’s mostly focused on the to-do list aspect of the software, with different views for arranging and setting goals, so you’ll want to make sure you know exactly what you need before you use it.
- Airtable. Airtable is a spreadsheet-database hybrid in the truest sense. Like Smartsheet, Airtable has many different options for project management and many different third-party integrations with applications like Dropbox and Slack. Consider Airtable as a long-form spreadsheet-database hybrid, providing a large canvas to lay out your workflow.
Integrating data-collection strategies
Google Sheets’s data storing capabilities are the reason so many companies big and small use it to stay organized. Whether you’re inputting data as you go or importing it from an outside source, Google Sheets has you covered across many different file formats.
But if you’re gathering data from multiple sources, storing it in one file might get confusing and hard to follow. And while Google Sheets’s cloud operations allow anyone on your team to access a file, having many moving icons and cursors at one time increases the margin for error and could lead to incorrect or missing data.
That’s why it’s important to consider pairing Google Sheets with outside tools like Jotform to streamline data collection. With Jotform connected to Google Sheets, you’ll be able to export data from a form submission automatically for real-time updates. This way, you can cut out manual processes and watch as your data files itself.
Even better, Jotform’s Google Sheets integration is easy to set up, so you won’t have to invest too much time worrying about how your data might be affected. You can customize your integration and how your data migrates to Google Sheets. Plus, because Jotform has so many form templates, you can store and collect just about any type of data.
Exercising caution with Google Sheets
If you’re committed to moving your company operations to Google Sheets, you must do your due diligence. Understanding what you’re getting into — as well as any potential pitfalls — is part of being a practical and intelligent business. And while Google Sheets has a navigable interface and is relatively bug-free, there has been the occasional slip-up.
Take the December 14, 2020, Google outage that left workplaces across the country at a standstill as an example. Caused by a failure in authentication tools, the error left Gmail and Google Calendar entirely unusable.
Users who weren’t signed into their Google accounts were unable to access any third-party applications integrated with Google’s suite. Google Sheets was affected, and users were unable to use the software.
In a vacuum, this outage highlighted some of the limitations of using software like Google Sheets, which is entirely connected through the internet and exists only in the cloud. If Google encounters a problem, your workflow halts completely. If you have tight project deadlines that rely on meeting certain goals each day, an outage like this has the potential to be devastating.
What’s more, if any type of outage occurs — whether through Google or even on your internal internet server — you really can’t work with any Google product.
While these types of problems are rare, being aware of some of the shortcomings of Google’s software is important to understand the risks and how to plan for contingencies should something go wrong. Whether that comes in the form of a different software suite or creating an action plan, covering all the bases in your project management can only help you keep your deliverables up to date and your workflow on track.
Conclusion
Traveling across Google Sheets
Every spreadsheet starts as a blank document. The elements that are eventually displayed within this document depend on the data you gather and the categories and patterns that reveal themselves within this data.
The best spreadsheet software can shape itself to your needs, and that’s what Google Sheets does. Its ability to connect within Google Suite makes data processing across different applications a breeze, and you can go into detail with the types of formulas and data manipulation you perform.
Google Sheets is what you make of it, and regardless of how you use it, you can rest easy knowing that you’ll always have a reliable tool for project management, data storage, and decision-making that will drive your business for years to come.


Send Comment: