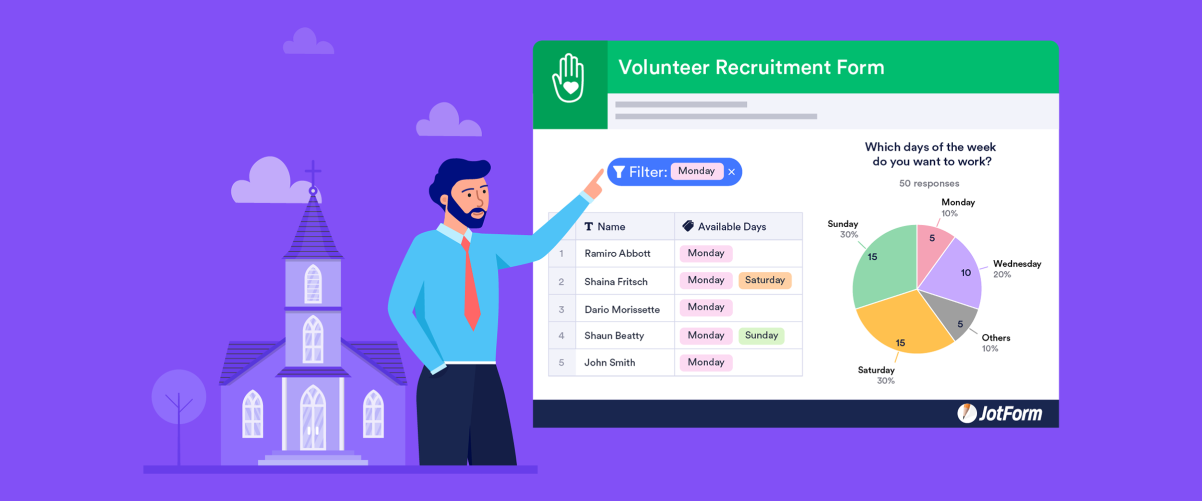
With Jotform Report Builder, you can automatically turn your survey, poll, feedback, and form data into stunning charts and tables that are easy to present, analyze, and share with others.
This month we’re launching Jotform Report Builder, a powerful new reporting feature that’s a year in the making!
With Jotform Report Builder, you can automatically turn your survey, poll, feedback, and form data into stunning charts and tables that are easy to present, analyze, and share with others. ?
We’ll also show you how to collect and share feedback, analyze survey results, create a live dashboard, and more. Read on to learn more and register for our free webinar.
|
|
See your data in a brand new way with Jotform Report Builder! Automatically turn form submissions, survey results, and feedback into stunning charts and graphs to analyze your data and improve your business.
|
|
Find out how collecting feedback and sharing it with your teammates can help you uncover useful insights, identify important issues, and improve your business.
|
|
A little professionalism can go a long way. Discover how Live Easy, a South African property management and development company, uses Jotform Report Builder to visualize and present tenant demographic data to investors.
|
|
Learn how to view your form data in a live dashboard that automatically updates with each new submission. Stay up to date on incoming data and feedback.
|
|
We spoke to Lake Forest Church in North Carolina to see how Jotform Report Builder helps them collect volunteer feedback, generate feedback reports, and analyze the data to improve services for their churchgoers.
|
|
Still have questions about Jotform Report Builder? Register for our free webinar on Wednesday, July 29, at 11 a.m. PST to get answers to all of your questions.
|
|
Send Comment:
Comment: