In 2017, a survey of nearly 5,000 American teachers confirmed what many already intuitively understood: Teachers are overworked, incredibly stressed and responsible for an ever-increasing number of tasks that they have no input on.
That last point is important. Schools systems around the country routinely adopt new goals and new points of emphasis, which trickle down to the classroom level as administrative tasks.
“Every few years, there’ll be a big push to adopt some new best practice, but just when we’re starting to get good at it, which takes a few years, there’s a new push,” one Michigan middle school teacher tells VICE’s Markham Heidi, who reported on the study.
That’s how classroom data collection can feel to many teachers. While data analytics can be a huge boon to teachers, classroom tech fatigue can make data collection feel like a chore.
The question, then, is how can teachers capture the benefits that good classroom data can provide without burdening themselves with more hours of unpaid administrative work?
By understanding what data is worth collecting, and what data isn’t worth the effort. From that perspective, data collection and analysis can be folded seamlessly into your daily work.
What Data Should You Collect?
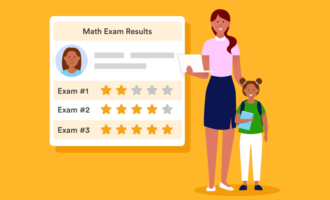
Standardized tests are a given when it comes to data collection. Most schools and teachers have gathered this kind of data for years. But, unsurprisingly, that data doesn’t go far enough.
Kerin Steigerwalt, a 7th-grade language arts teacher, wanted more specific data about student achievement. Rather than one-off exam scores, she wanted to understand how effective her lessons were, whether her students understood the importance of the lessons and whether they felt the lessons they learned helped them grow.
In Steigerwalt’s classes, most of the data revolves around understanding a student’s grasp of grammar, writing ability and knowledge of literary terms. Those data points are useful for her, she says, but they also make it easy to demonstrate to students how much progress they’ve made.
Personal Data: This Can Help You Build Rapport With Students
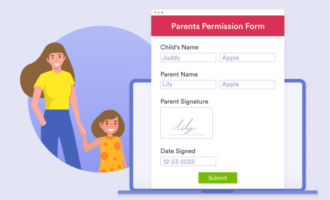
Another data source that doesn’t go far enough? Registration records. That’s why teacher Adam Schoenbart starts each new school year by creating a form of his own that asks students to give their preferred names.
It’s a small gesture, but knowing immediately whether Samantha prefers “Sam” or Matthew prefers “Matt” will help you build rapport in these first days of the school year.
Attendance and Behavioral Data
It’s important to collect behavioral data, too — in particular absences and behavior issues.
Work by analyst Jennifer Savino involving behavior and attendance data transformed attendance levels at Miami Carol City Senior High School in Florida. By comparing the school’s attendance and behavioral data with dropout risk studies from John Hopkins, Savino and her team helped a third of students with attendance problems get back on track. They’ve also helped two-thirds of kids with behavioral problems change for good.
You don’t need a database built by Ivy League researchers to spot when students in your classroom are struggling, though. If the software you use to track attendance lets you easily visualize trends, you can see instantly whether a student’s absences are trending downward. Then, you can flag that student as a potential dropout risk and take the necessary steps to intervene.
Equally important is to track how students behave when they are in your classroom. You will know with a scan of the room who is paying attention, but tracking that data will show you day-to-day trends in student engagement.
For teacher Meghan Mathis, collecting behavioral data on one particularly difficult student not only helped her to respond better in the class but greatly improved that student’s behavior, too.
During lessons, Mathis would note on a tally sheet whenever that student called out in class and how often he was busy on the task at hand. At the end of each lesson, she would also record qualitative data on how the lesson went and the actions she took to deal with the problem child. The data she collected was straightforward but helpful for the student’s case manager.

How Can You Collect Data Easily?
Start with existing datasets. There might be stores of knowledge all around your school that you didn’t know about.
Authors Tim P. Knoster and Robin Drogan recommend contacting your students’ teachers from the previous year and asking for a shortlist of students who need extra academic, behavioral and emotional support. If this isn’t feasible, ask school administrators whether they have any such records.
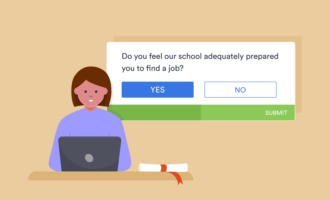
Your lessons will probably also provide ongoing opportunities to collect data. Teacher Rebecca Alber says low-stakes assessments like quizzes and exit slips are one of the most important ways to gather data on student abilities and progression. A pop quiz at the end of the lesson or something as simple as a thumbs-up/thumbs-down class exercise is all it takes to quickly and easily get quantitative feedback on how well lessons have sunk in.
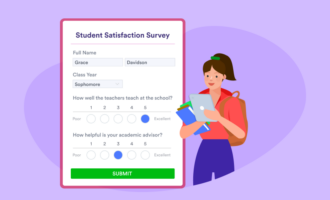
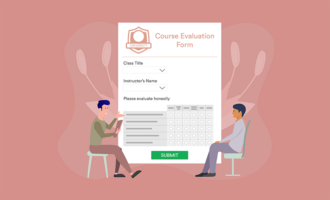
In fact, student feedback is an excellent vehicle for data-collection and for engaging your students on a deeper level. Concordia University-Portland offers one easy way to get this feedback: Have students color in a bar chart to show how far they feel they’ve progressed on a given topic. This is valuable feedback for you, but it also helps students feel a sense of agency over their own learning.
How to Use the Data You Have Collected
Once you have data, you need to contextualize it somehow. In most cases, something as simple as a pie chart or a bar graph will visualize your data and give it the necessary context. For example:
- If you are tracking quiz grades, a bar graph will show you the distribution of those grades.
- If you are tracking thumbs-up/thumbs-down feedback on a specific lesson, a pie chart will show you how students’ responses break down.
- If you are tracking a single student’s level of attention from day to day, a line chart can help visualize whether the student is trending in the right direction.
Incorporating data collection and analysis into your teaching doesn’t need to mean tons of homework for you. By following this roadmap before and during the school year, you can ensure that you gather and analyze the kind of data that will help you make an even bigger difference in your students’ lives.
















Send Comment:
4 Comments:
More than a year ago
Great Article being shared. Keep Posting!!! One can even get to know about Online Class MNSU D2L Brightspace Login Page For Upcoming 2022.
More than a year ago
Nice
More than a year ago
Definitely the best online form builder out there! Many features and integrations.
More than a year ago
Nice work!