


While you can create a visual report to see how many answers you have to certain form questions, the Summarize with a chart feature in Jotform Tables allows you to get these numbers in just a few clicks.

To quickly generate answer summary charts
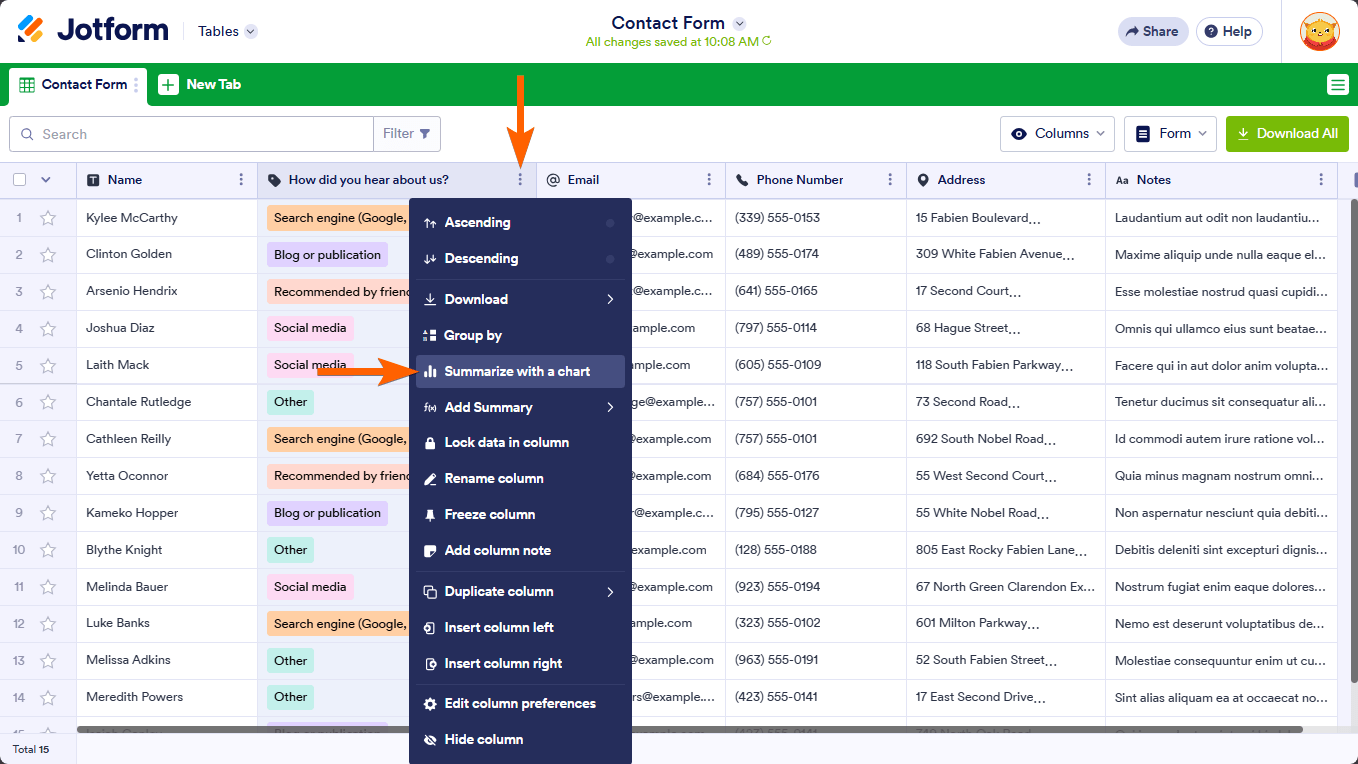
- In Jotform Tables, open the column’s menu at the top.
- Select Summarize with a chart.
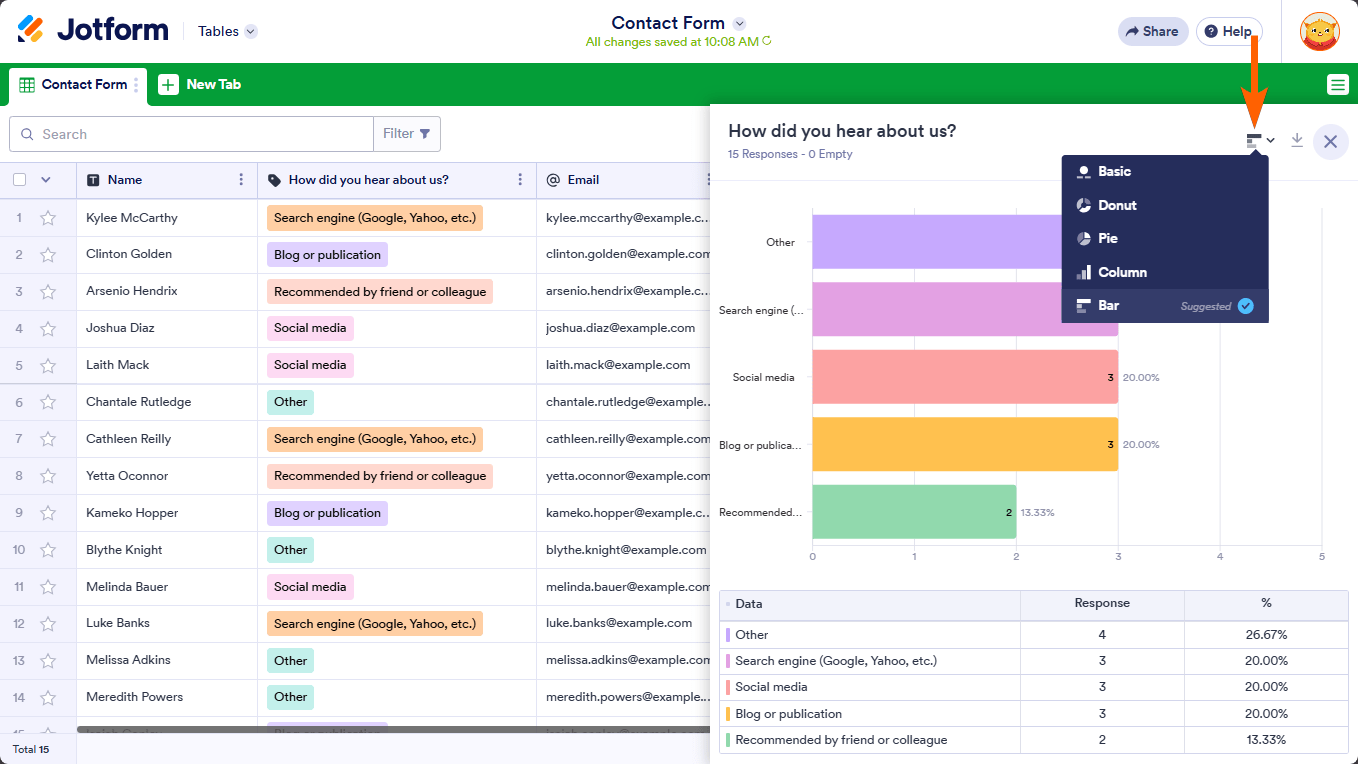
The summary panel should appear on the right. To change the chart type, select the chart icon in the upper-right corner.
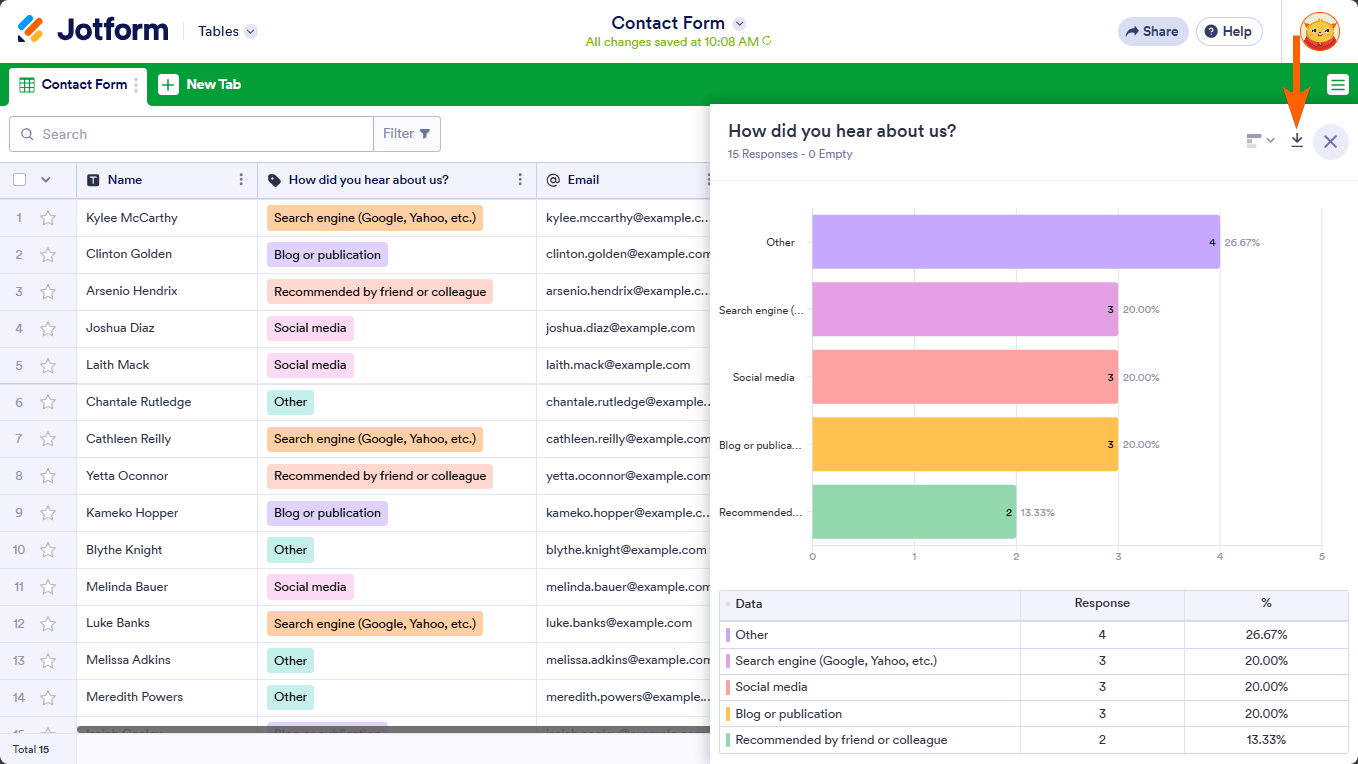
Next to the chart icon is the download icon that you can use to download the chart.
See also: How to Create Automated Reports in Jotform Tables.
Send Comment:
4 Comments:
More than a year ago
I would like to know if it is possible to save or print the chart it makes - it shows an option that seems to allow you to save it, but the resulting file is not a known type of file and I can't open it.
More than a year ago
Hi,
Is there a way to hide the chart and just show the summary grid? Having a table with the summary is much more useful for me. I tried to do this with the report builder, but there's no option to just have a summary table.
Also, is there any way I can download the summary as a PDF instead of an image? We need to print out the product summary or export it to Excel or Google Sheets so we can order the items from our suppliers.
Your help will be very much appreciated.
More than a year ago
Hi -
We are using the school lunch order form. We need to compile information for the products ordered on each day. Example: We need to know what students ordered Chicken Fingers on Wednesday. We need a report that will show us Student Name, Grade, and Order for the day.
I can't separate the products by day as they are given on the template.
Please help me set up a table with this information broken down by day.
Thank you.
Sheila
More than a year ago
I have 30 answers on my form, but when I click the Summarize with a chart option, it shows only 17. What should I do to show the summarize of all answers?