
Once you know how to use Google Forms, building and sending out a survey takes only a few minutes. But when responses start coming in, analyzing answers to open-ended questions like “Why did you cancel?” or “What made you choose us?” takes a lot more time. Someone has to read each one and work out what people mean.
If you’re working with a large dataset, analyzing those responses manually can be overwhelming and error-prone. Thankfully, AI shortens the work. It can read and summarize responses, identify recurring themes, and turn results into reports you can share with stakeholders.
Whether you’re an educator running academic research or a marketer measuring customer feedback, tools like Gemini, Claude, and ChatGPT can take on much of the analysis. In this guide, we’ll walk through how to analyze Google Forms data with AI tools. Then, we’ll look at how Jotform handles data collection, AI data analysis, and reporting in one platform without the hassle of stitching together multiple tools or exporting responses to CSV files.
Pro Tip
Try Gemini first if it’s available in your Google Forms account. Gemini can summarize open-text responses in Google Forms for eligible text-response datasets and generate theme percentages that open in Google Sheets with counts and a chart.
1. Using Gemini in the Google Forms Summary tab
Gemini is Google’s AI model, and it comes built into Google Forms on eligible Google Workspace and Google AI plans. It analyzes text questions, including short-answer and paragraph fields where respondents write in their own words. As responses flow into your Google Form, the data collects under the Responses tab, where Google Forms analytics displays charts for multiple-choice questions.
To run Gemini Google Forms data analysis, open the form on your computer, then select the Responses tab at the top of the page. In the Summary tab, Gemini automatically generates a summary for each text question once the form has between three and 200 responses.
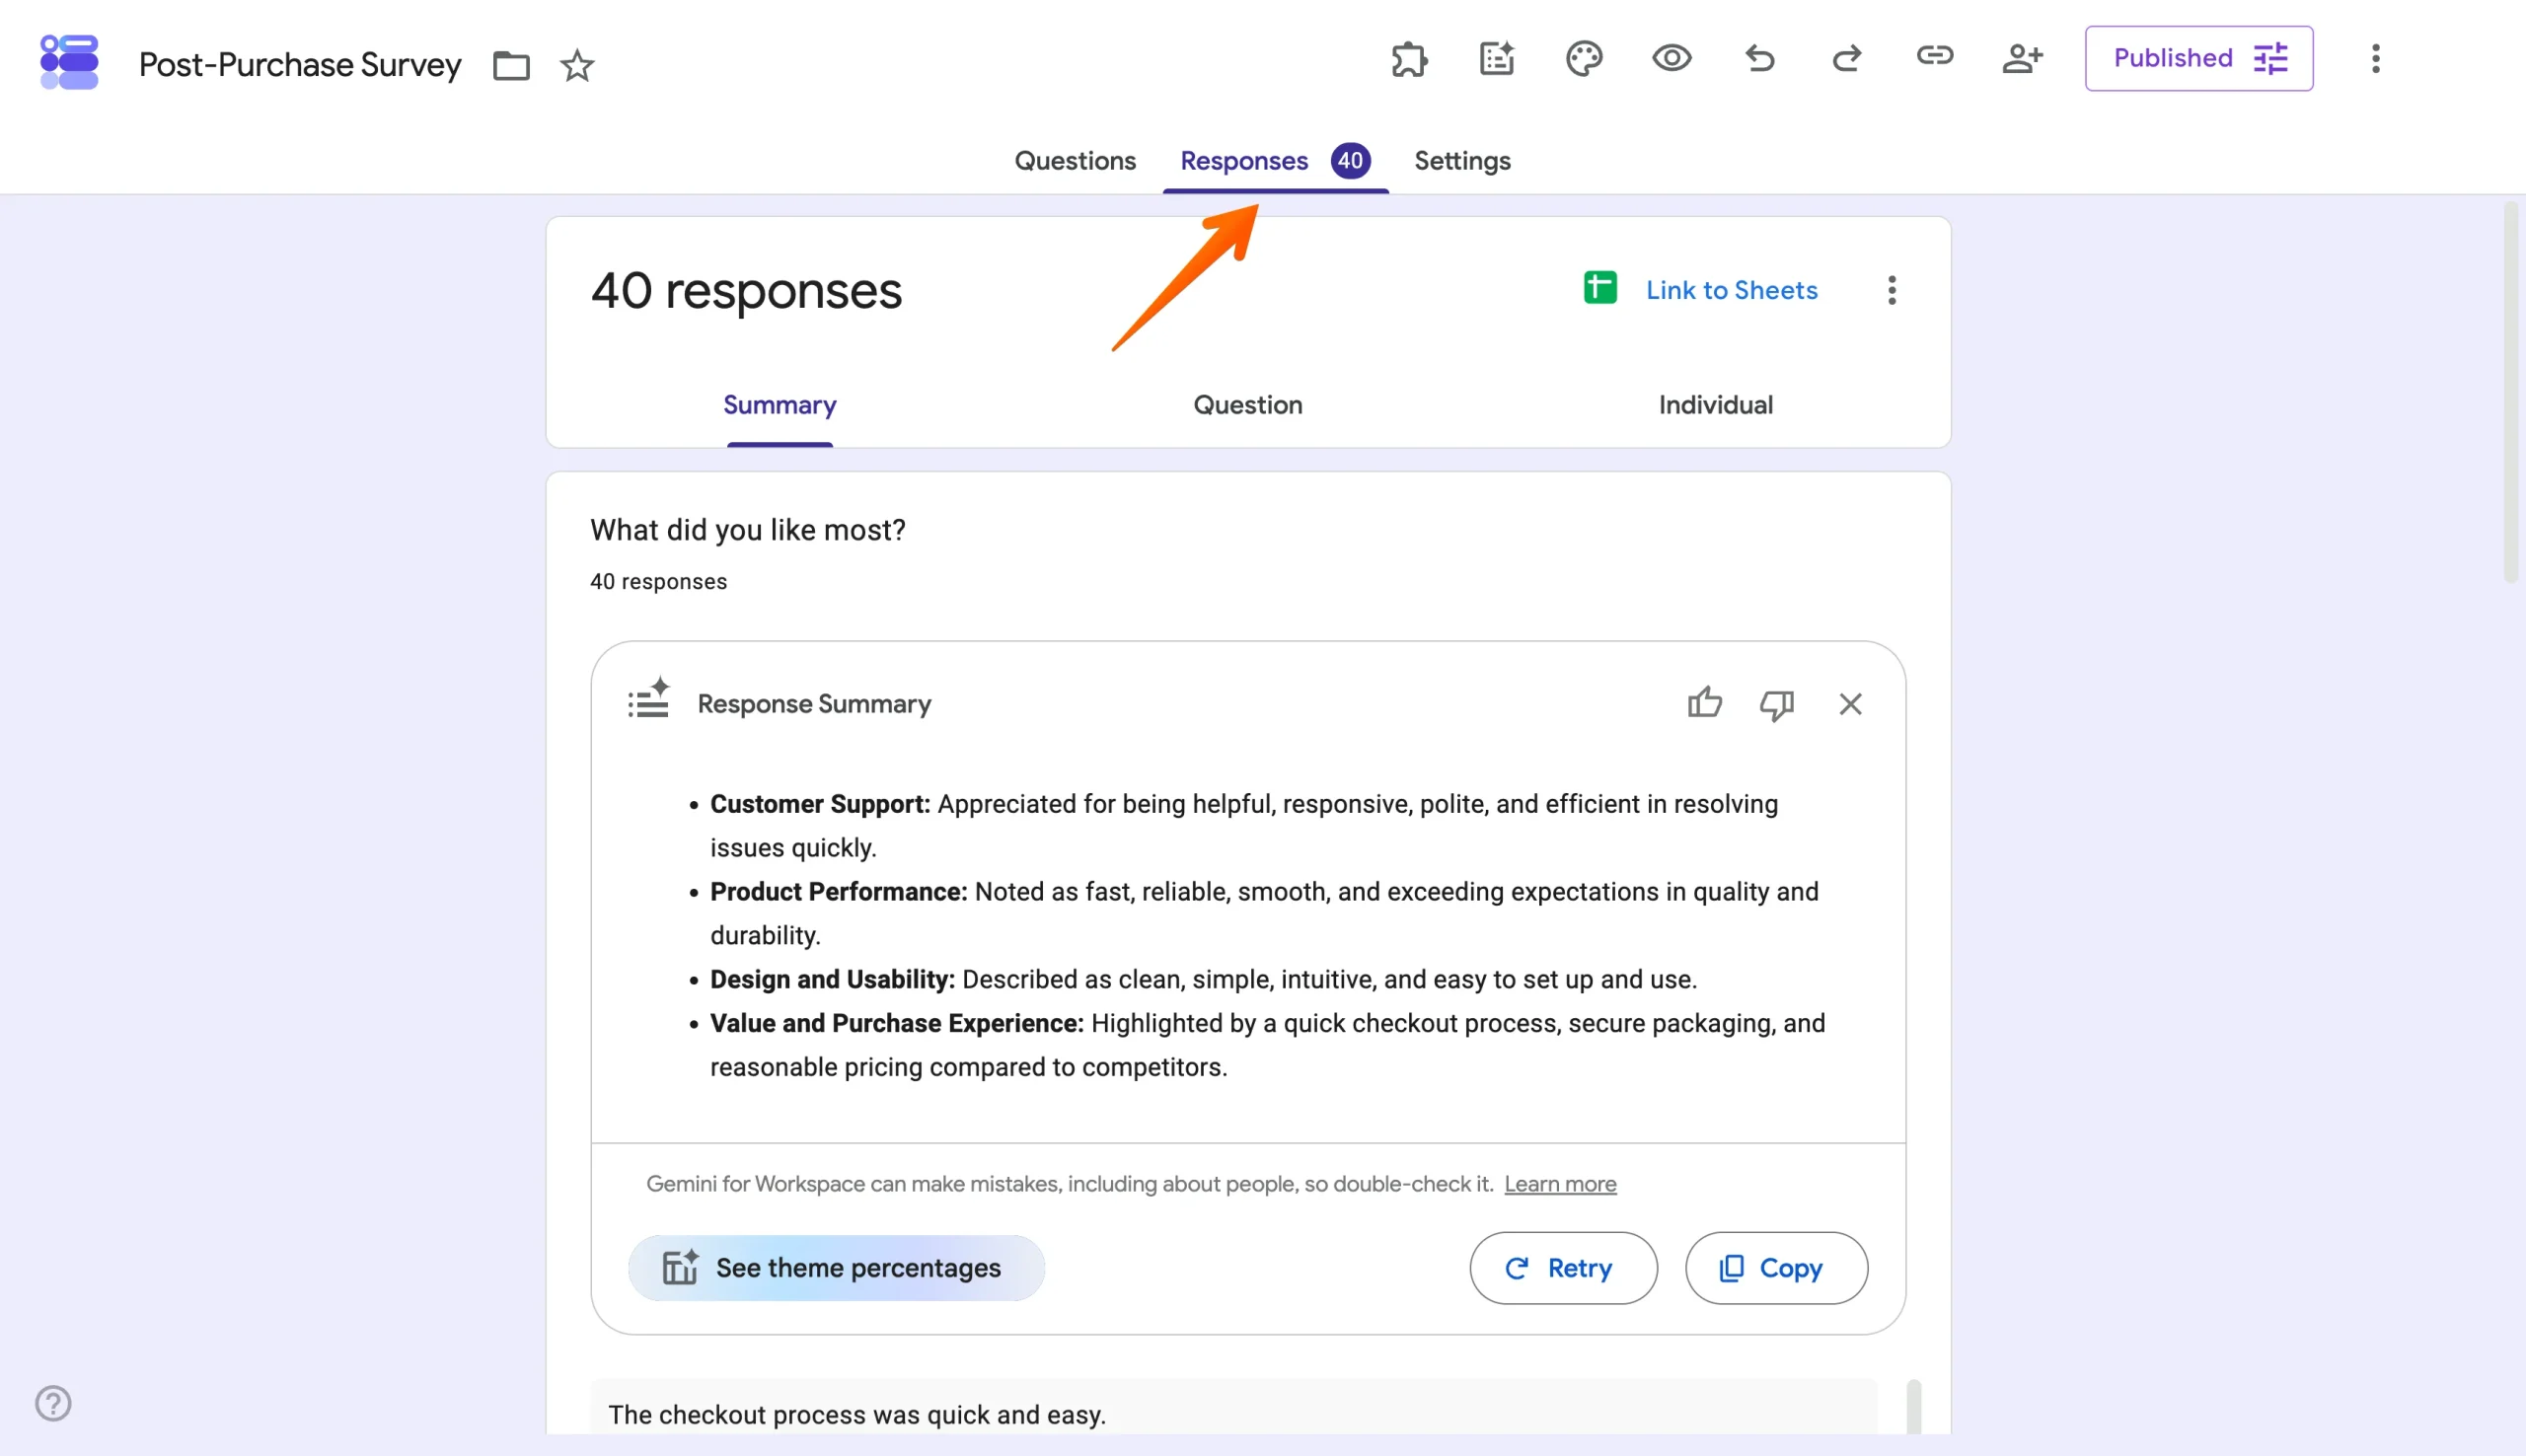
You can hit Retry for a new version of the summary if you’re unsatisfied with it or click Refresh with latest responses if new submissions come in while you’re reviewing.
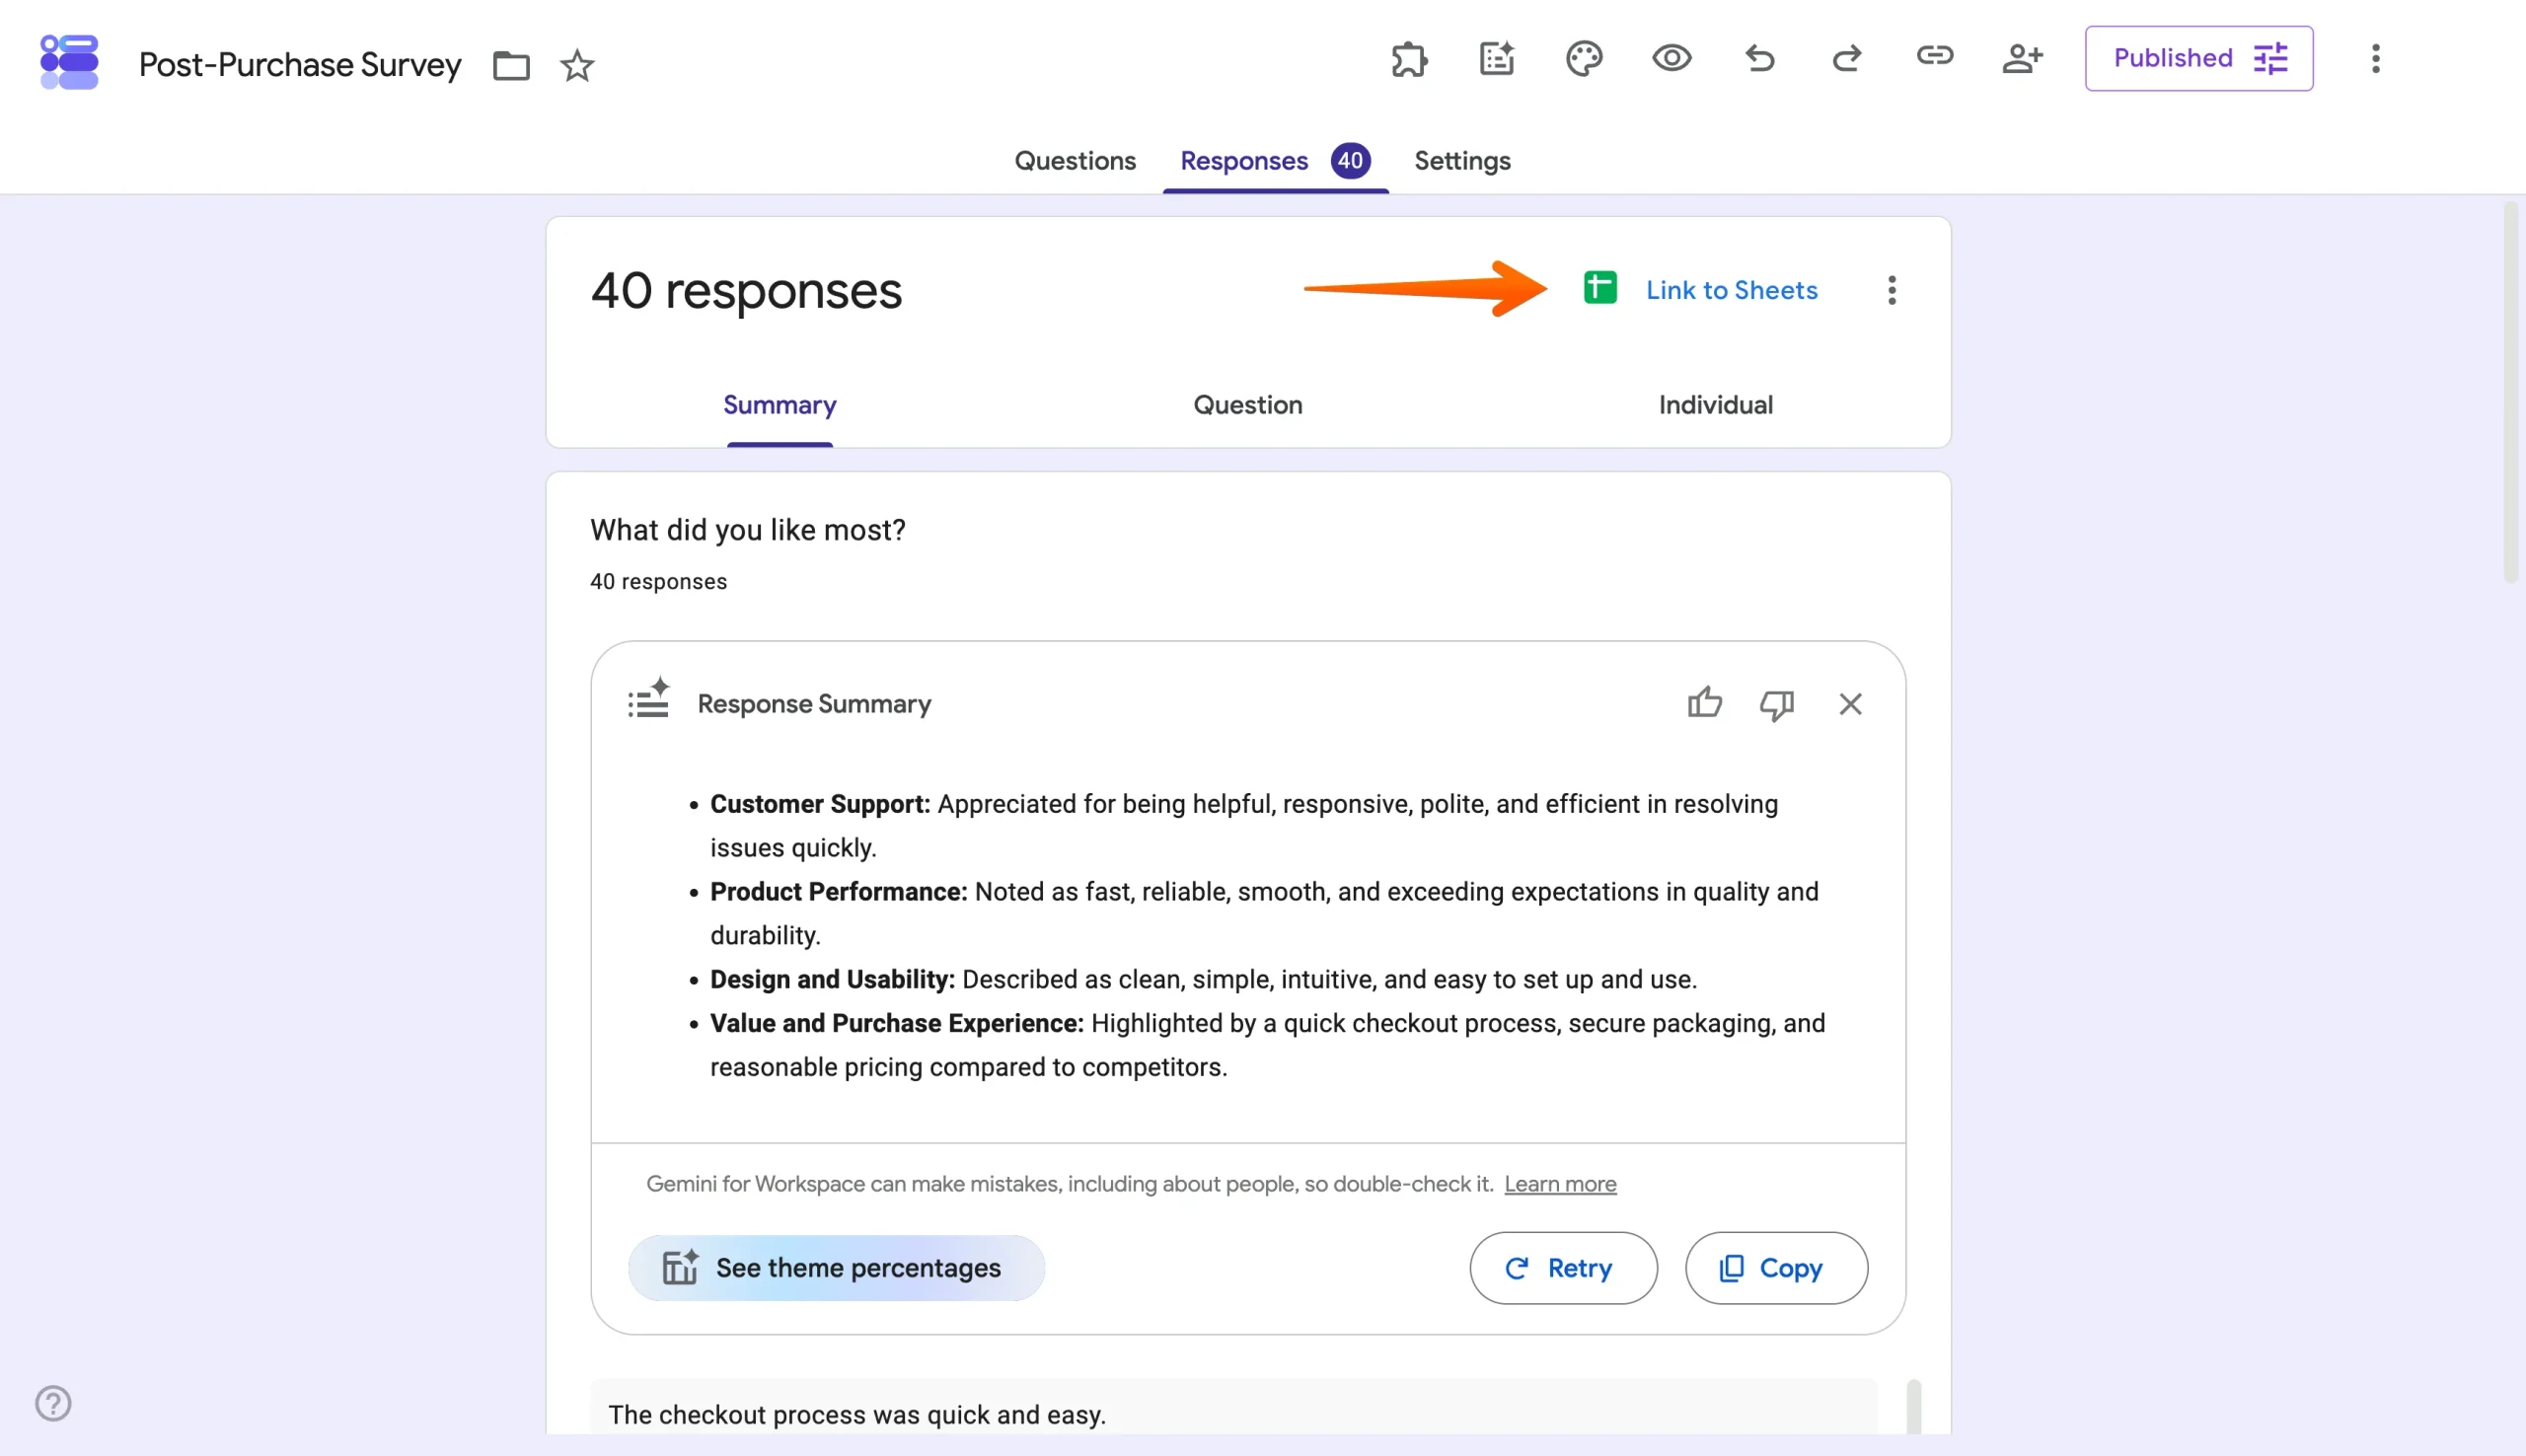
I ran a test post-purchase survey and collected 40 responses to see how Google Forms AI analysis works on real data. The form included two open-ended questions: “What did you like most?” and “What could we improve?” For “What did you like most?” Gemini’s summary highlighted customer support and product quality and performance as the most common answers.
From this summary, I could get an overview of all responses without first analyzing each answer manually.
2. Using Gemini in Google Sheets
While the Summary tab in Google Forms gives you a quick overview of collected data, connecting the form responses to Google Sheets allows Gemini to go beyond summaries — it can group responses into themes, build charts, and answer questions about the data. You can move from Forms into Sheets using theme percentages, which creates a separate sheet with your theme breakdown.
Under each text question summary, click See theme percentages to enable Gemini to group similar answers into themes.
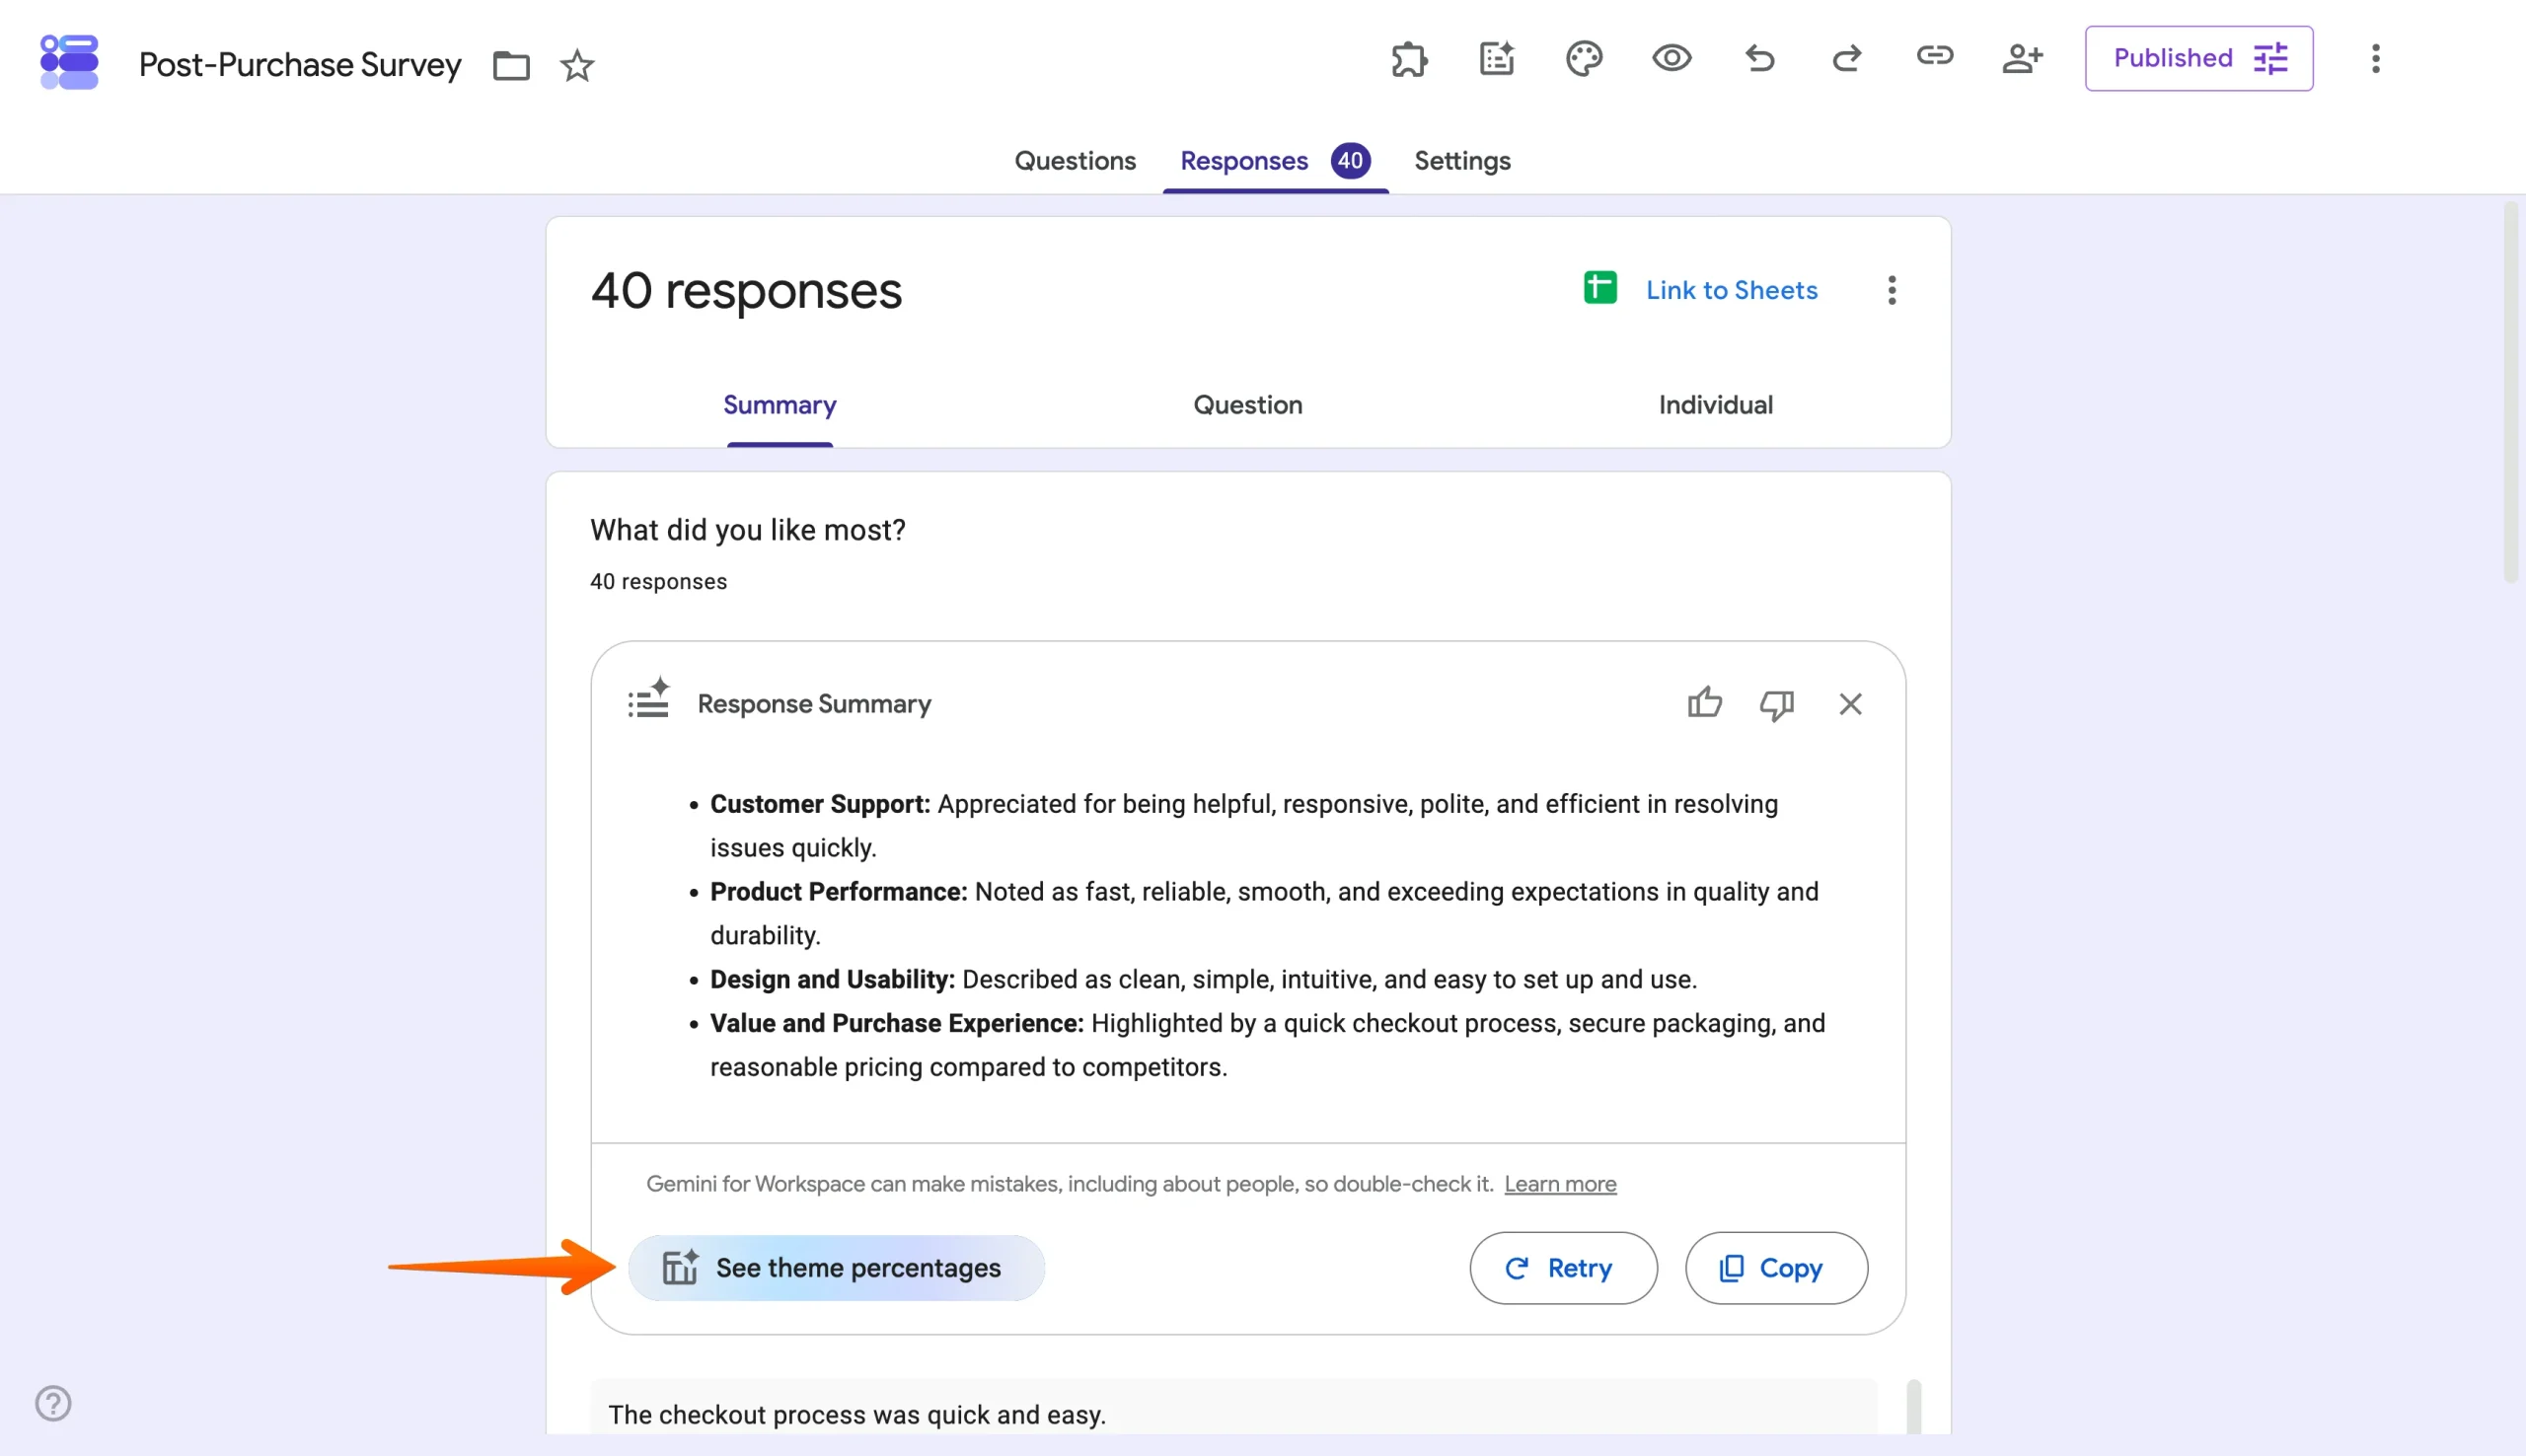
You can click Modify themes to add a theme Gemini missed or delete one that doesn’t fit.
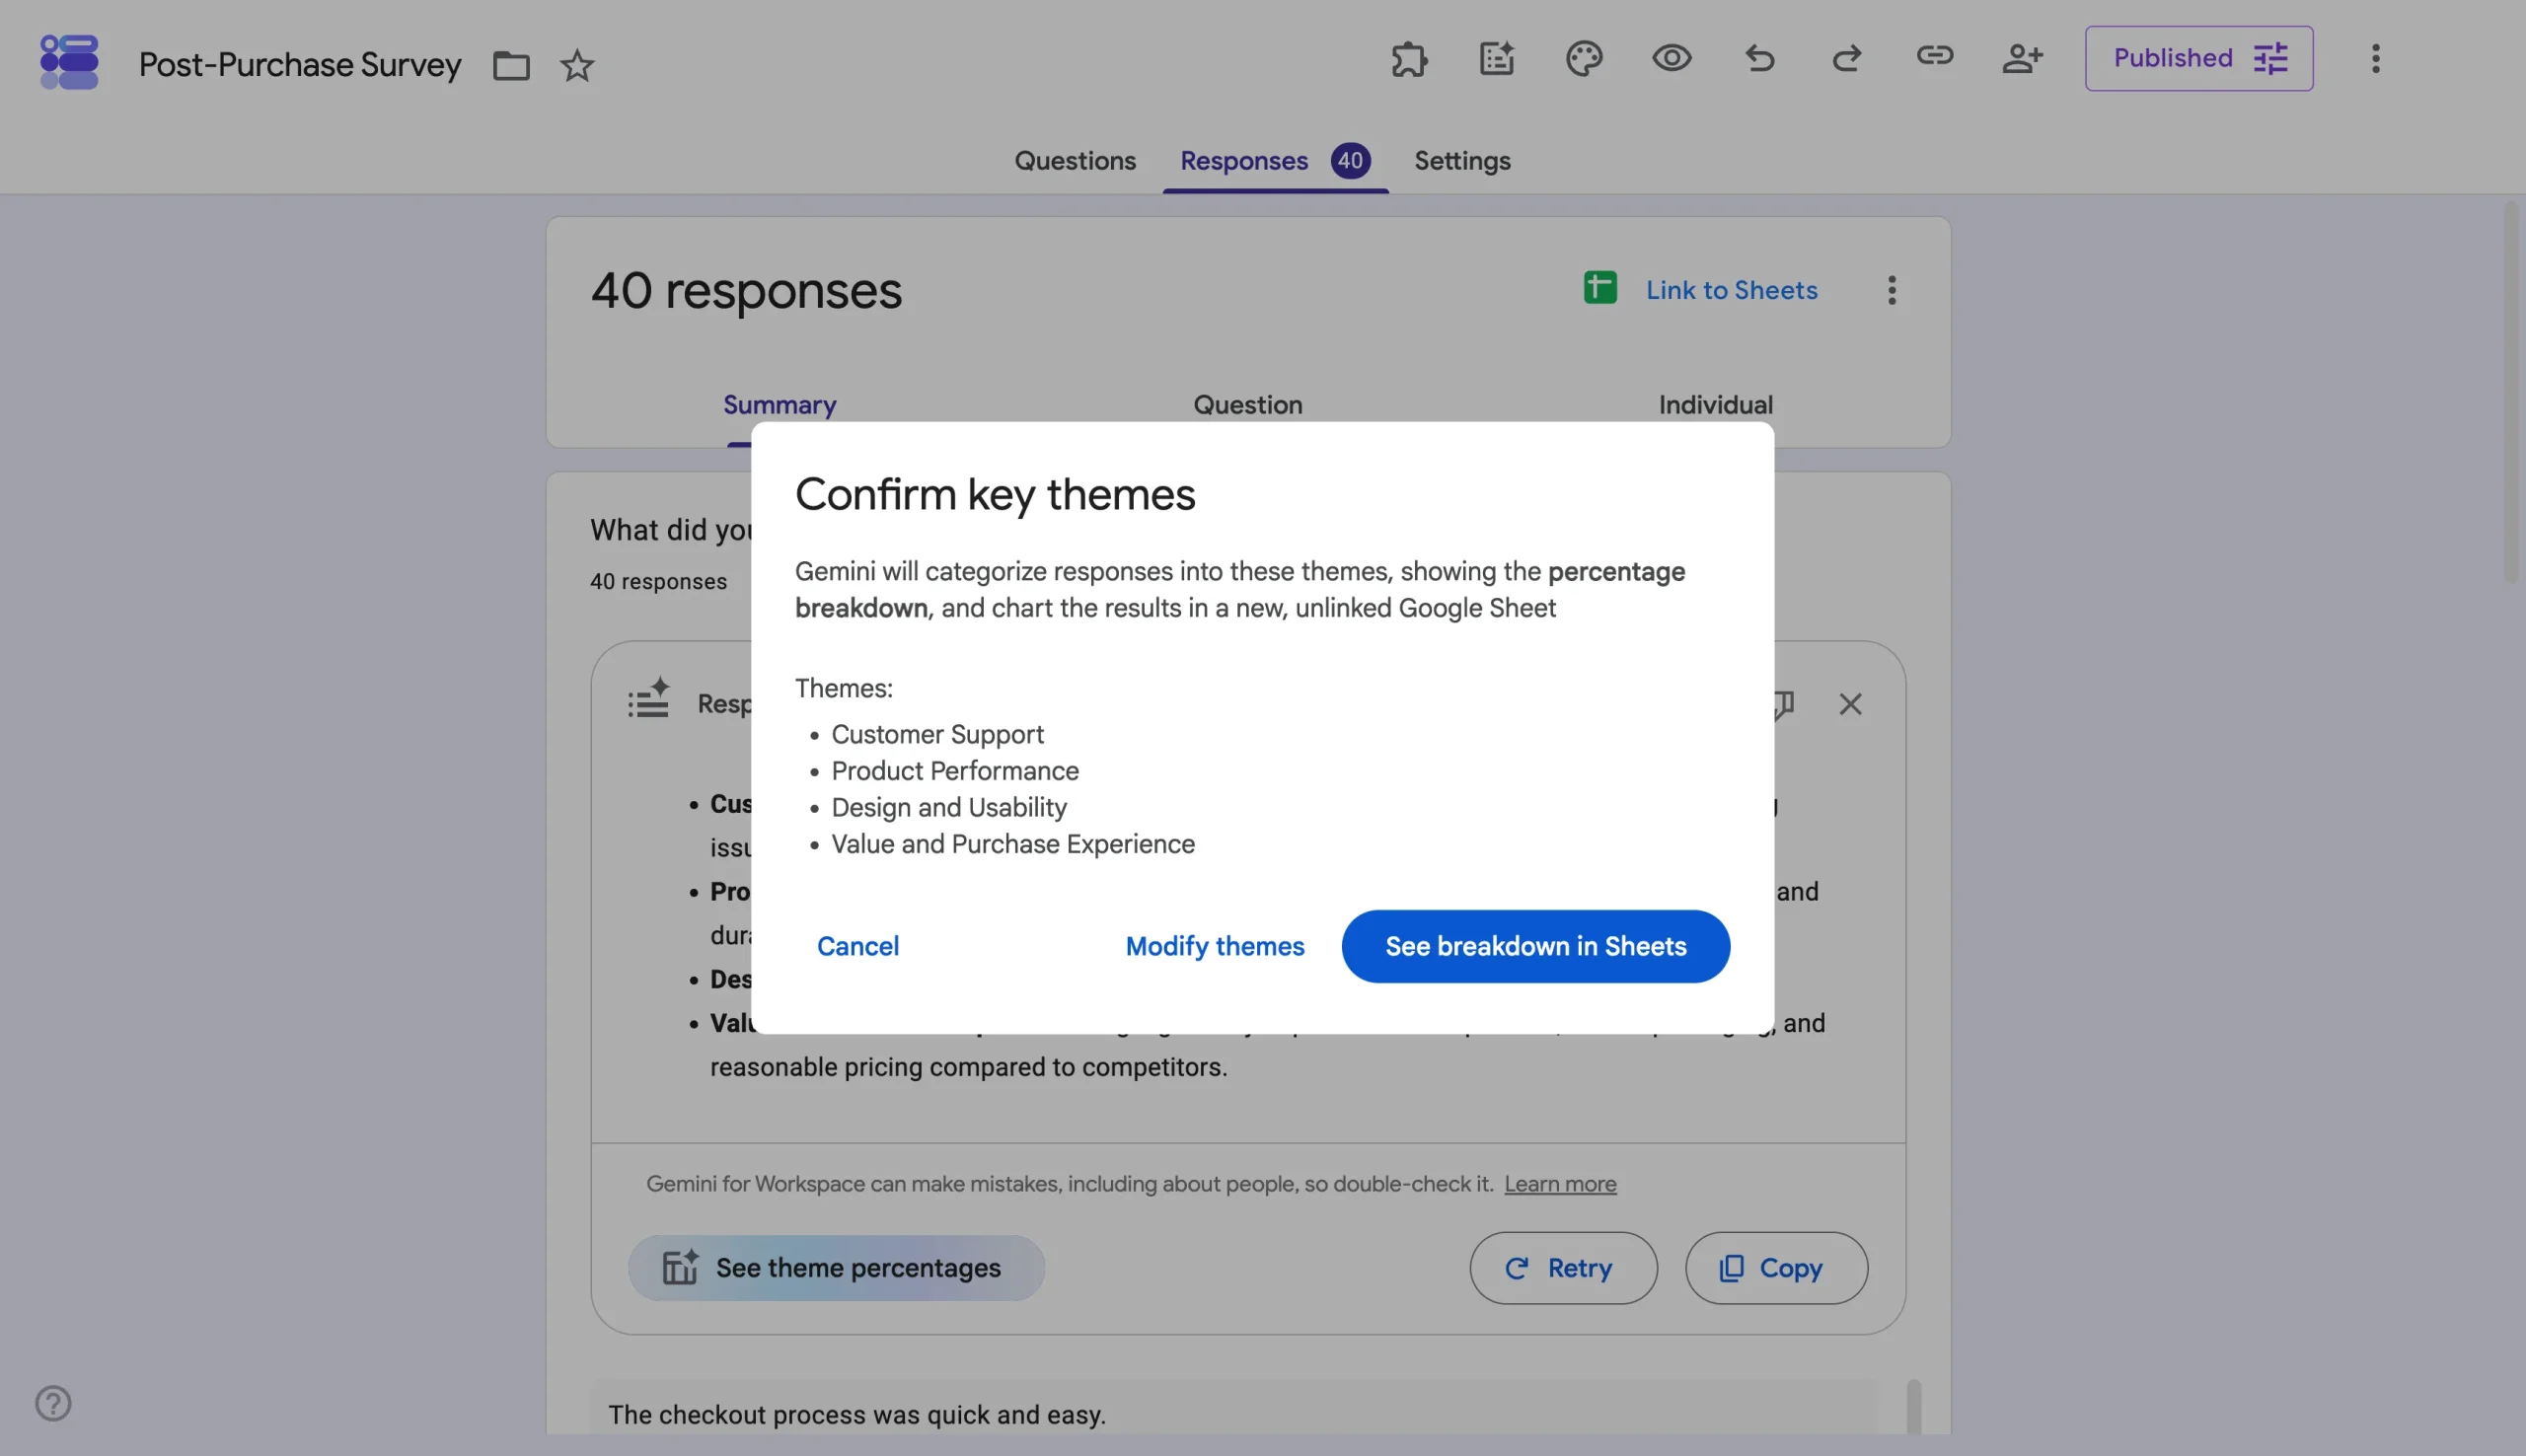
When you click See breakdown in Sheets, Gemini creates a new Google Sheet with a chart showing how responses are distributed across themes and a count of responses under each theme.
In my post-purchase survey, the theme breakdown for “What could we improve?” showed that 17.5 percent of the 40 respondents mentioned product options, while 27.5 percent mentioned shipping delays.
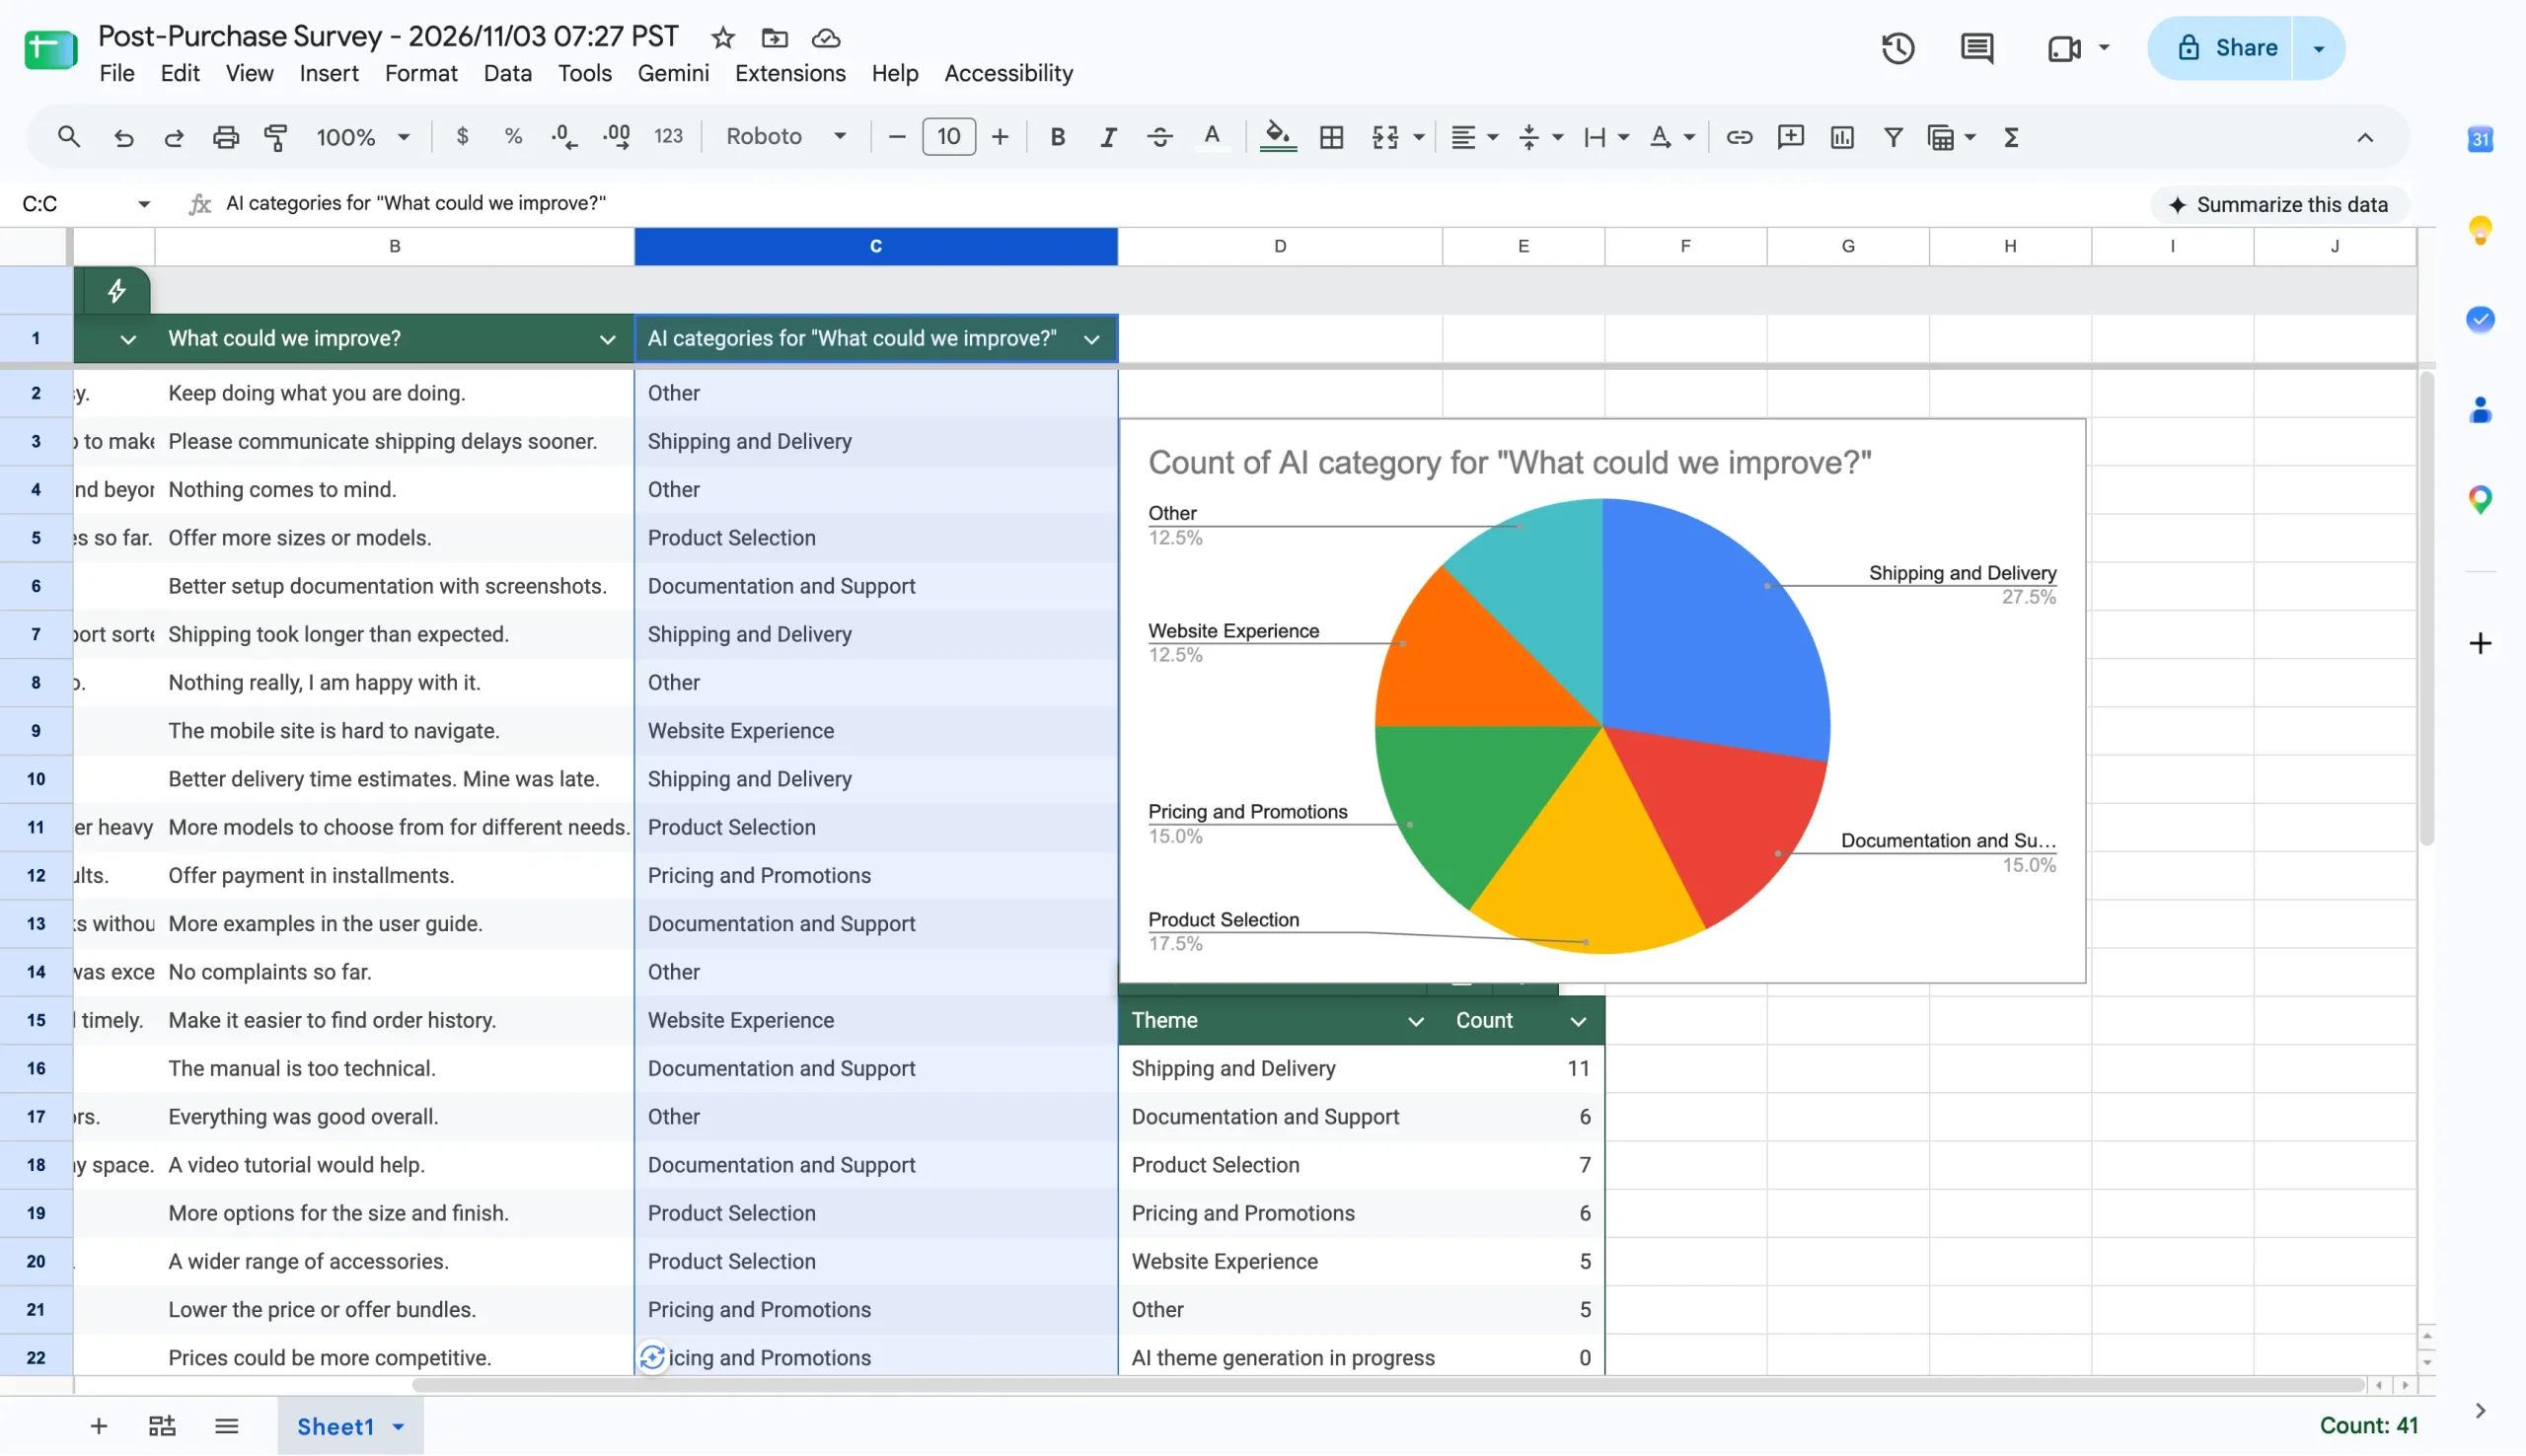
Theme percentages work as an optional shortcut for a quick analysis of open-ended questions, and they’re only available on eligible Google Workspace or Google AI plans. A complete analysis still happens in the full response spreadsheet.
To link Google Forms to Google Sheets, open the Responses tab in Google Forms and click Link to Sheets. Every new submission will land in the connected spreadsheet automatically.
Inside the spreadsheet, you can click Ask Gemini at the top right of the sheet to further summarize data, generate formulas, identify trends, and get answers based on your data using simple text prompts. For instance, you can use prompts like “make a bar chart of satisfaction ratings by product.” The chart lands in a new tab with its underlying data. If your data needs tidying, Gemini can handle that too. The AI can sort and filter responses, find and replace text, apply conditional formatting, and create pivot tables — all with a prompt. If you find the AI suggestions distracting, see how to turn off Gemini in Google Sheets for a less cluttered workspace.
Pro Tip
Prefer to clean and analyze your responses by hand? Our guide on how to analyze Google Forms responses walks through filters, conditional formatting, and pivot tables in Google Sheets.
Gemini in Google Forms and Sheets can cover the lightweight data analysis your team needs — like qualitative summaries, theme counts, and charts — without leaving Google’s tools. But it doesn’t save data summaries and is limited by plan eligibility and response volumes, all of which we’ll cover later in this guide. When you need more advanced analysis like comparing answers across questions or turning responses into a full written report, the next option is to export your data to an AI tool.
3. Using a third-party AI tool
Third-party AI tools like Claude and ChatGPT give you more room for advanced analysis and can even help you turn results into reports for stakeholders. To get started with them, you’ll need to get your data out of Google Forms. Follow these steps:
- Open your form and click the Responses tab.
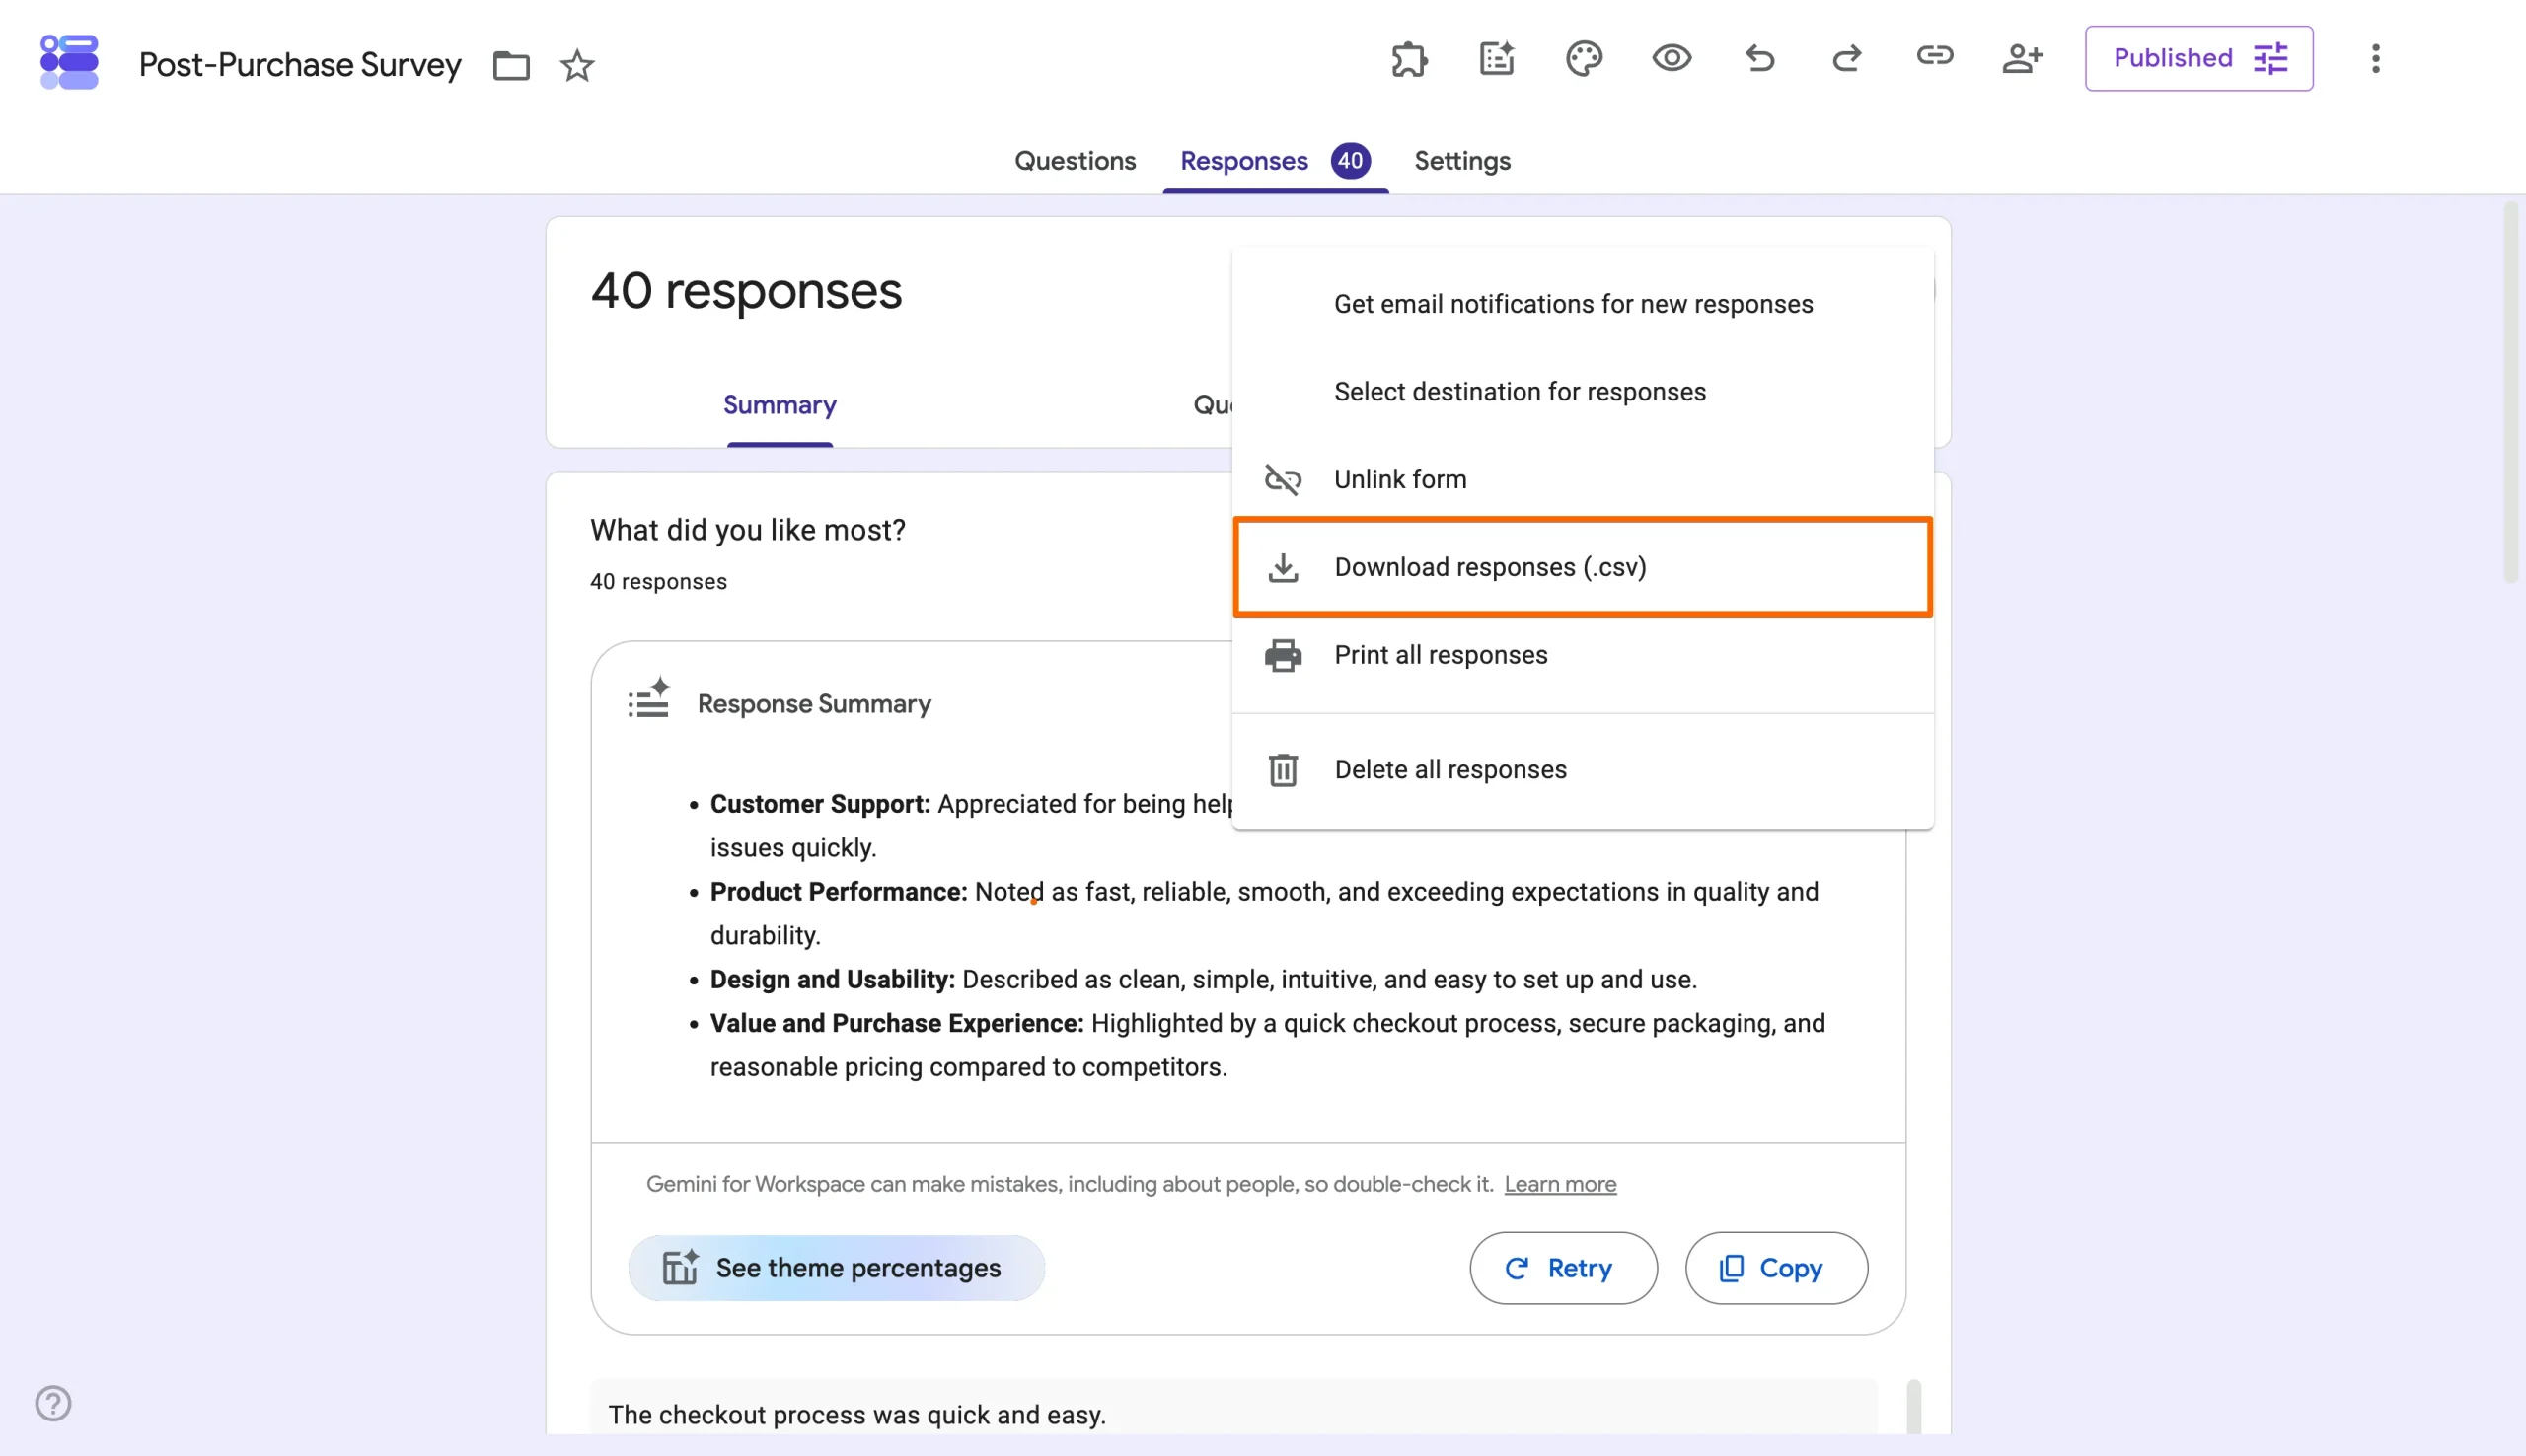
- Select the More button (⋮) next to Link to Sheets, and select Download responses (.csv).
- Open Claude or ChatGPT, click the attachment option in the message box, select Add files or photos, and upload the CSV file.
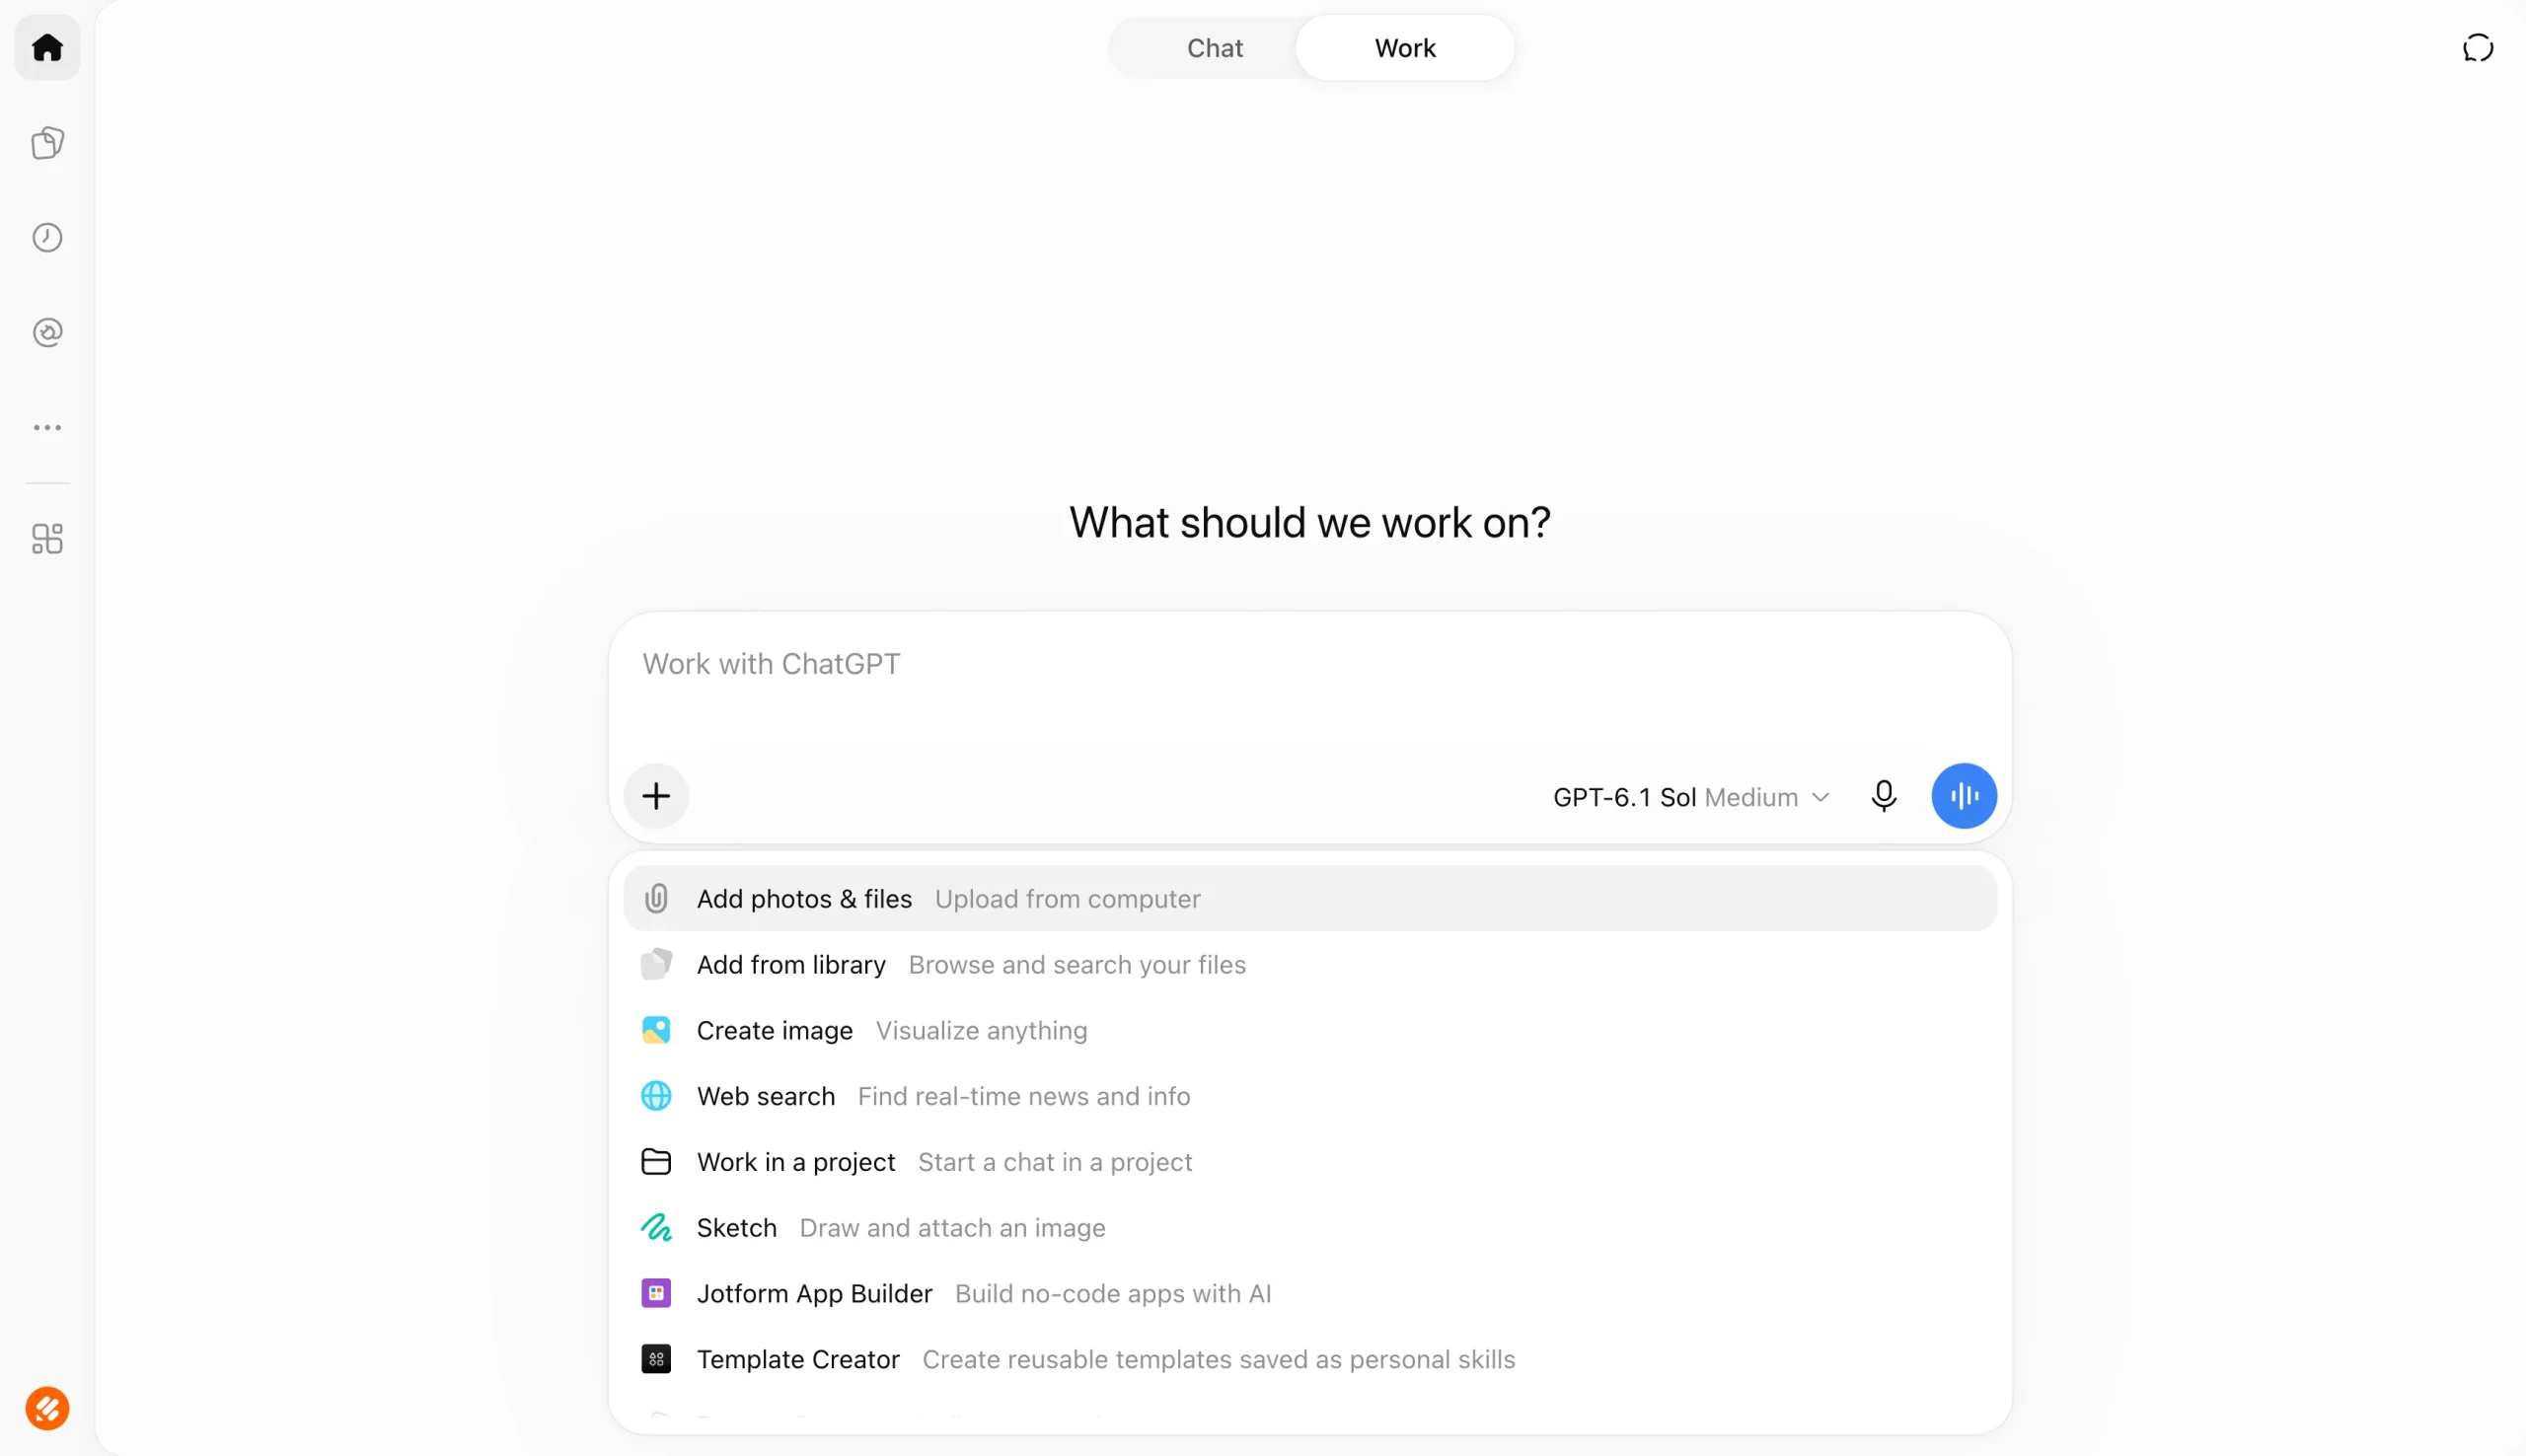
- Write a prompt describing the analysis you want.
Once your responses are uploaded, you can prompt the AI tool to group similar responses into themes, compare answers across questions to see how they relate, analyze and classify sentiment, and flag inconsistent or missing entries before you draw conclusions from the data. You can also use AI to generate pie charts, bar charts, and other visuals from text prompts.
After the analysis, the tool can create instant shareable reports complete with key findings, charts, and recommendations in different formats. That includes PDF, as well as formats compatible with Excel, PowerPoint, and Word.
With AI tools, the more specific your prompt, the more useful the output. So, be clear about the questions you want analyzed, the data points you want the AI to look for, and the format you want the results presented in.
The limits of using AI with Google Forms data
Even though the AI tools we’ve covered handle much of the manual reading and sorting involved in Google Forms data analysis, the workflow around them still has a lot of friction. For instance, access to Gemini depends on having an eligible Google Workspace or Google AI plan. If you’re on a personal account, you’ll need a Google AI Plus, Google AI Pro, or Google AI Ultra subscription since response summaries aren’t included in free personal accounts.
What’s more, Gemini in Google Forms summarizes only open-text answers like short answers and paragraph questions. It skips direct questions like names and addresses, and it doesn’t summarize quiz responses. Plus, the summaries work only on desktop, are available only in English, and appear only for forms with three to 200 responses.
For anything beyond a quick summary, you’ll need to move your data into Google Sheets or export it as a CSV file for analysis somewhere else. Gemini’s summaries in Forms aren’t saved, either, which means you’ll need to copy them or generate them again each time you return to the form.
Creating Google Forms reports adds another manual step. Since the charts that Gemini generates don’t update as new responses come in, keeping them current means rebuilding them manually in Sheets or in Looker Studio.
In addition, follow-up actions like sending emails or notifying teams of new responses require a separate automation tool like Google Workspace Studio, Zapier, or n8n. Even using AI tools like Claude and ChatGPT requires extra steps: Every analysis begins with downloading the CSV, uploading it, and writing a prompt clear enough to produce usable results.
If you’re running occasional surveys and lightweight analysis, Google Forms paired with Gemini or a third-party AI tool might cover what you need. But for teams that regularly analyze large volumes of form data, a more integrated system like Jotform — where responses, analysis, reports, and follow-up actions live in one place — will be more beneficial.


Why you should use Jotform for AI form data analysis instead
Most of the friction in Google Forms data analysis happens between tools, because every handoff adds an extra manual step before you get presentable results. Jotform collapses that process by keeping the entire workflow of data collection, analysis, report building, and follow-up actions in one place.
Instead of moving responses from your form into Claude, Sheets, CSV exports, and other reporting tools, Jotform is set up so that all form submissions flow directly into Jotform Tables, where they’re automatically organized into appropriate rows and columns. Here, you can view your data in different ways, including table, card, calendar, and report views. You can search and filter entries, add formulas and calculations, and assign records to teammates with custom access settings. Action buttons also let you send emails, create PDFs, and send data to other tools without leaving your table.
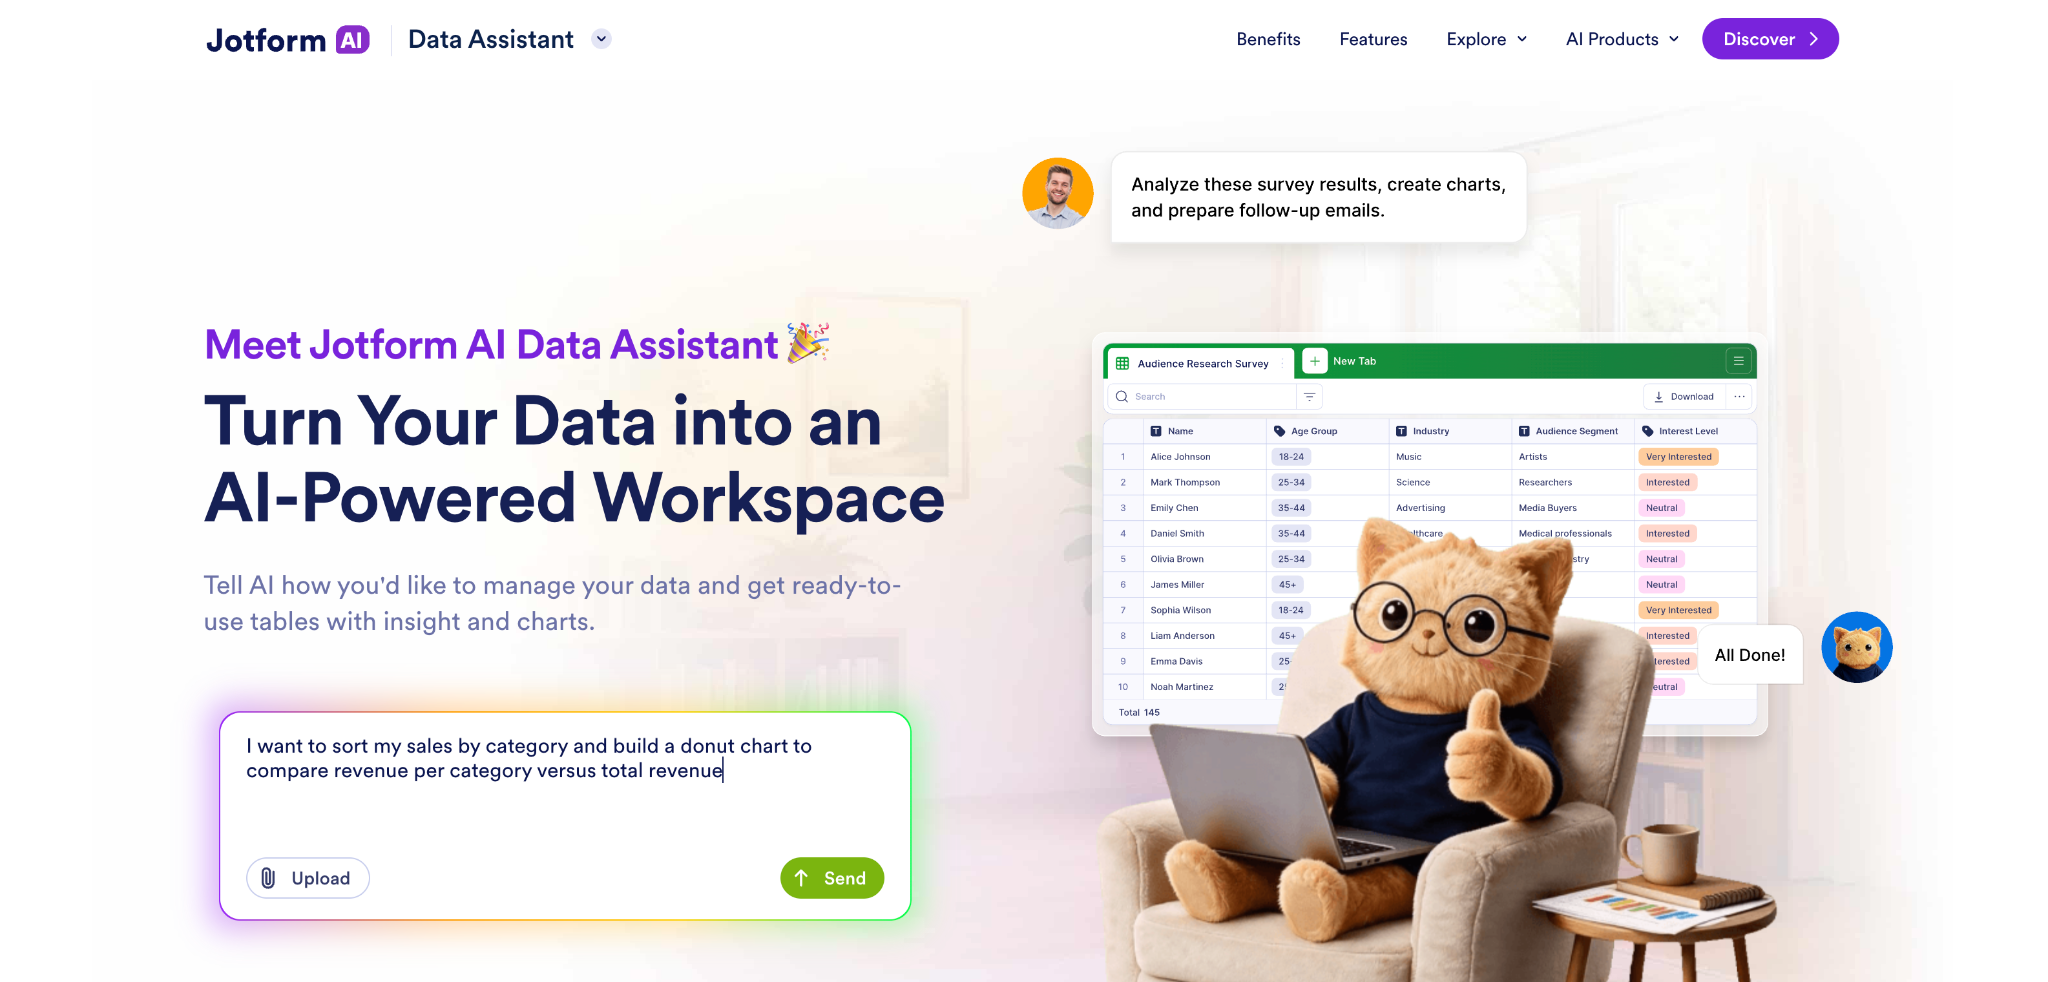
Inside Tables, you can use the Jotform AI Data Assistant to analyze and categorize responses, as well as generate summaries, totals, trends, and recurring themes. The AI handles both structured data, like ratings and multiple-choice answers, and open-ended responses. It also flags records that need attention, such as unhappy customers or incomplete applications, and you can prompt the AI using text or voice.
Once you’re done with your analysis, Jotform Report Builder turns your form data into professional reports and presentations automatically. Reports update with each new submission, so the charts your team views on Friday reflect all the data collected that week — no rebuilding required. You can filter data by date, add your logo and brand colors, and choose from a range of chart options. Sharing reports with stakeholders is quick, too, and can happen by email invitation or unique link, or by downloading them as PDFs for in-person meetings. You can even embed the report on your website, and it’ll update automatically with new submissions.
For follow-up actions like routing low-satisfaction responses to your support team or sending thank-you emails to respondents, Jotform Workflows handles them automatically. You can use conditional logic to branch workflows based on responses, assign tasks, request approvals, send emails and reminders, and connect your form data to your business-critical apps like cloud storage and CRMs.
Already using Google Forms? Migrate to Jotform and use Jotform AI Data Assistant
Even if you’re already using Google Forms, you can still enjoy a smooth data collection and analysis workflow in Jotform without starting from scratch. Jotform’s Google Forms migration tool imports your existing forms with their questions, structure, and responses so you don’t have to rebuild them one field at a time. Here’s how it works:
- Go to Jotform’s Google Forms migration page and click Migrate Your Forms to Jotform.
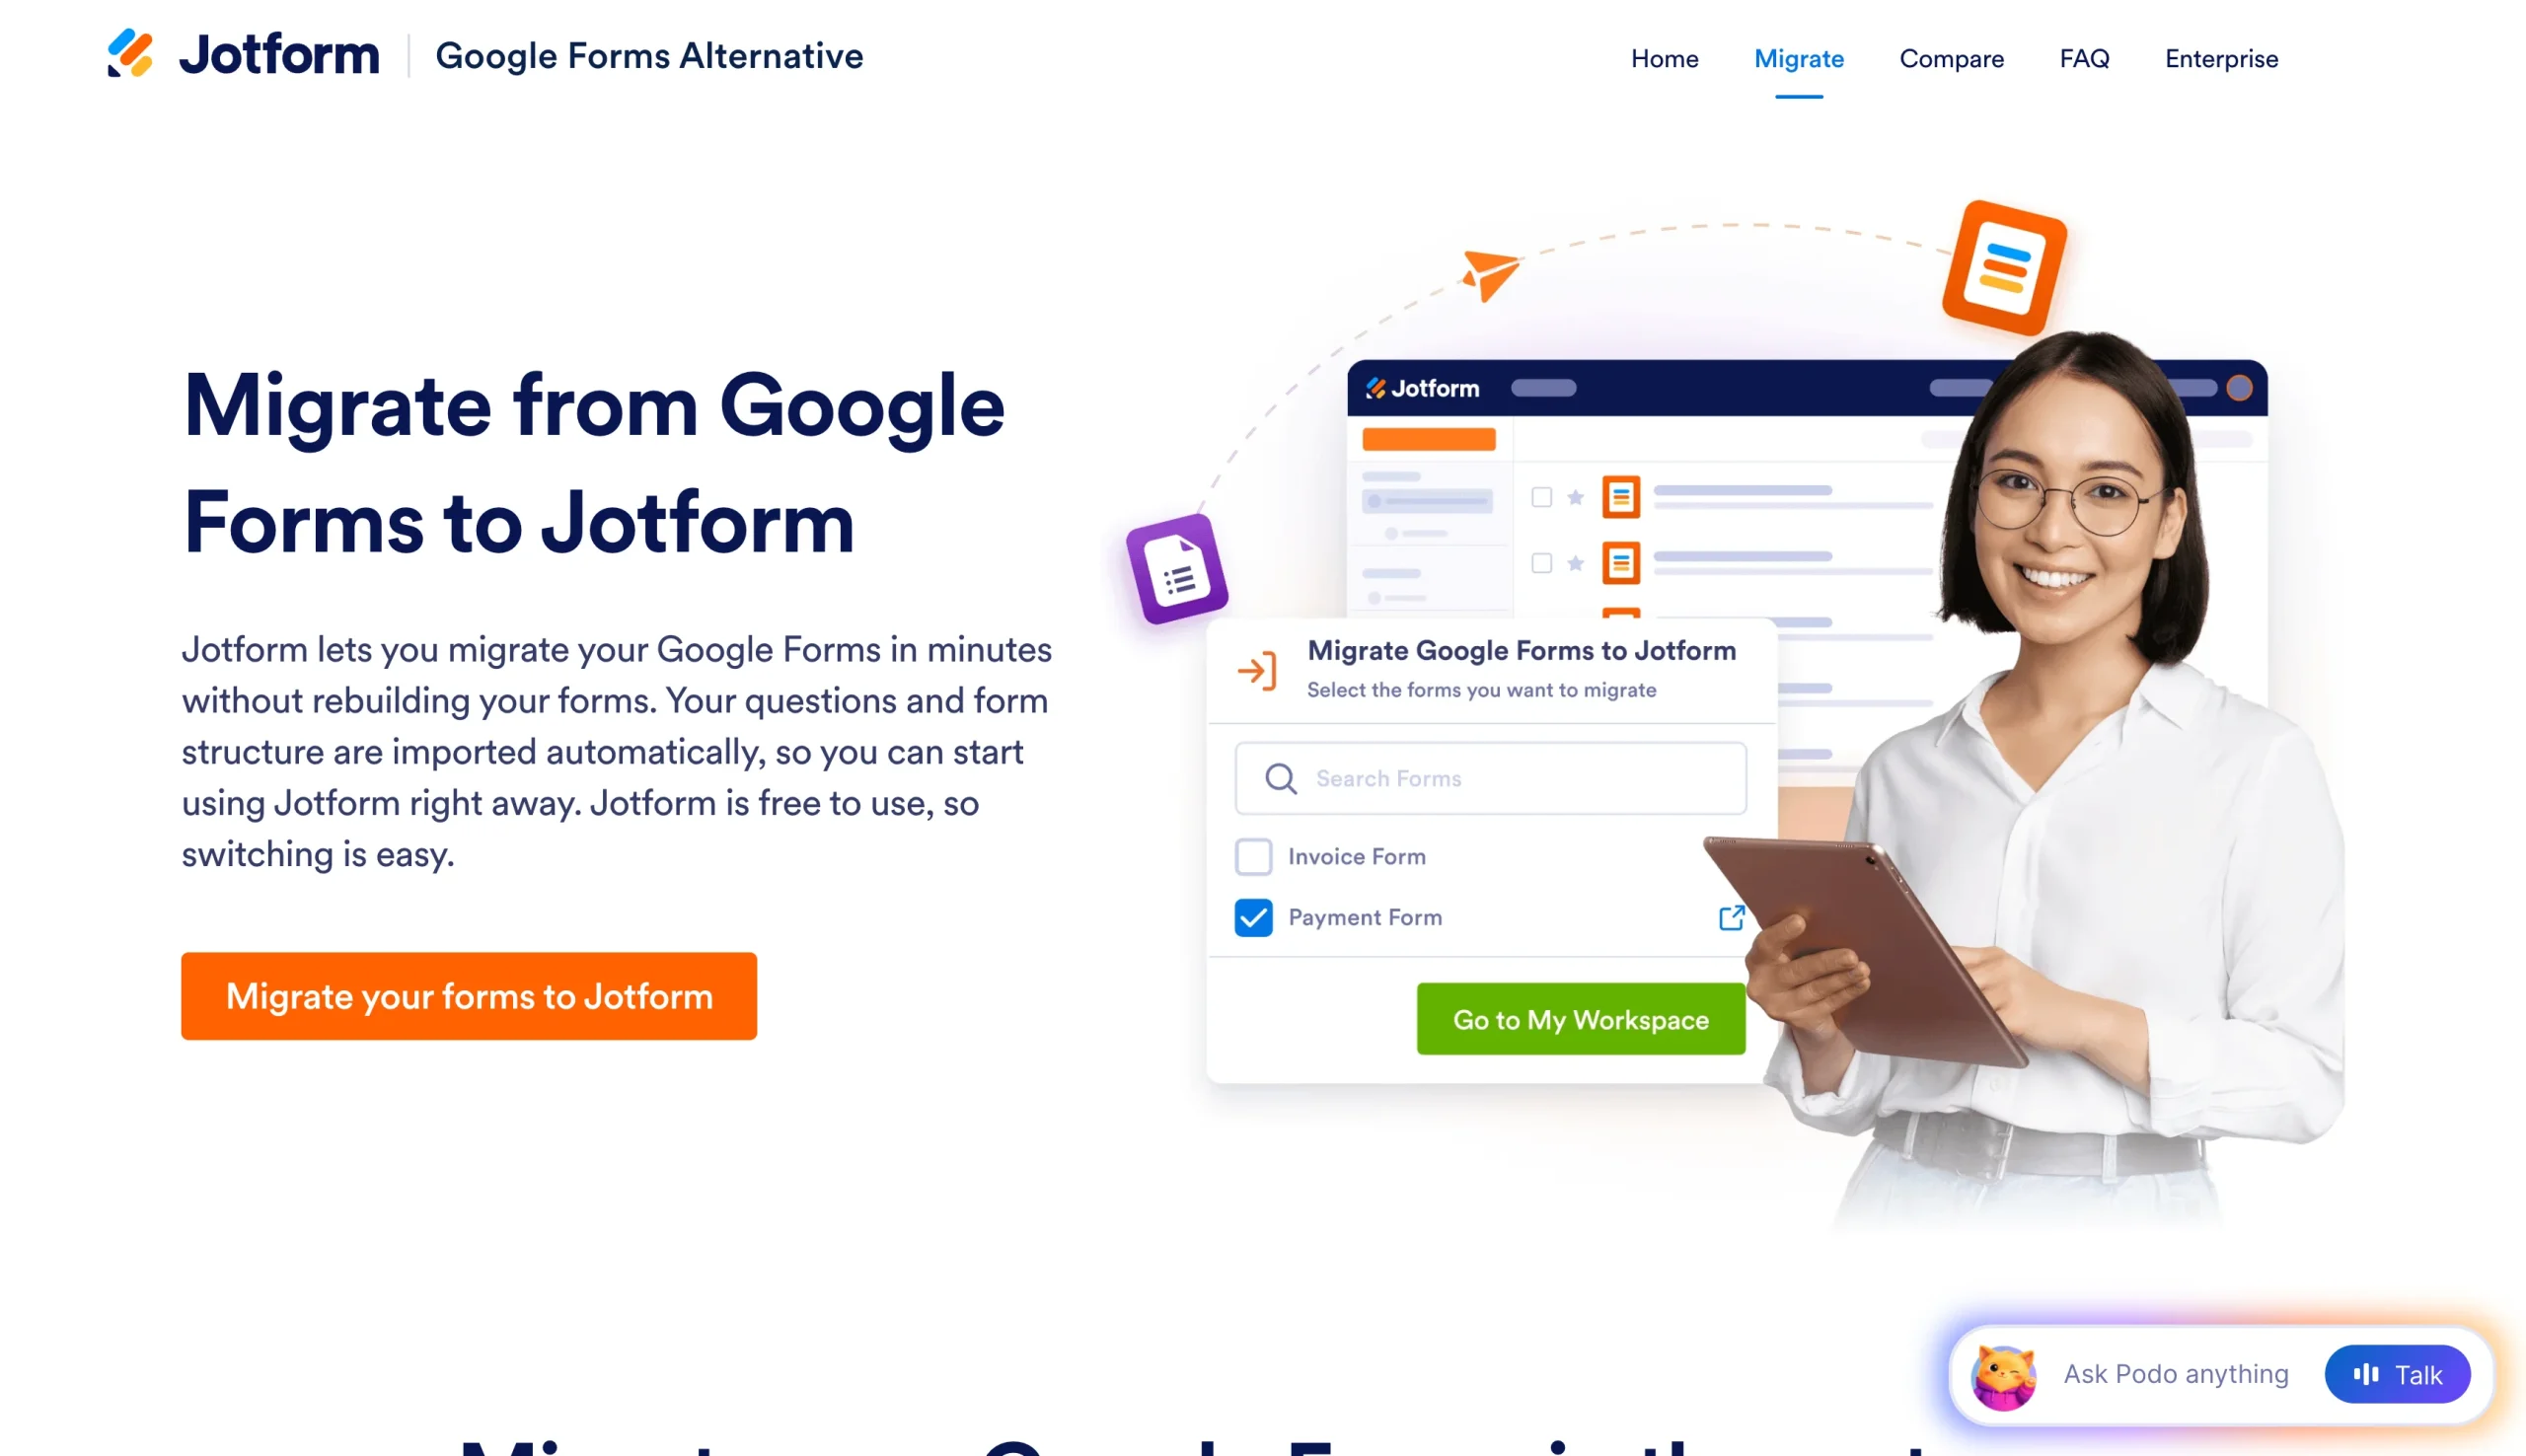
- Sign in with your Google account and allow the permissions Jotform needs to access your forms.
- Select the forms you want to import and click Migrate. You can check the Migrate with submissions button if you want Jotform to bring over your responses. A green checkmark appears next to each form once the import is complete.
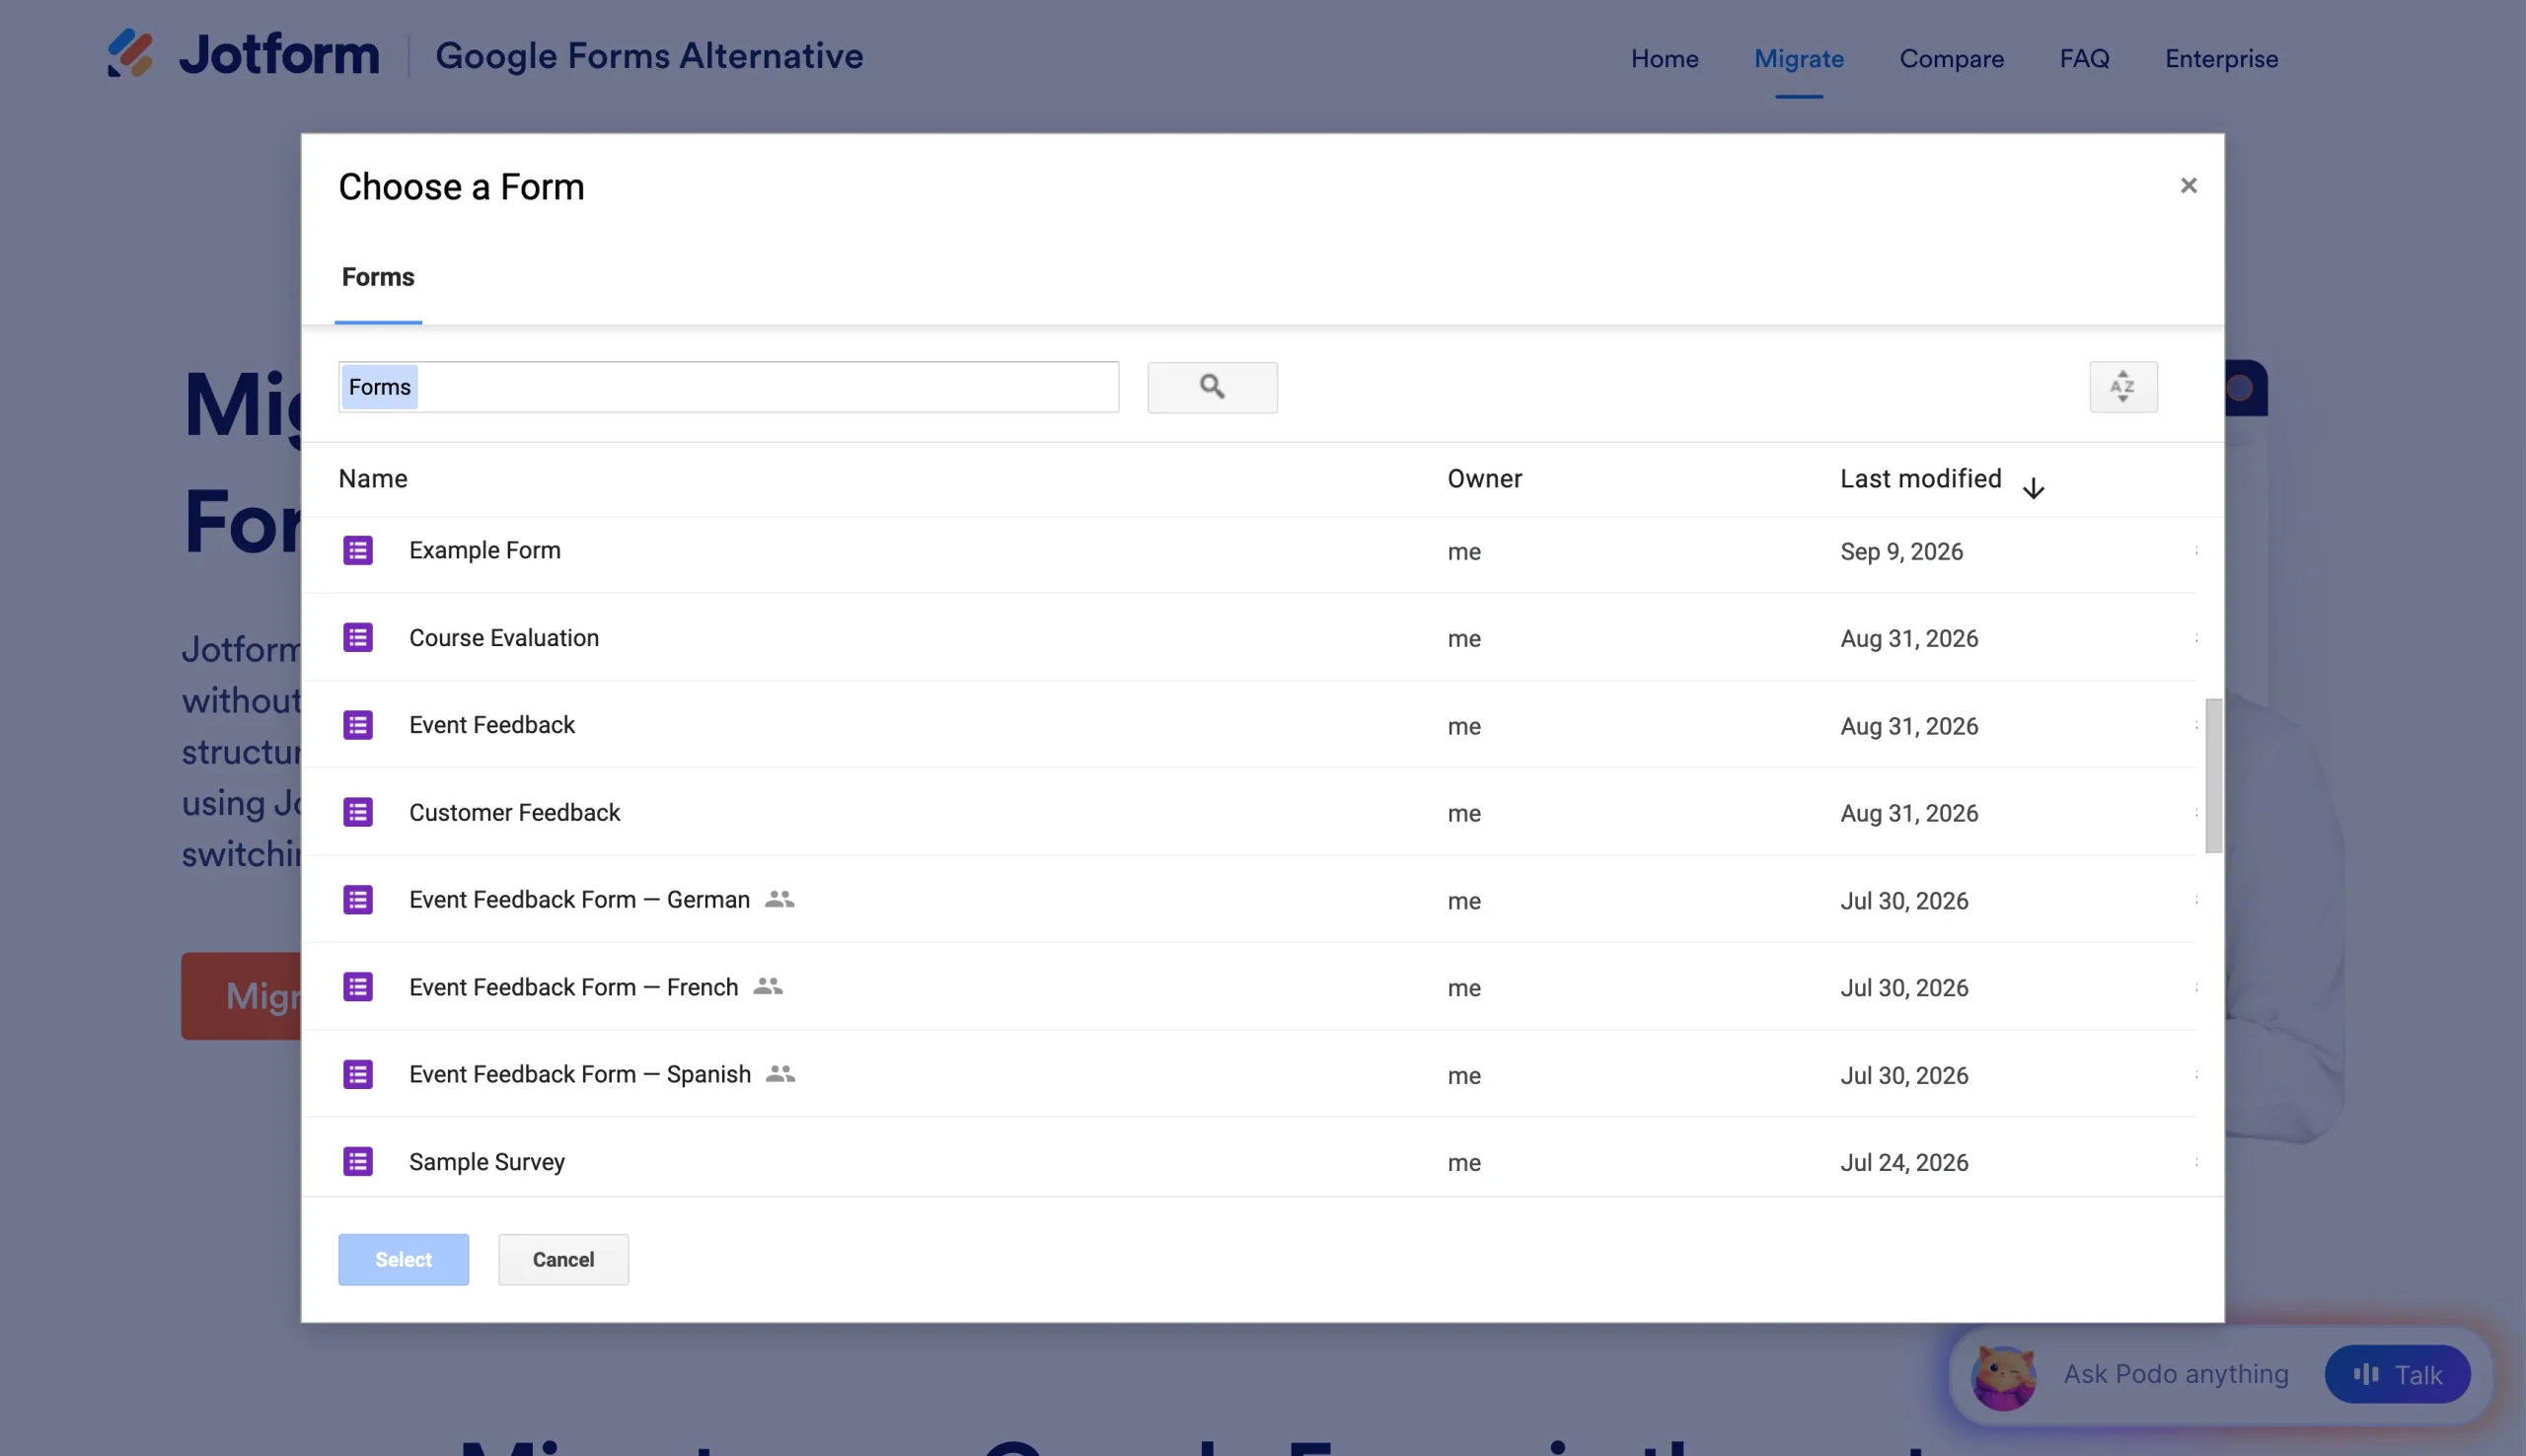
- Click Go to My Forms. Your imported forms sit in the All Forms folder, and each title starts with the prefix “Imported” so you can spot them easily.
Before you share an imported form, review it in the Jotform Form Builder; update the theme, fonts, and colors to match your brand; and add features that Google Forms doesn’t offer natively, like payment collection.
Once your form is live, your imported responses and every new submission land straight in Jotform Tables. From there, you can ask Jotform AI Data Assistant to summarize responses, surface recurring themes, identify trends, and turn your data into charts and other visual formats. Then, you can share live reports and trigger follow-ups without switching tools, and track views and conversion rates with Jotform Form Analytics.
Ready to spend less time sorting through form responses? Migrate Google Forms to Jotform and try Jotform AI Data Assistant for faster form data analysis — it’s available on Jotform’s free Starter plan.
FAQs about Google Forms data analysis with AI
Open your form on a computer and click the Responses tab. In the Summary tab, Gemini automatically summarizes each text question once the form has between three and 200 responses. You can use the theme percentages feature to group answers into themes or link your responses to Google Sheets and use the Ask Gemini side panel for deeper analysis.
Yes, Gemini in Google Forms summarizes short-answer and paragraph responses and identifies common themes. It doesn’t summarize quiz responses.
For larger datasets, AI tools like Claude and ChatGPT can analyze an exported CSV file, group similar answers, and classify sentiment across every response.
Yes. In Google Forms, open the Responses tab, click the More icon (⋮), and select Download responses (.csv). Then upload the file to Claude or ChatGPT using the attachment option in the message box.
Gemini requires an eligible Google Workspace or Google AI plan, runs only on desktop, and is in English only. It needs three to 200 responses to generate summaries and deeper analysis, which means moving data into Sheets or a CSV file. Plus, reports require manual assembly, follow-up actions require a separate automation tool, and AI tools like Claude also need fresh exports to analyze new responses.
For teams that analyze form data regularly, yes. Jotform keeps collection, analysis, reporting, and follow-up in one platform. Submissions flow into Jotform Tables, where Jotform AI Data Assistant summarizes responses and surfaces themes. Jotform Report Builder creates reports that update with each submission, and Jotform Workflows automates follow-ups.
This article is for Google Forms users, educators, marketers, researchers, HR teams, customer feedback teams, and small business operators who collect responses in Google Forms and want to use AI to summarize results, identify themes, analyze open-ended answers, and create clearer reports without doing everything manually in Sheets.
































































































Send Comment: