
Google Forms is an online form builder that works well for simple surveys, basic feedback forms, and straightforward registration processes. However, collecting data is only the first step. To get real value from your data, you need to analyze it for insights, trends, and patterns.
In this article, we’ll show you how to analyze data from Google Forms using its built-in analysis tools. We’ll also explain how to export responses from Google Forms to Google Sheets and show you data visualization techniques and advanced analysis methods.
Plus, we’ll introduce an alternative form builder that helps you get deeper insights from your data: Jotform.
Pro Tip
Want to make sure you’re getting the most out of Google Forms? Check out our articles “How to use Google Forms” and “How to create a Google Form” for strategies to optimize the form builder for the best data collection.
Where Google Forms stores response data
Google Forms is primarily a data collection tool. However, it does offer some basic features for storing and analyzing response data. Here are the key points you need to know:
- All collected data lives in the Responses tab: When data starts coming in, you’ll be able to see responses in Google Forms under Responses. If you haven’t collected any data yet, this section will be blank.
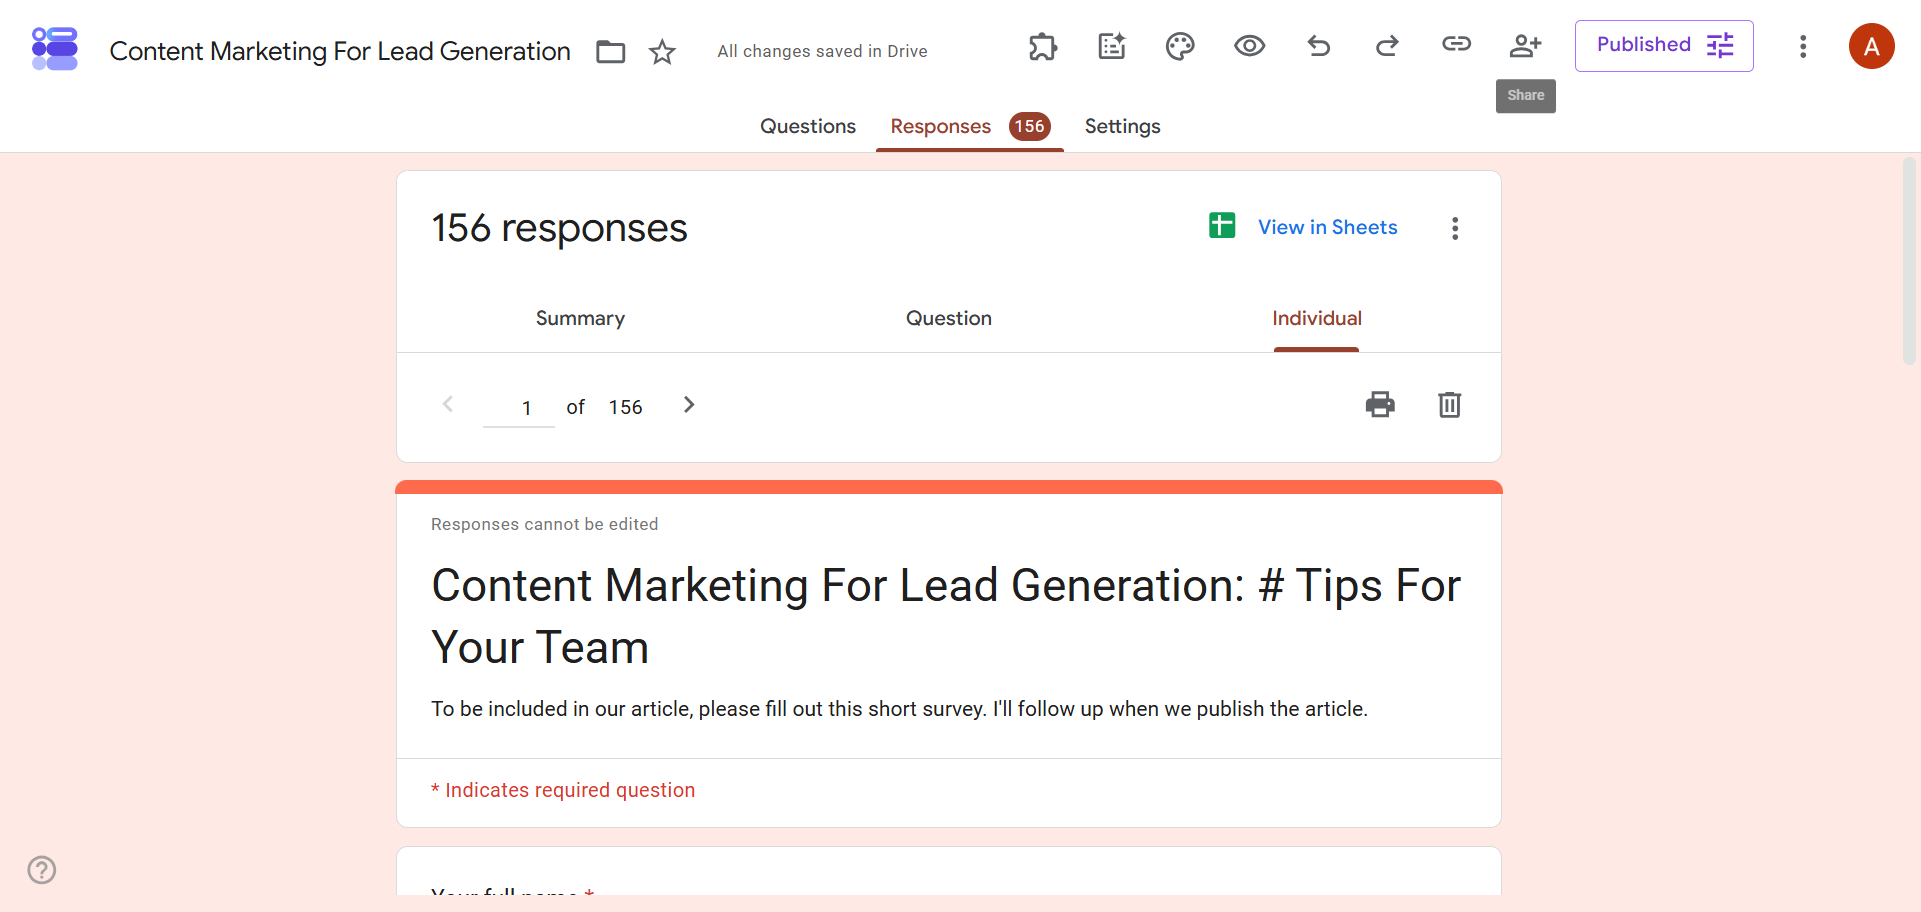
- The Responses tab has three ways to view your data: You can see all responses, along with automated charts and graphs, in the Summary tab; responses by question in the Question tab; and individual responses in the Individual tab. All three options sit under the larger Responses tab.
- You can export data to Google Sheets: Google Forms natively integrates with Google Sheets, so you can export your data from the Responses tab by clicking View in Sheets.
- You can download data as a CSV file: To view your data in CSV format, click the three vertical dots next to View in Sheets, and select Download responses (csv).
How to analyze data using Google Forms’s built-in tools
If you’re looking to analyze survey data using the built-in tools in Google Forms, follow these step-by-step instructions. You’ll need a Google Form with responses ready before you begin.
- Open the Google Form with the responses you want to analyze.
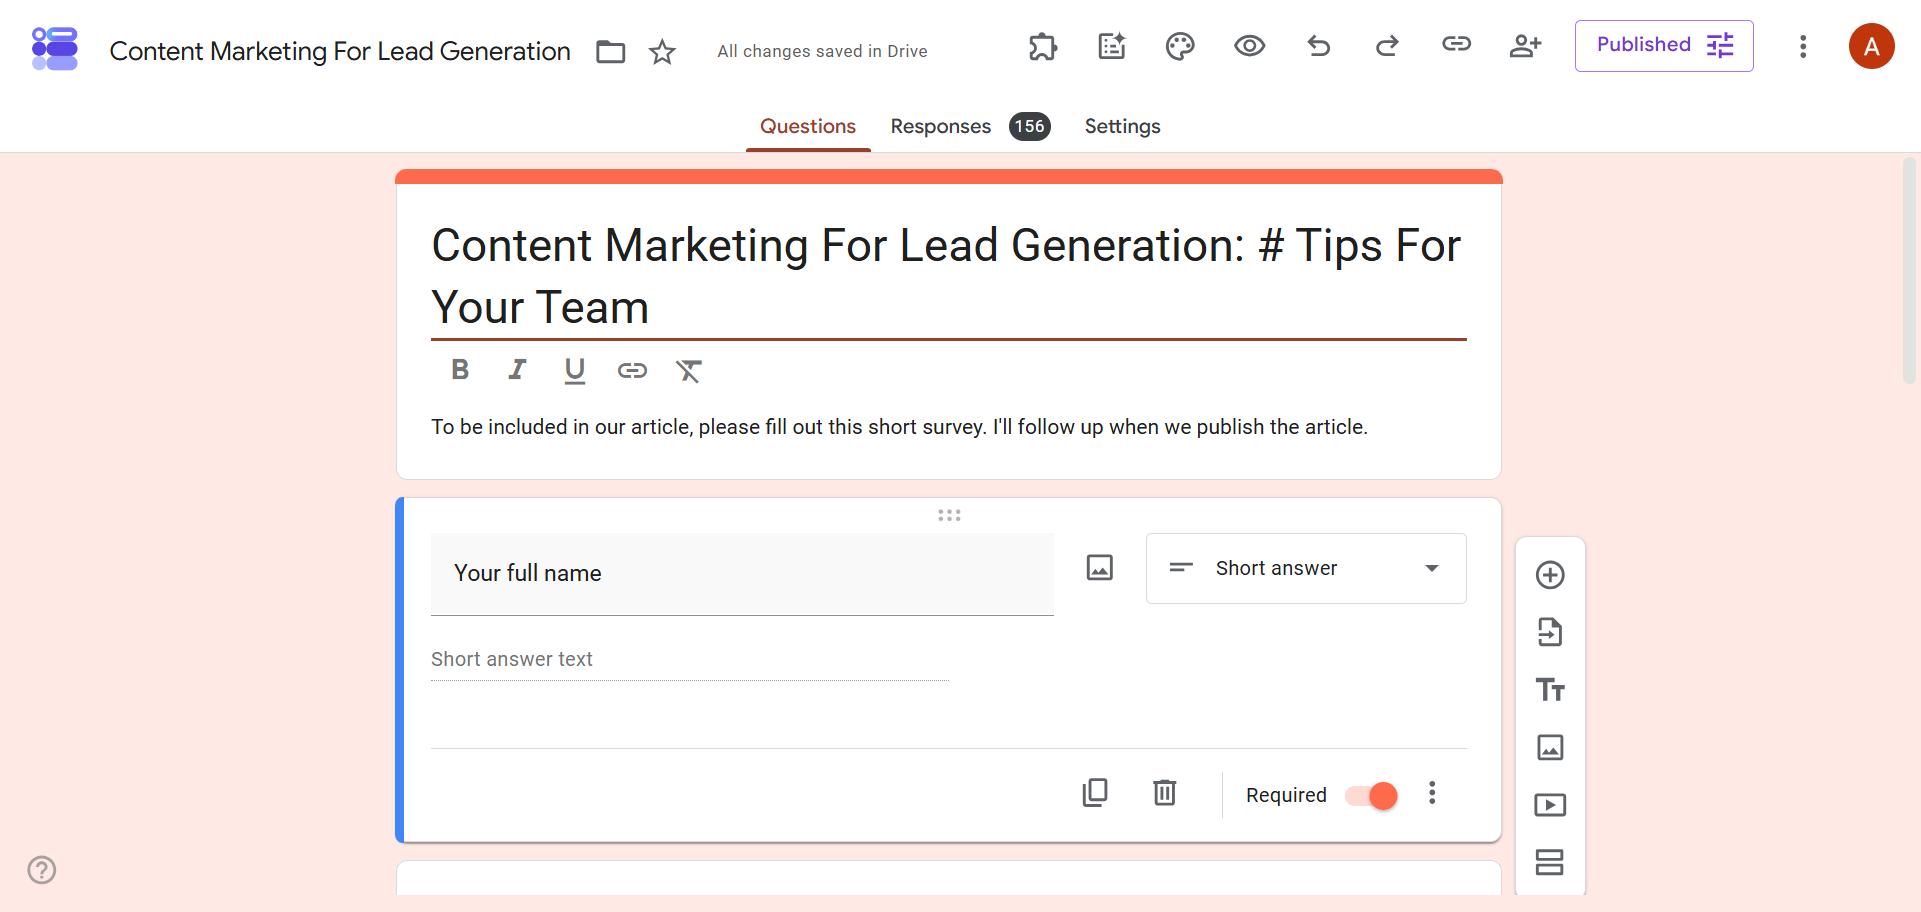
- Click Responses. Google Forms lets you view data in three ways: Summary (a compilation of all responses), Question (responses for each question), and Individual (all responses for each individual respondent).
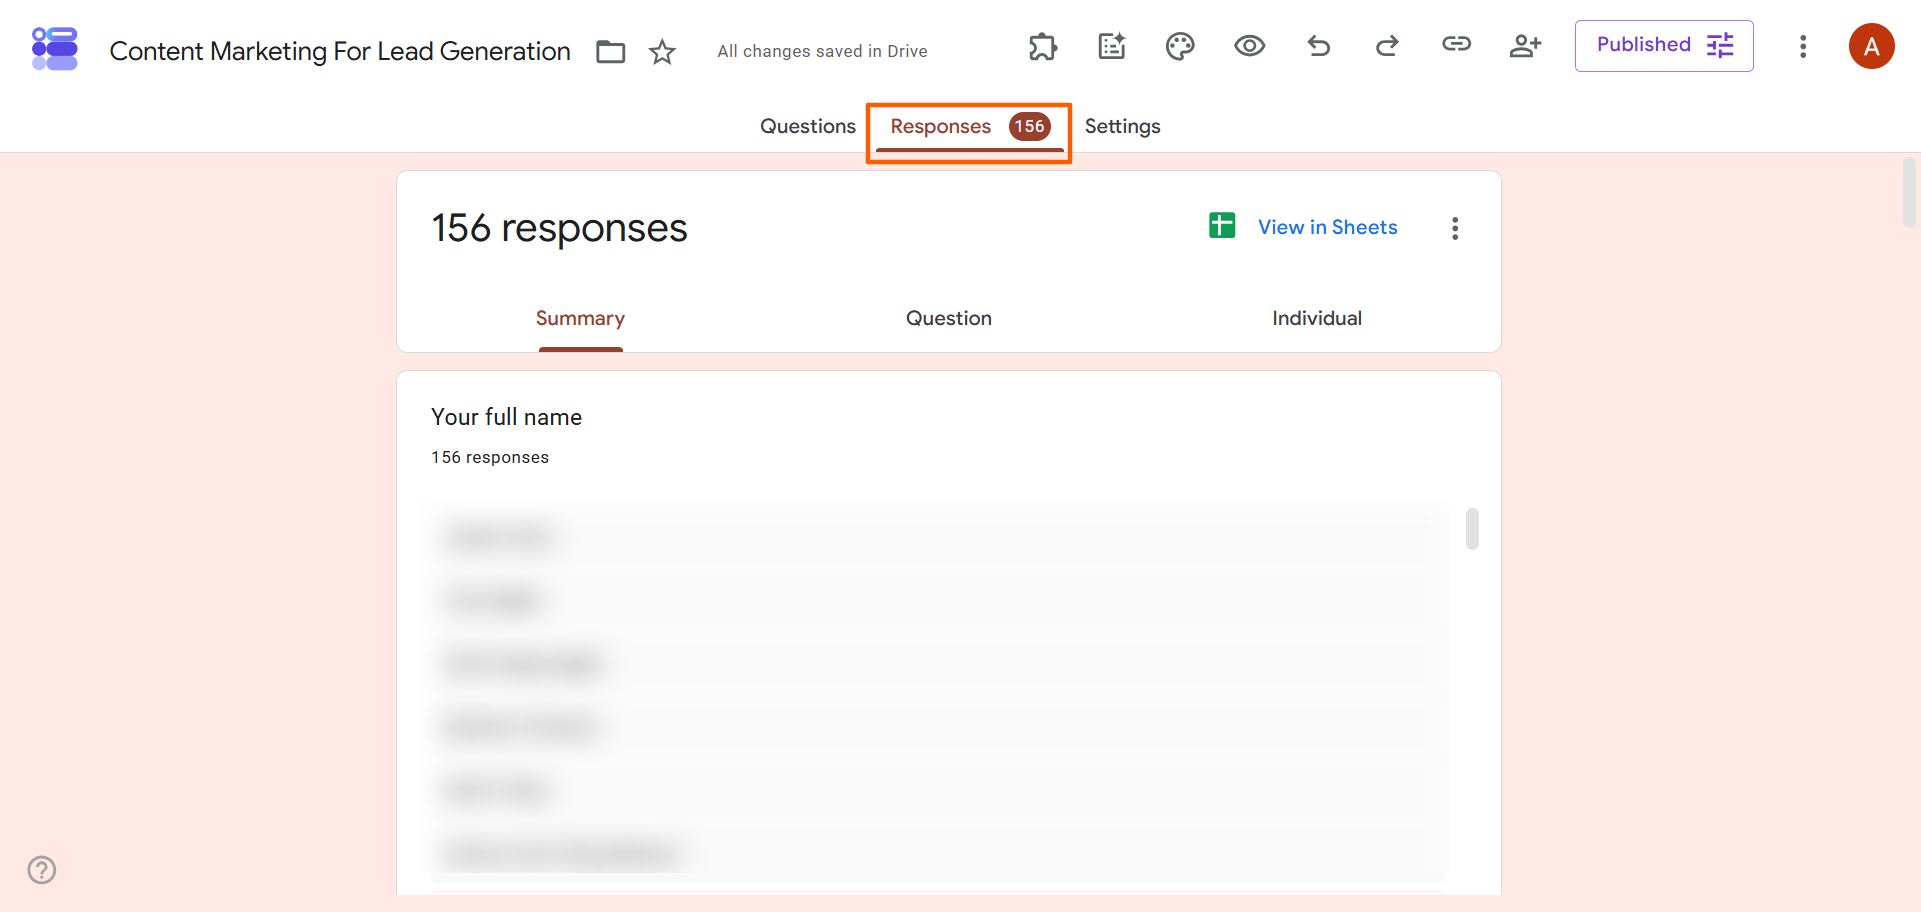
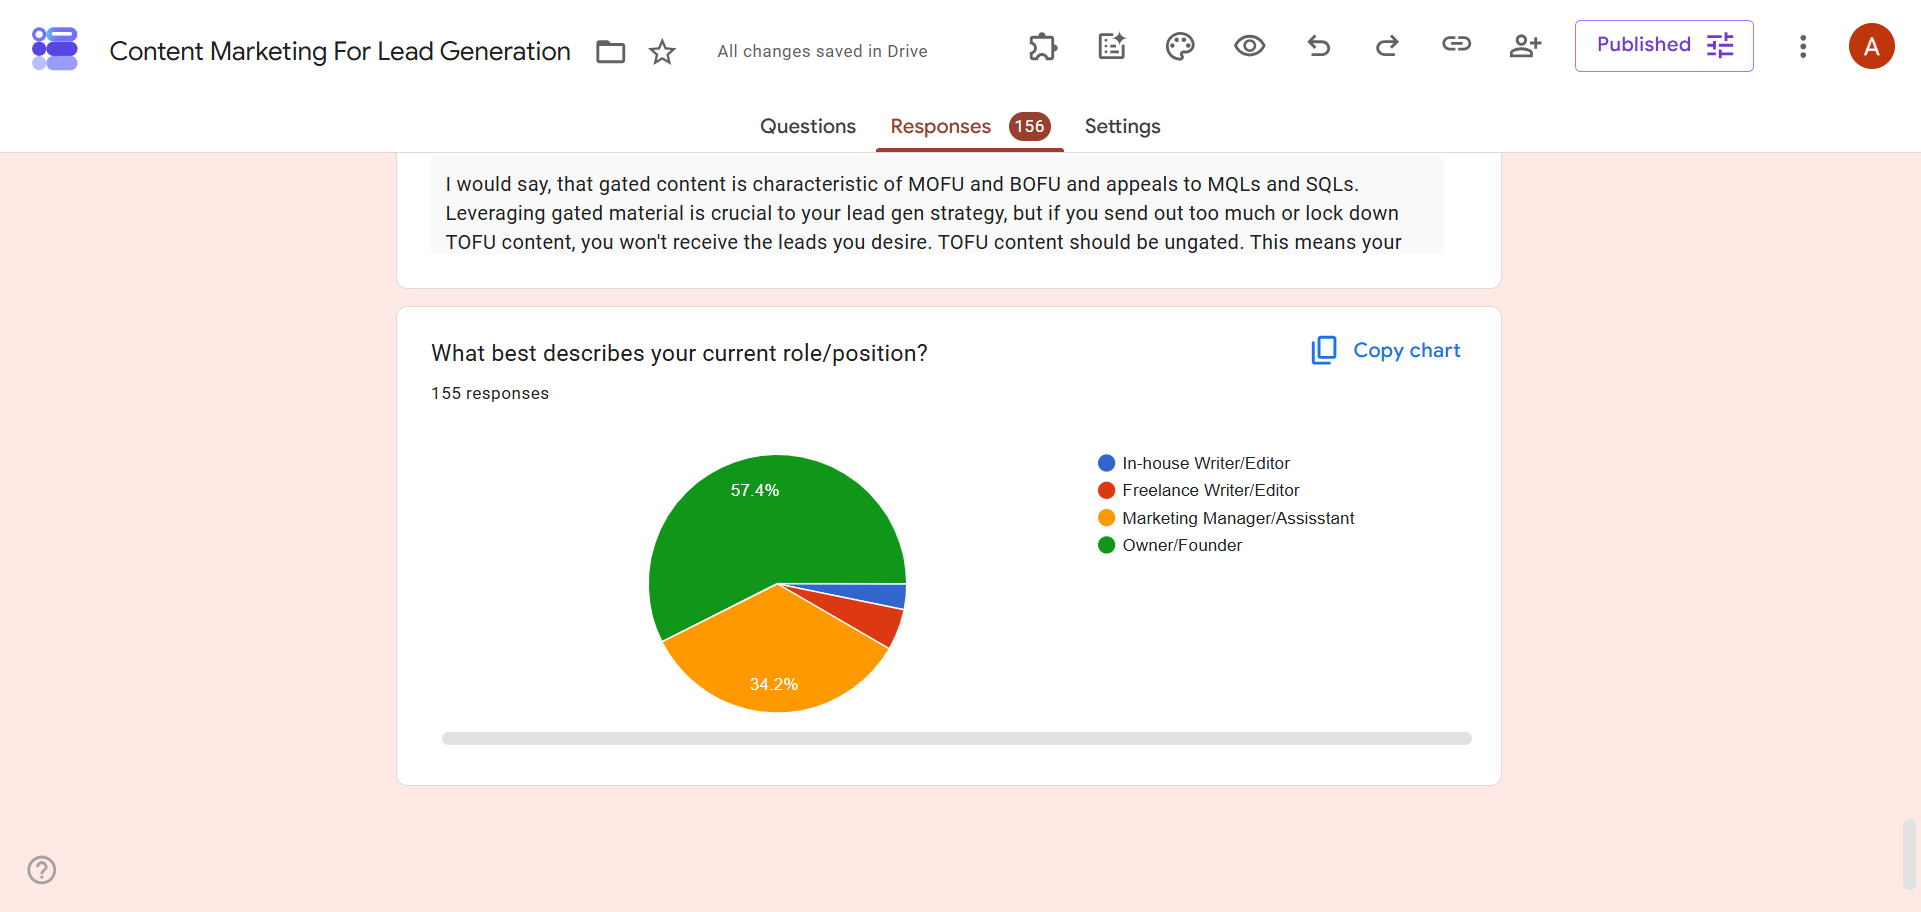
- Click Summary. For quantitative data, Google Forms automatically creates pie charts and bar charts. This view is useful for identifying trends and patterns.
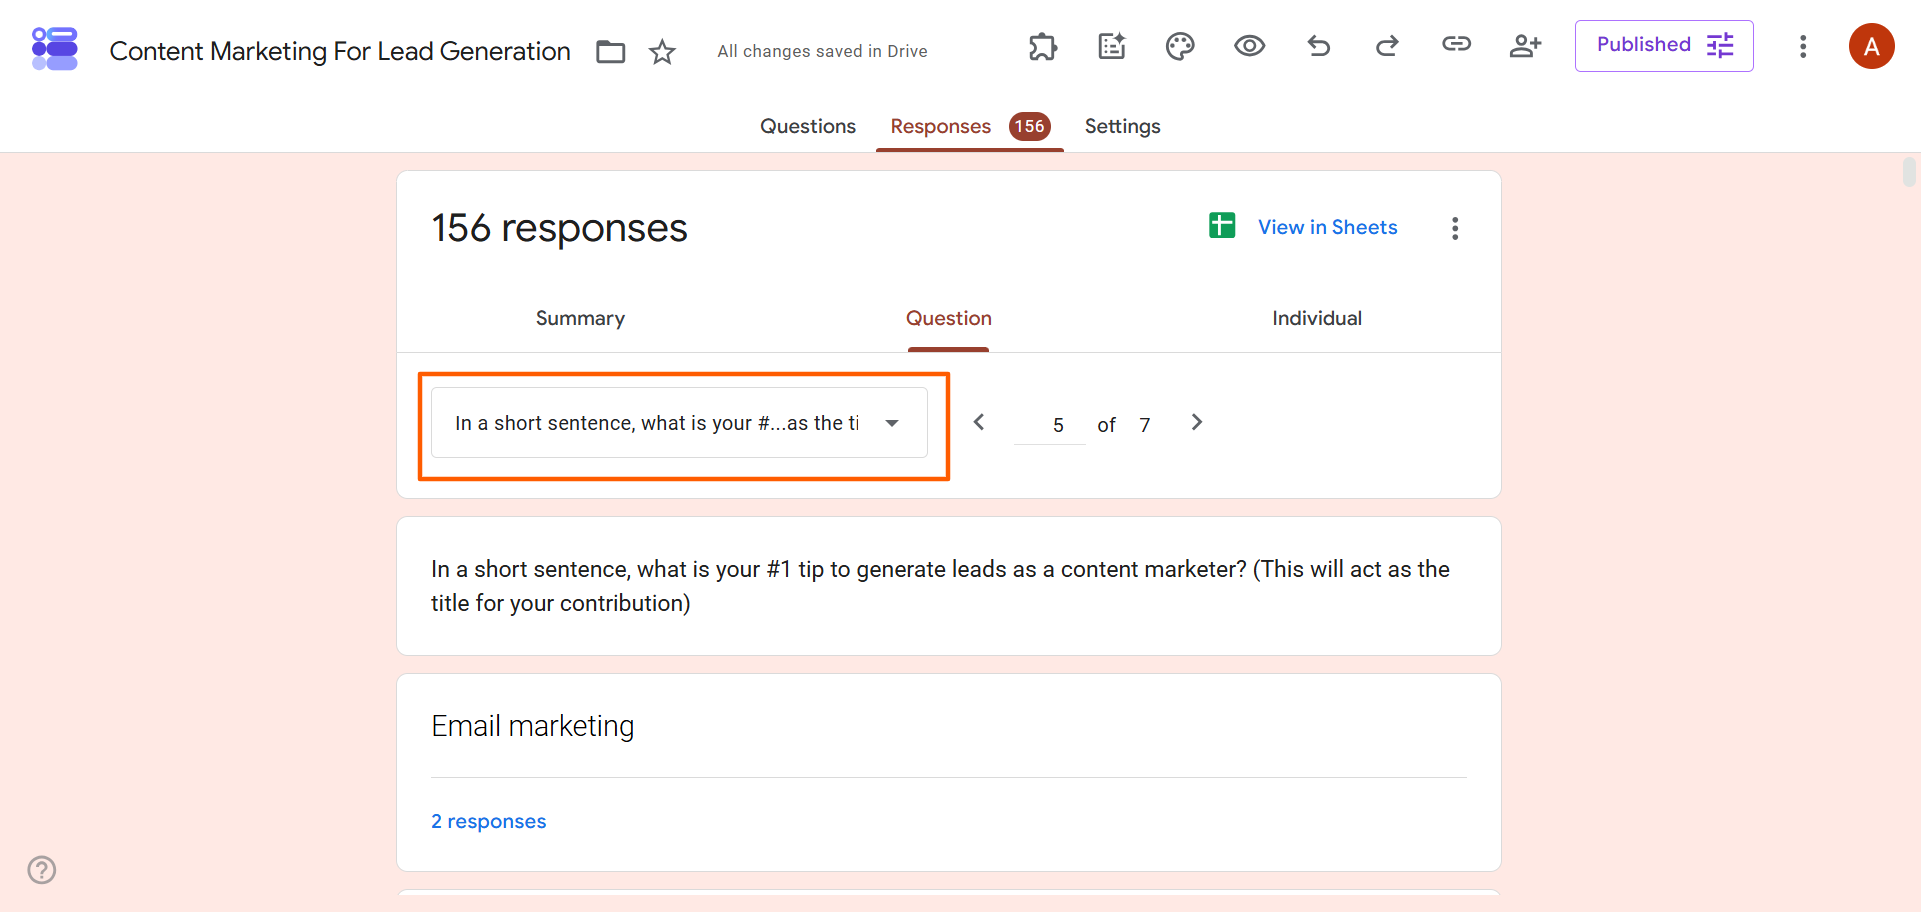
- Click Question. Google Forms breaks down responses by question. Select the question you want to review from the dropdown at the top. This view is useful for spotting patterns, trends, and anomalies related to specific questions.
- Click Individual. Google Forms shows each respondent’s answers. This view is useful for qualitative analysis and getting a closer look at specific users’ responses.
Now that you’ve seen how to analyze data from Google Forms using its built-in tools, you may find that you need more data analysis features. That’s where Google Sheets comes in.
How to analyze Google Forms data in Google Sheets
If you want to get deeper into Google Forms analytics than its built-in tools allow, click View in Sheets in the Responses tab. This exports your data to Google Sheets, where you can glean deeper insights.
For example, if you’re analyzing responses to a customer satisfaction survey, you may want to better understand how customers feel about your business, products, and services by filtering answers or comparing data sets.
Google Sheets offers several advanced ways to understand your data:
- Sorting responses: You can sort responses alphabetically or reverse alphabetically in specific columns.
- Filtering answers: You can create a data filter in Google Sheets to focus on specific criteria. For example, you can filter all responses from users who weren’t pleased with your customer service so you can learn how to improve.
- Using pivot tables: Pivot tables are useful for grouping and summarizing spreadsheet data, especially quantitative data. For example, you can use them to better understand how many customers had a great experience with your business.
- Creating charts and graphs: Charts and graphs in Google Sheets can help you visualize quantitative data. For example, you can use them to display customer feedback scores.
- Using formulas: Google Sheets works with many formulas, such as COUNTIF, SUM, and AVERAGE. Instead of doing manual calculations, you can use formulas to increase your speed and improve accuracy.
How to visualize Google Forms data
If you need to create Google Forms reports to share your findings with stakeholders, data visualizations are a great place to start. Charts, graphs, and tables help stakeholders quickly understand large amounts of data, which is especially useful if they don’t want to read through dense analyses.
You can use Google Sheets to create many different data visualizations. You can also use other Google tools, such as Looker Studio (also known as Data Studio). Some key visualizations that help identify trends, patterns, and anomalies include
- Pie charts: These are best for showing part-to-whole relationships, as well as percentages or proportions. For example, you can use a pie chart to show budget allocations by department.
- Bar charts: These show how different categories compare. For example, you can use a bar chart to compare website engagement by channel.
- Line charts: Line charts show trends over time, highlighting growth and decline patterns. For example, you can use them to show monthly revenue growth.
- Pivot charts: These help you understand large data sets and multidimensional data. For example, you can use them to show customer product preferences by region, broken down by quarter.
- Dashboard summaries: Dashboards let you view multiple metrics and visuals in one place. They can display all key performance indicators together so stakeholders can quickly understand the big picture.
Advanced ways to analyze Google Forms responses
If you want to dig deeper into your analysis for business or research purposes, several tools can help you better understand your data. Google Sheets, Looker Studio, and other third-party options offer more granular ways to understand Google Forms responses.
Here are some advanced methods you can try:
- Cross-tabulation: This statistical tool is ideal for comparing relationships between two or more variables or identifying patterns across different segments, such as employee satisfaction by department or tenure.
- Trend analysis: This analysis helps you understand change over time, seasonality, and patterns. While it uses historical data to identify patterns, it can also help you predict future trends.
- Segmentation: This method groups your audience into meaningful clusters so you can better understand their needs. For example, you can segment your audience by demographic to analyze customer feedback.
- Sentiment analysis: For open-ended questions, sentiment analysis uses AI to understand the emotional tone behind responses, helping you understand qualitative feedback at scale.
Another option is to export your data to tools designed for advanced data analysis. Microsoft Excel is great for calculations, financial modeling, and scenario analysis. For advanced statistical analysis and predictive modeling, use SPSS. Use R for statistical computing, graphics, and data manipulation.
Limitations of analyzing data in Google Forms
You’ve seen how to analyze data from Google Forms, which means you’re likely aware of its limitations. Google Forms is a fairly basic form builder that isn’t designed for advanced data analysis. Here are some limitations you’ll encounter:
- Limited reporting tools: The built-in tools in Google Forms show basic summaries, responses by question, and individual responses. For anything more, you’ll have to export the data to another tool.
- Basic charts: Google Forms automatically creates charts from your form responses, but they’re best for analyzing small data sets and spotting high-level trends. You also don’t have any control over how the charts look.
- No advanced analytics: Google Forms doesn’t offer advanced reporting capabilities. For segmentation, sentiment analysis, trend analysis, and other advanced methods, you’ll have to use another tool.
- Manual workflows: The absence of automation features means you have to manually export your data from Google Forms to Google Sheets or download it as a CSV file, which makes analysis work more laborious.
- Limited collaboration features: Google Forms lets team members work on forms together, but it doesn’t have collaboration capabilities for data analysis.
If Google Forms doesn’t offer the data analysis functionality you need, it may be time to look elsewhere.


Analyze form data more easily with Jotform
A leading Google Forms alternative, Jotform is an online form builder with several ways to analyze data. Whether you need straightforward summaries of your responses or deeper analysis with data visualizations and detailed charts, Jotform has it all.
Here are some of Jotform’s built-in analytics and reporting tools:
- Jotform Tables: Jotform Tables is a collaborative workspace inside Jotform that helps you automatically organize, track, and manage your response data. Use it to filter, sort, and review your form submissions.
- Jotform Report Builder: To create shareable reports with stunning data visualizations, use Jotform Report Builder. It builds bar graphs, pie charts, doughnut charts, line graphs, data grids, and more. Plus, reports update in real time as submissions come in, so you don’t have to manually rebuild charts when you have new data.
- Form Analytics: Want to understand more about the respondents filling out your form? Form Analytics shows form traffic, submission rates, drop-off points, and field-level engagement, making it easier to optimize every form for high-quality responses.
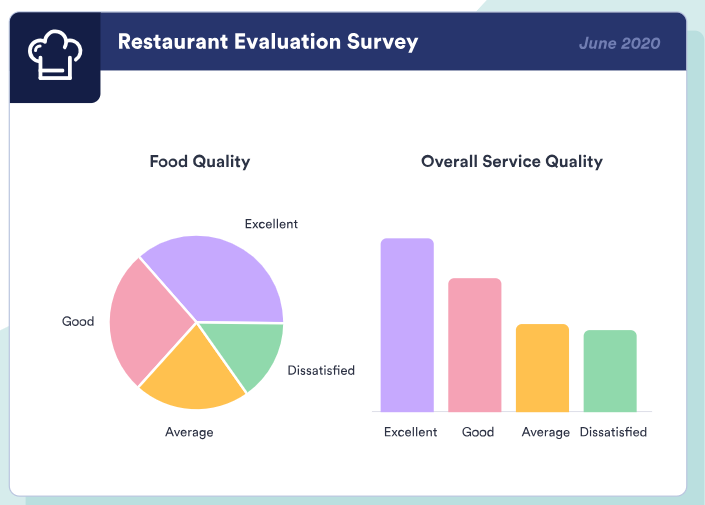
Plus, Jotform comes with over 150 native integrations with tools such as Google Sheets, Salesforce, and HubSpot, so you can send data to your preferred platform for deeper analysis.
If you’ve already built your forms in Google Forms, you don’t need to rebuild anything in Jotform. Use our migration tool to import your forms into Jotform. It does all the hard work for you. Simply sign in with Google and select the form you want to import, and Jotform automatically imports its form questions and structure. All you have to do is review the form, add any customizations, and publish.
Pro Tip
Creating an effective survey report is both an art and a science. Get tips on how to tell a compelling story with your reports in our article “Survey Report Examples.”
Discover meaningful insights in your data with Jotform
Google Forms can provide built-in response summaries, but you’ll need Google Sheets, visualization tools, or dedicated reporting platforms to unearth meaningful insights from your form responses.
Jotform is a leading form builder with robust reporting and analysis tools for teams that need deeper insights and automated reporting. Create a free Jotform account and migrate your Google Form to Jotform today.
FAQs
Yes, ChatGPT can summarize Google Forms responses. Copy and paste the response data into ChatGPT or upload a spreadsheet if you have a large data set. Then prompt the AI tool to analyze the data as needed.
Google Forms provides basic analytics under the Responses tab, offering three different views: Summary, Questions, and Individual. For more advanced analytics tools, use Jotform. It comes with Jotform Tables, Jotform Report Builder, and Form Analytics.
You can download your data from Google Forms as a CSV file and then upload that file to Microsoft Excel manually. Then you can use Excel’s capabilities to analyze the data.
This article is for Google Forms users, researchers, business teams, data analysts, and anyone who wants to turn form responses into clear trends, visual reports, and actionable insights.





































































































Send Comment: