
Creating Google Forms reports
- Create a new spreadsheet
- Name a range of cells to create formulas to summarize results
- Add a new sheet in the spreadsheet
- Use the COUNTIF function
- With the new set of data, create a chart of your survey responses
Interactive step-by-step tutorial
Regardless of the industry you’re in, you probably use forms — whether to onboard employees, streamline the patient intake process, schedule appointments, or perform other tasks. A popular type of form is a survey, which helps you gather actionable data from your clients, employees, and vendors to optimize business processes and improve decision-making.
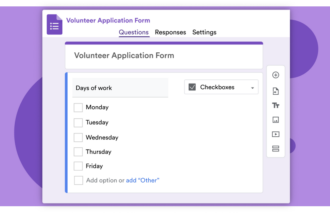
One of the most efficient ways to create, edit, and share surveys is to use an online form builder like Google Forms, a tool that anyone can build engaging, professional-looking forms in minutes. Google Forms also includes a reporting feature that enables users to view and download form and survey responses by question, by person, or in one consolidated spreadsheet. Here’s a breakdown of how to check and share results with Google Forms as well as how to generate Google Forms reports.

Looking for the best alternative to Google Forms?
Jotform’s full-featured form-building solution is mobile-friendly and has the most integrations in the industry. Use it to collect payments, automate workflows, gather leads, and more.
How to check form results with Google Forms
Imagine you’re an event planner and you’ve recently created and distributed an event feedback survey using a Google Forms feedback form template. As people submit responses, you’d like to view the results to get an idea of their overall satisfaction.
With Google Forms, viewing form responses is easy with these steps:
- Open your form in Google Forms.
- Click Responses at the top center of the screen.
- Click Summary to view all the results by question. This section displays simple charts for numerical survey results that you can copy and paste into a report elsewhere. For example, you may want to copy a chart specifically about how event attendees felt about the welcome kit or scheduled activities.
- Click Individual if you’d like to view responses by person. (Select Previous < or Next > to toggle between submissions.)
- Click Create Spreadsheet Export to Google Sheets to view all responses in a spreadsheet. To download all responses as a CSV file, simply select Responses, the vertical three dots, and then Download responses (.csv).
How to share form results with Google Forms
Being able to share collected data and feedback with colleagues facilitates analysis and collaboration, which is another reason why Google Forms is such a popular online survey tool.
Here’s how to share form responses with Google Forms:
- Open your form in Google Forms.
- Click Responses at the top center of the screen.
- Click Link to Sheets.
- Select Create a new spreadsheet (the form or survey you want to share should be listed there) and click Create.
- The new spreadsheet should open automatically, or you can click View in Sheets to navigate to Google Sheets.
- Click the Share button in the top right of your screen to add email addresses or copy the spreadsheet’s link to share your form another way — like in a business messaging platform like Slack.
Pro Tip
When you need to turn form content or response insights into presentation-ready material, a Google Forms to Google Slides workflow can help you create slides without copying everything manually.
How to generate a report using Google Forms
While viewing and sharing form responses in Google Forms is fairly easy, generating Google Forms reports is a bit more complicated. Here’s how to create customizable summary charts of survey results using Google Sheets.
- Create a new spreadsheet with your compiled survey responses. (To do this, follow steps 1–5 in the previous section.)
- Name a range of cells to create formulas to summarize survey results. Each question on the sheet displays one of the questions in the survey, while each row displays the various survey answers to each question.
- Using the event feedback survey as an example, you’ll see the first column — which is located to the right of Timestamp — is “How satisfied were you with the event?” To generate a report in Google Forms, you need to name each column.
- Click the letter of the column to highlight the whole column/survey question.
- Click Data from the top toolbar and then Named ranges.
- Type in the name of the range, such as “Overall_event_satisfaction,” for this particular column. (These names can only contain alphanumeric numbers and underscores — no spaces or punctuation — and they can’t begin with a number.)
- Click Done.
- Using the event feedback survey as an example, you’ll see the first column — which is located to the right of Timestamp — is “How satisfied were you with the event?” To generate a report in Google Forms, you need to name each column.
- Add a new sheet in the spreadsheet by selecting the plus sign in the bottom left corner.
- In column A of this sheet, list all the possible answers to the survey question highlighted in the first step. Sticking with our event feedback survey, the following five answers would be listed vertically in column A: 1, 2, 3, 4, 5 (denoting the respondent’s event satisfaction level from 1–5).
- Use the COUNTIF function in Google Sheets to calculate how many times a particular answer or data point occurred in the selected named range.
- Insert the COUNTIF formula in column B’s first cell. (Google Sheets should then offer to apply the same formula in the remaining rows.) The COUNTIF formula looks like this: =COUNTIF(Overall_event_satisfaction, A1)
- With the new set of data, create a chart of your survey responses.
- Highlight all data in columns A and B.
- Click Insert from the menu bar.
- Select Chart to access the Chart Editor.
- Choose the type of chart you’d like to create — like a column graph or pie chart — under the Setup tab.
Pro Tip
For details on how to make a pie chart on Google Forms with expanded options, check out our post on the topic.
Jotform Report Builder: A great Google Forms reports alternative
As you can see, while you can use Google Forms to create Google Forms reports, it’s a long, arduous process.
Luckily, many Google Forms alternatives offer better reporting capabilities. Online form builder Jotform, for example, has all the tools you need to create and personalize stunning, polished forms and surveys to collect data. Jotform offers a library of 20,000-plus customizable form templates and integrates with more than 100 popular third-party apps. Plus, it delivers code-free, drag-and-drop functionality to make form-building and data collection easy and efficient.
Most importantly, with Jotform’s Report Builder, you can convert those submitted responses into insightful, visually appealing reports in minutes. Using Jotform Report Builder, you can
- Optimize your presentation’s design using a wide variety of report design options, including different chart types, colors, icons, and shapes
- Embed live reports directly into your website
- Instantly share your reports with colleagues and clients to improve workflows
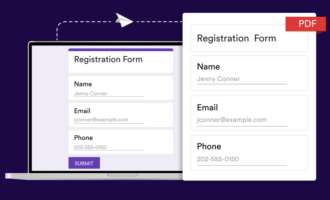
- Save your reports as PDFs to print and share in meetings
Ultimately, both Google Forms and Jotform Report Builder allow users to convert form responses into professional, data-driven reports — regardless of their coding knowledge. So, whichever you choose, you’ll be more than equipped to analyze your data, impress your colleagues and supervisors with visually appealing reports, and make better business decisions.


Send Comment: