

In college, I was the assistant to the director of the writing center. At the end of every semester, we’d order Chinese food, hole up in her office, and brace ourselves for a long afternoon. Our task? To make sense of hundreds of survey responses we’d gotten from students who had visited the writing center that semester.
To analyze survey data, you don’t need a mathematical degree. I certainly didn’t have one. But I learned that you do need to know how to clean data, find patterns, and take certain actions when you’re done.

To learn how to analyze survey data, no matter which data collection tools you use, keep reading.
1. Start with the decision your survey should support
Before you do anything else, answer this question: What do I want to be able to do after my survey analysis, and why?
At the writing center, our answer was “coach tutors.” We’d surveyed students about their experience, so we could show tutors what they were doing well and where they could improve. Better coaching raised satisfaction scores and won back returning students, which translated to better grades for visitors and continued funding for the writing center.
Here’s another example. Let’s say you’re surveying employees about a new benefits program. You’re gathering their feedback so you know which parts of the program to keep, cut, or explain better. Happy employees stay at your company longer and speak positively about it, attracting more talent.
Whatever your answer is, write it down and keep it handy. You’ll reflect on it throughout this process.
2. Review your response rate and sample quality
A response rate is the percentage of people who answered your survey. To calculate it, divide the number of responses you got by how many people you sent the survey to, then multiply by 100.
There’s no ideal response rate. To get an idea of yours, look up benchmarks for your industry in academic journals and market research.
You can also get a sense of what’s “ideal” by comparing rates across your own surveys. If you typically get a 30 percent response rate, and then one survey tops out at 5 percent, it’s safe to say that’s less than ideal.
Obviously, more responses are better than fewer. A higher rate doesn’t automatically spell success, though. You also need to evaluate your sample quality, or who responded. To do that, ask yourself: Did I receive submissions from the people I need to hear from?
If the writing center were to send surveys to 300 people and get 264 answers, we’d boast an 88 percent response rate. Not bad, considering college students are busy.
But I’d also want to look at which students answered. Had most been freshmen, I’d want to find out if upperclassmen didn’t go to the writing center, which would mean fewer got the survey. If that’s not it, the survey design may be the culprit.
Here’s another example. Let’s say you’re a small-business owner who just held a free webinar. Afterward, you sent a survey to all attendees, asking them to rate the quality of the webinar. You may have gotten a low response rate, something like 18 percent, which sounds like a bummer. But if those respondents represent your ideal customer profile (ICP), their feedback is worlds more important than thorough responses from prospects you weren’t targeting.
Pro Tip
If you’re not getting the submissions you want, you might have one of two problems. Either the right people aren’t receiving your survey or, perhaps because of the survey design, they got it and didn’t answer. Either way, don’t lean too heavily on your current data. Evaluate your survey analytics, fix the issue, and restart the process.
3. Clean incomplete or unreliable responses
If you receive submissions from someone not in your ICP, their feedback might still be valuable. But if you answer yes to the following questions, you may be able to label them incomplete or unreliable and omit them from your analysis.
- Are any submissions missing key data?
- Do any seem AI-generated or like spam?
- Are any altogether nonsensical?
Once, in response to the question “What was your favorite aspect of the session?,” a tutee answered, “Tutor was cute.” That’s riveting gossip for our staff, but not exactly the data my boss and I were going for. We nixed that entry.
You can omit whole responses or just single questions within one entry. To avoid skewing your numbers, be sure to apply the same standard to every respondent and keep track of how many answers you removed per question.
4. Label question types
The next step is to label each question in your survey by type, because you can’t analyze different survey question types the same way. For instance, you can “count” how many people chose a certain option in a multiple-choice question, but an open-ended question yields unique responses, since people can write literally anything in that text box.
Know what you’re dealing with so you can pick an appropriate analysis method.
These are the more common types you’ll find in a survey (with question examples):
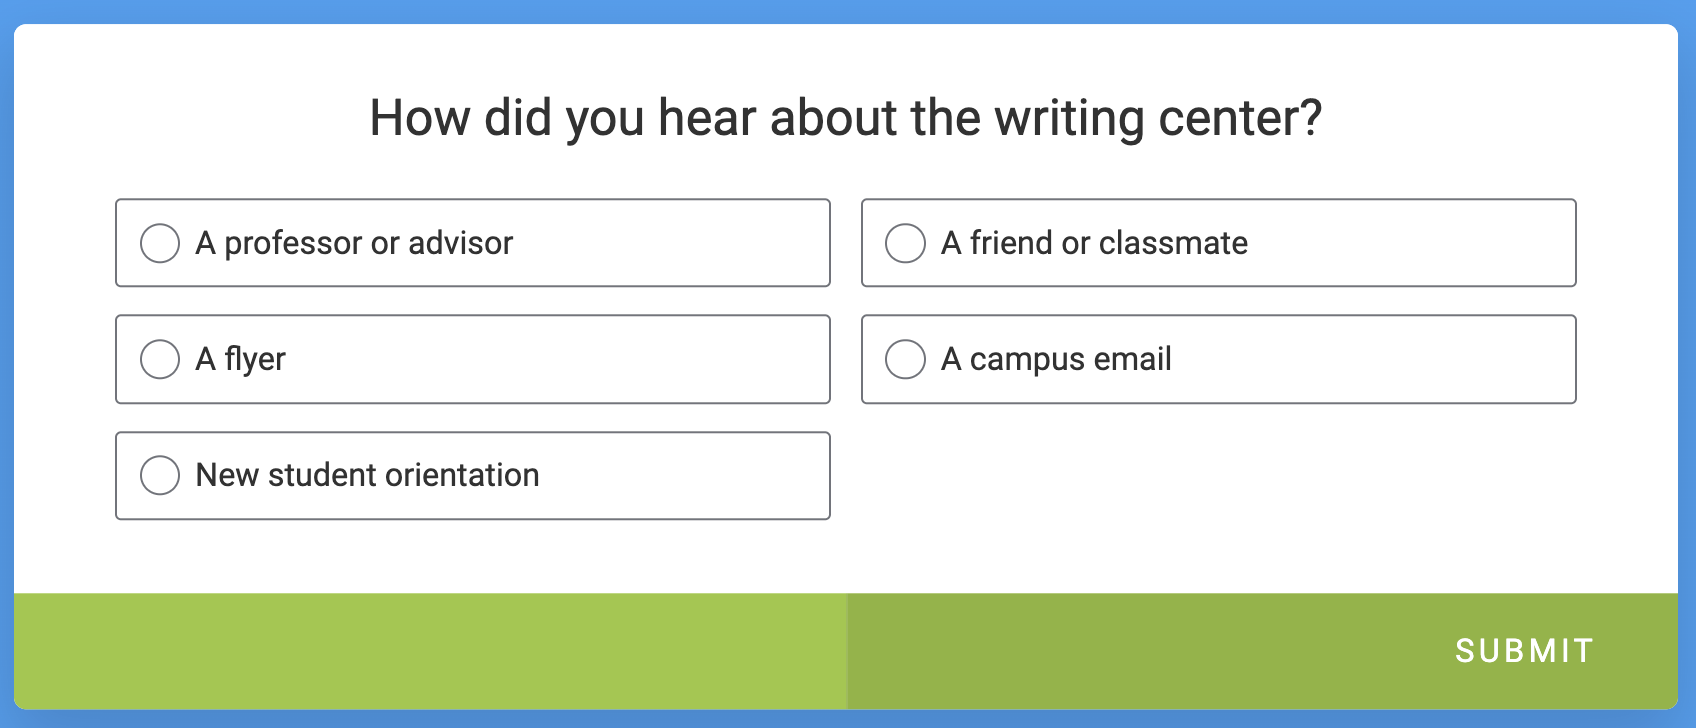
Multiple choice
A multiple-choice question gives you more than one option, and you select one.
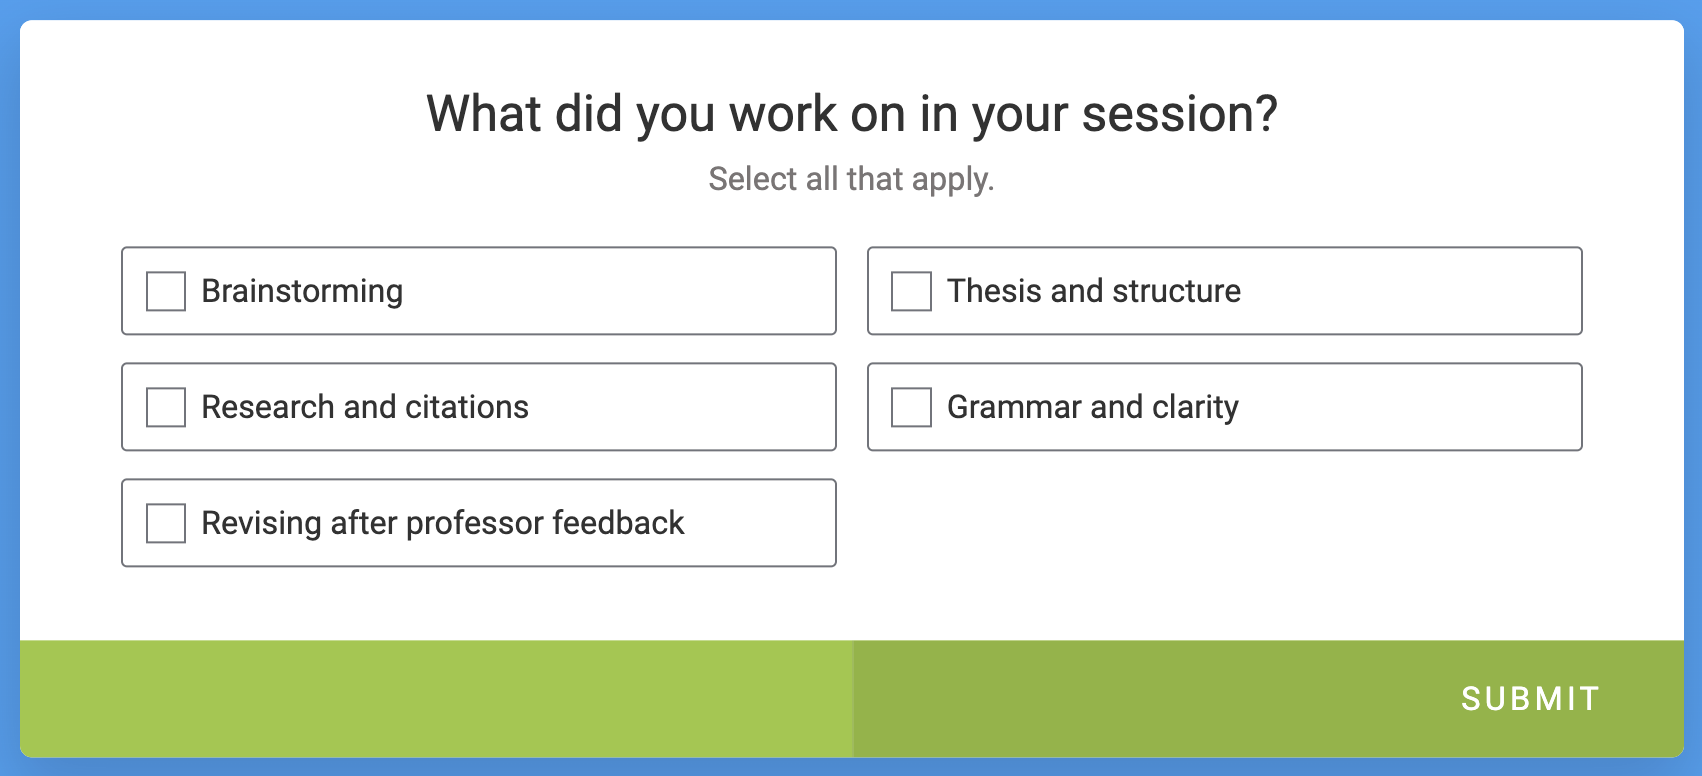
Checkbox
A checkbox question gives you more than one option, too. But answers are preceded by checkboxes instead of radio buttons, and you select as many that apply.
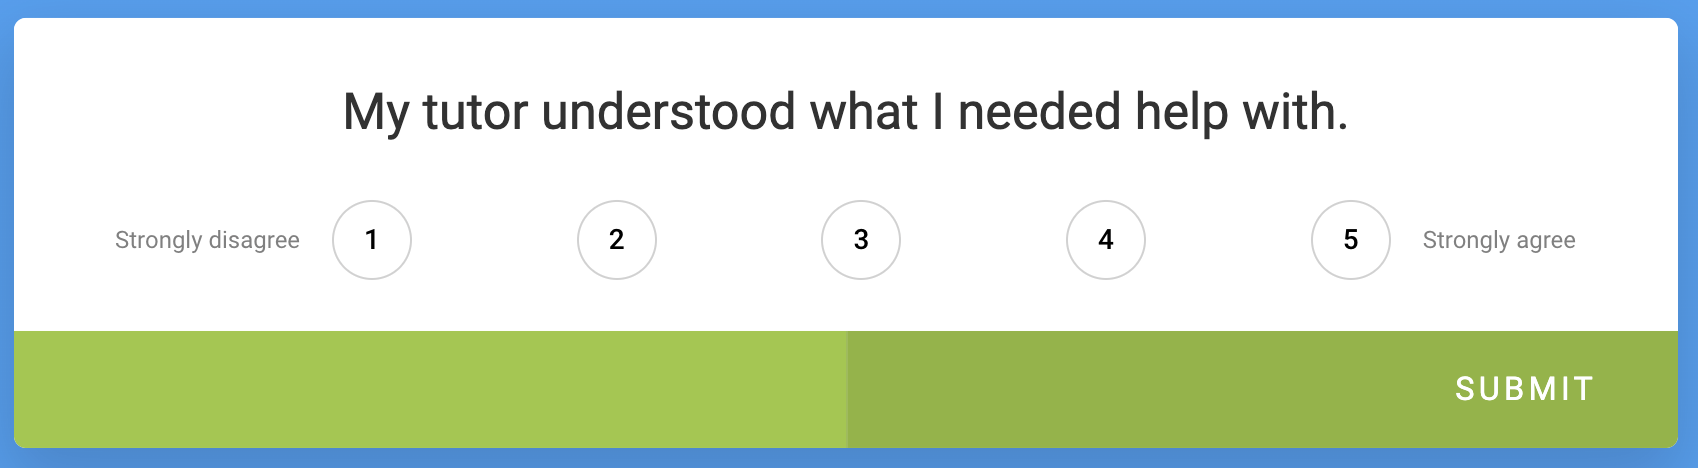
Rating scale
A rating scale question lets you answer from a range of choices, with “extreme” options on either end. A 1–5 rating scale is common.
Matrix
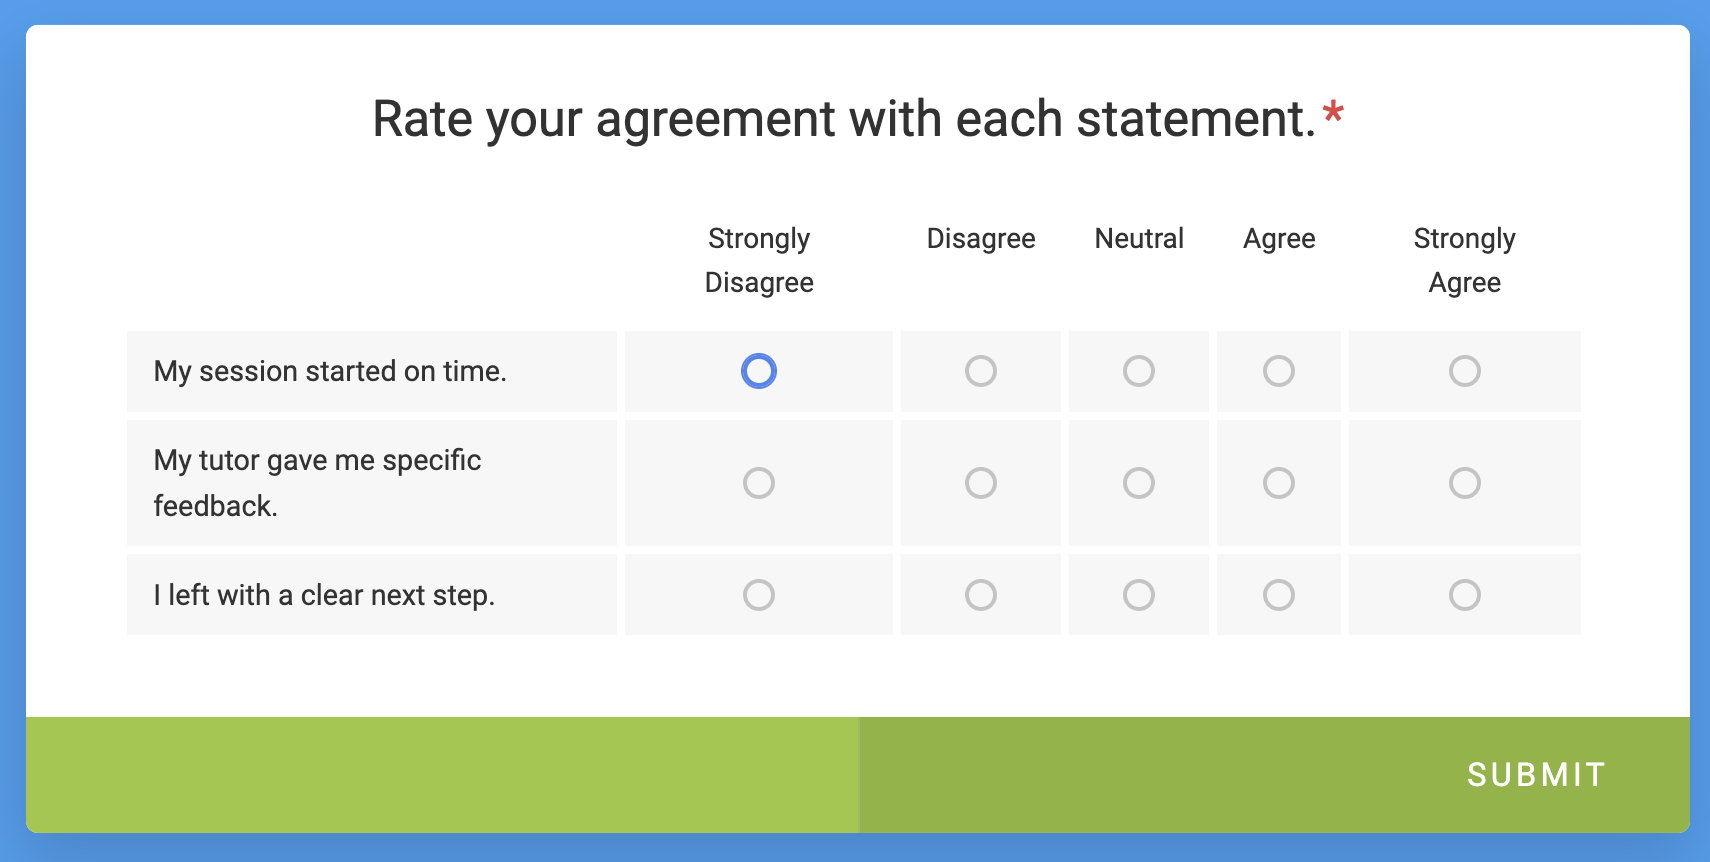
A matrix question is a version of the rating scale. Instead of just one question, you see a group of them arranged in a matrix: a grid that presents questions in rows and answers in columns. The answers are often Likert-style, the most popular being 5-point and 7-point scales.
Open-ended
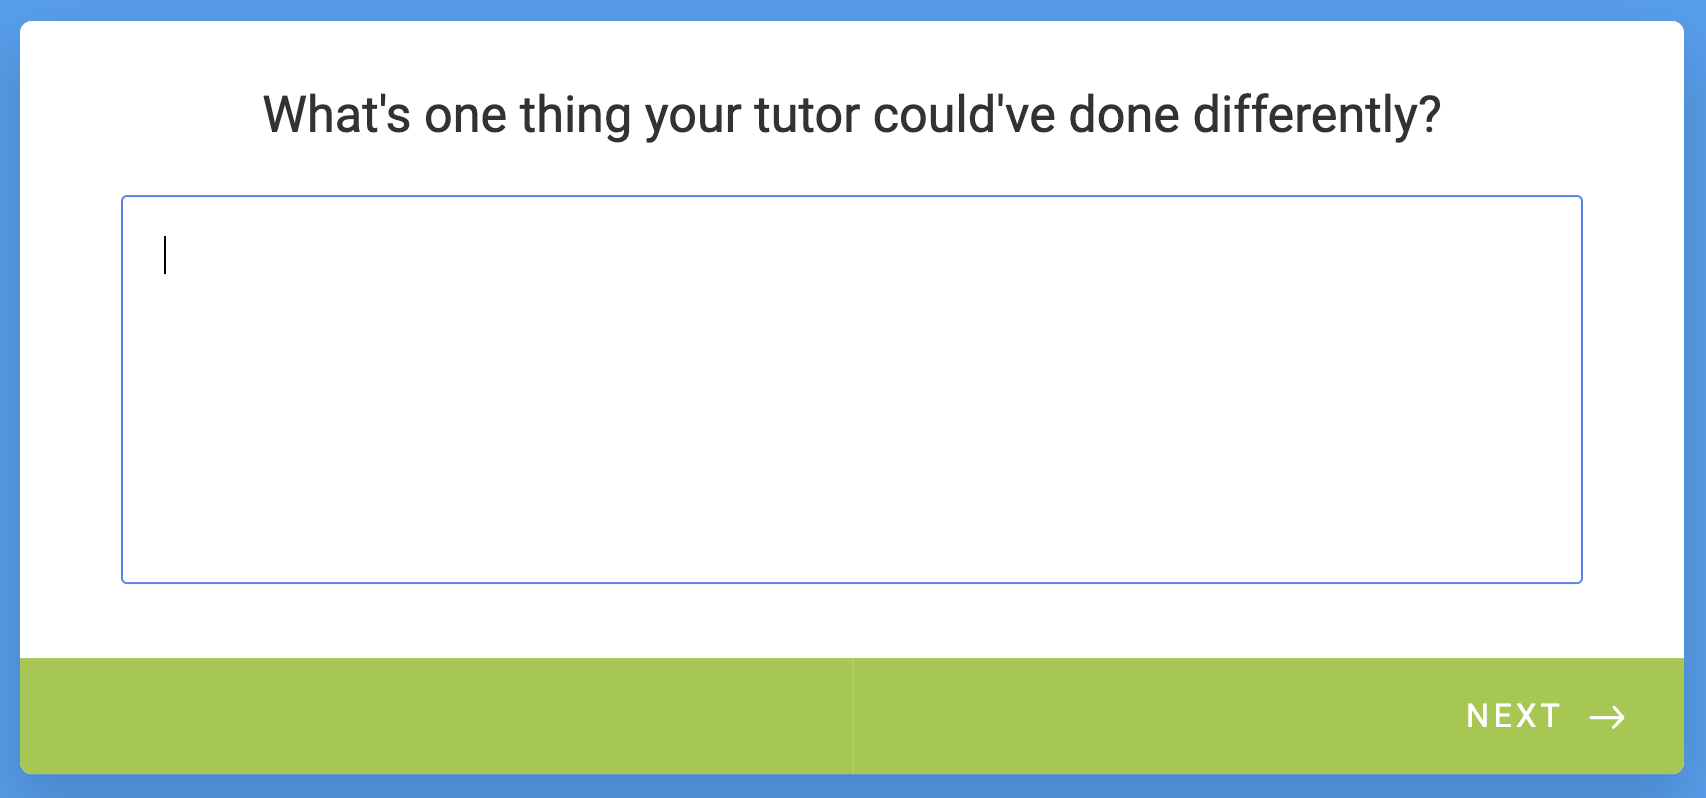
An open-ended question lets you answer with text. (A closed-ended question is narrower and provides a short list of multiple-choice or yes-no options.)
Numeric
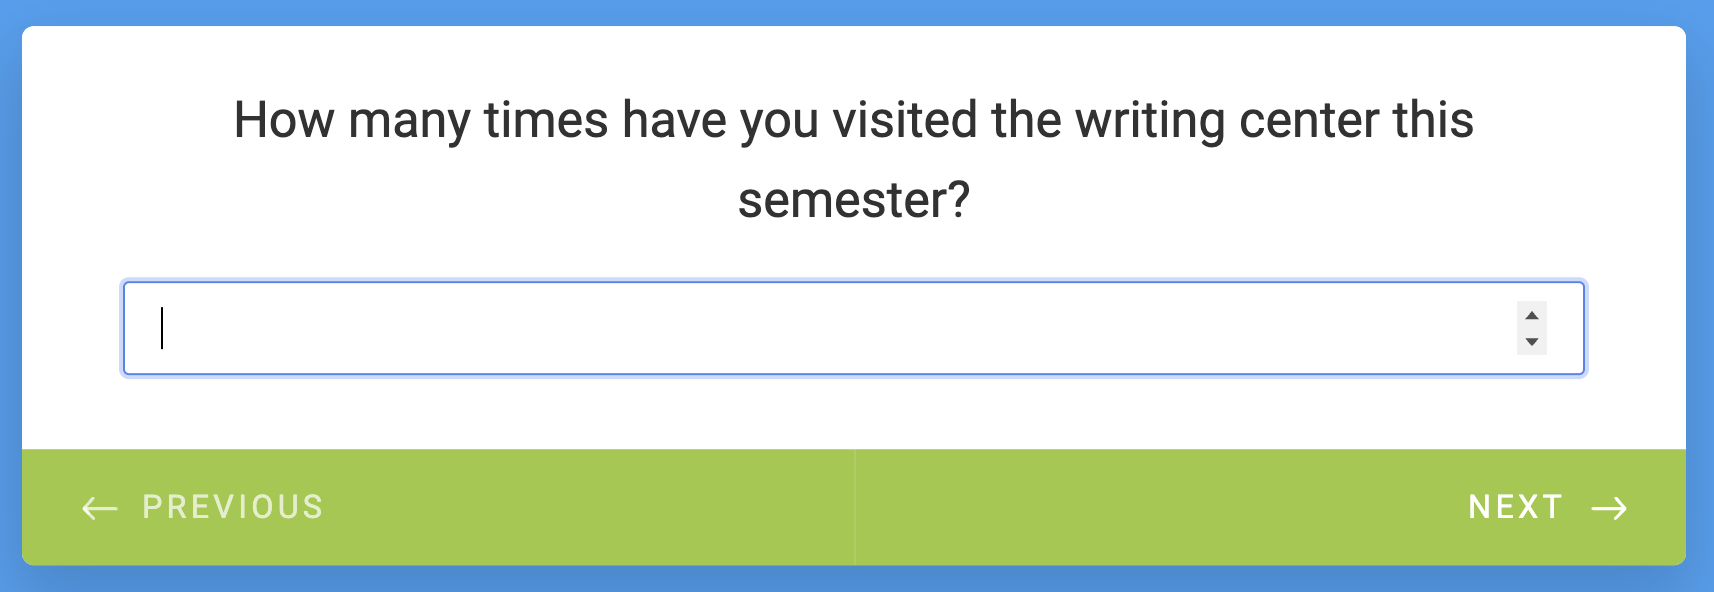
A numeric question is an open-ended question that limits you to submitting a number.
Net Promoter Score (NPS)
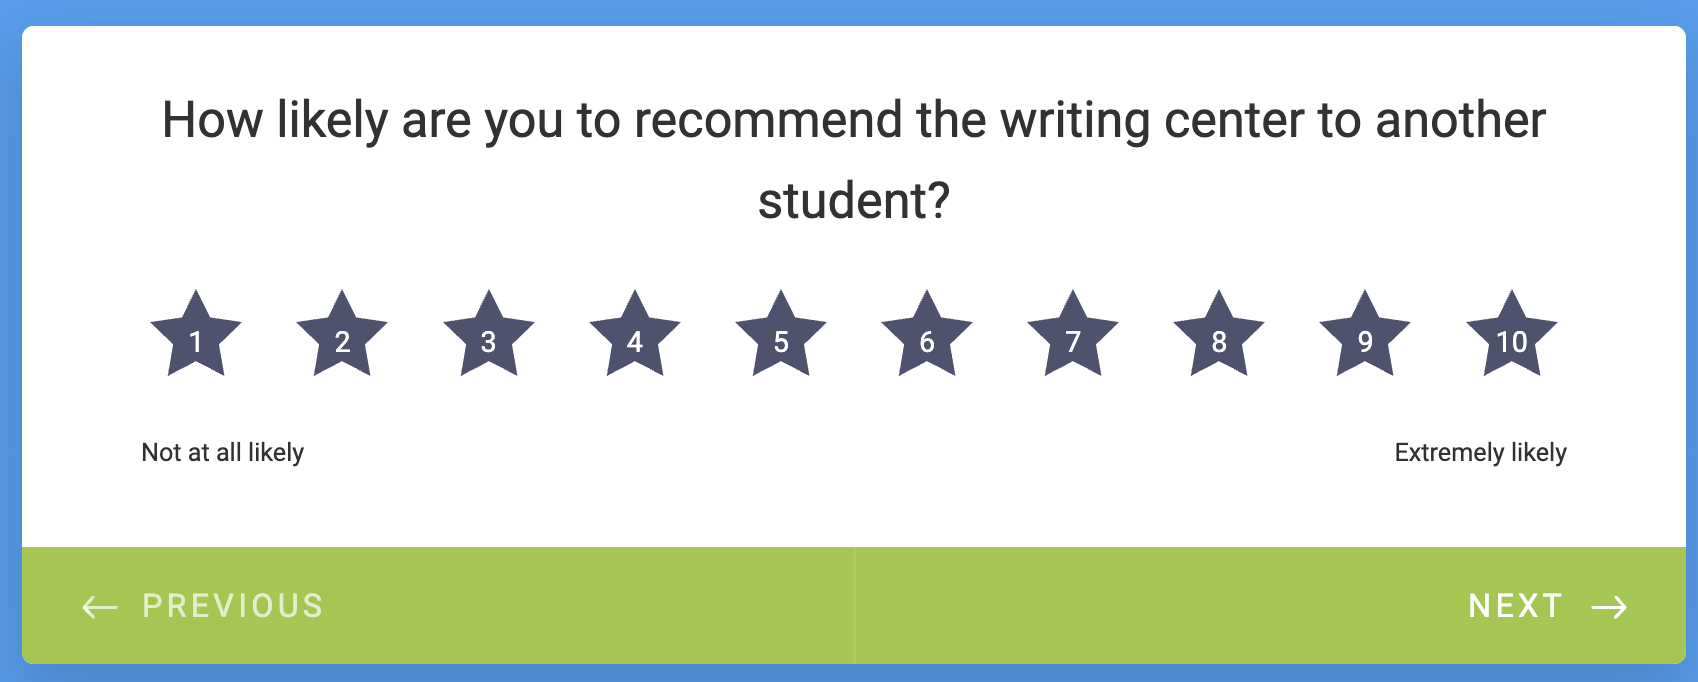
People generally refer to the NPS as a calculation. But it can describe a question type, too. It measures how likely you are to recommend a business.
Customer satisfaction score (CSAT)
CSAT and NPS are similar. As with NPS, CSAT typically refers to a calculation but can be a question, too. It measures your satisfaction with a specific interaction.
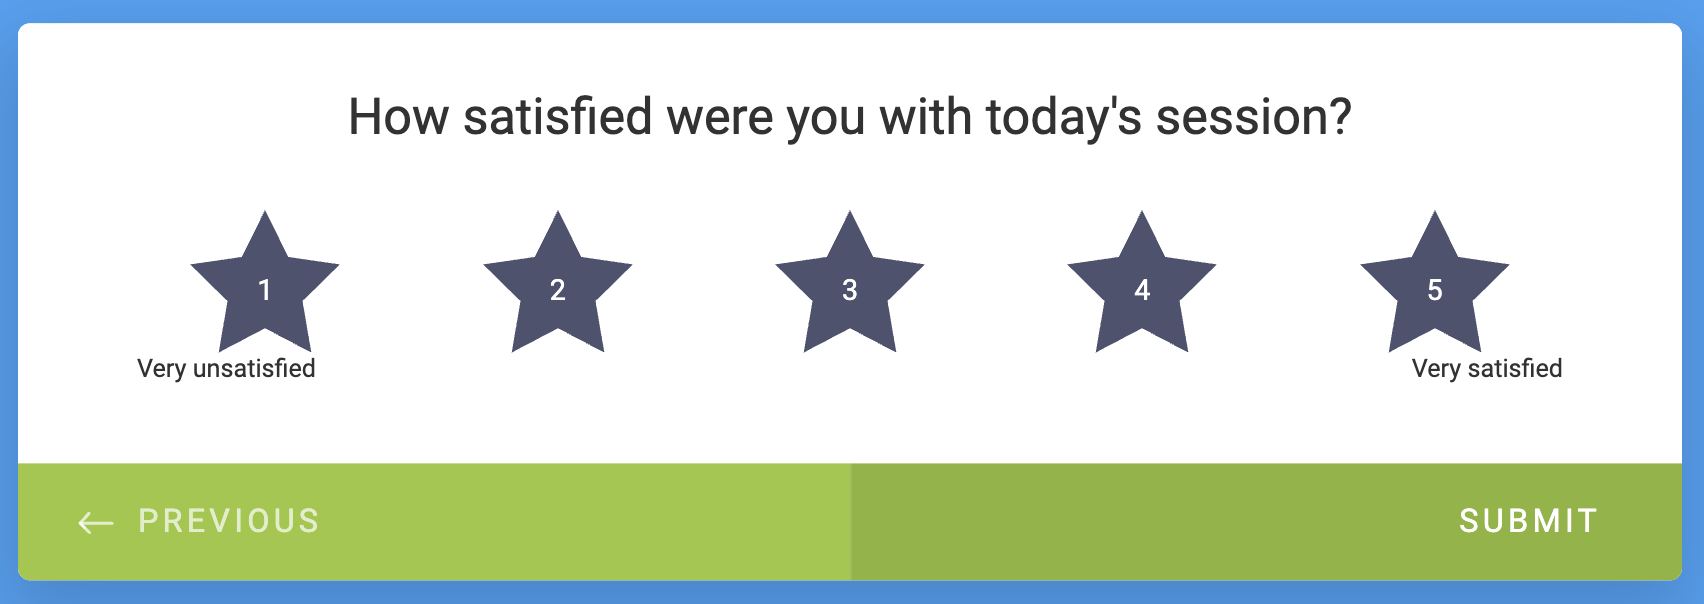
Pro Tip
These survey questions were built in Jotform. Like what you see? Create a survey in Jotform for free.
5. Analyze quantitative survey data first
Now that you’ve labeled your questions, you can begin your survey data analysis. I recommend starting with the non-open-ended ones first.
Why? Because quantitative survey analysis usually identifies patterns. If I see that 80 percent of customers rate scheduling poorly, that’s a pattern. Once I identify that, I can go to the open-ended responses to see what, exactly, about scheduling isn’t working.
You may be able to find patterns in qualitative, or open-ended, data. But finding them across unique text-based answers takes time. Plus, respondents might skip open-ended questions, or rush through their answers, just to finish the survey faster. So starting there may be slow and have thinner results to show for it.
Here are a few common measures for interpreting quantitative data.
Counts
A count represents how many times an answer was chosen.
Percentages
A percentage is a proportion of a count.
Percentages make it easier to compare groups of different sizes. Say 18 of 24 seniors rated their session “excellent,” along with 60 of 120 freshmen. The number of “excellent” ratings makes it look as if freshmen were happier. The percentages, 75 percent versus 50 percent, prove the opposite.
Averages
An average is the value you get when you add up every response to a question, then divide by the number of responses.
Keep in mind that averages can hide important details. One unusually high or low response can drag the average in a direction that doesn’t represent the group. And averages can be misleading. If half your respondents rate you a 1 and the other half rate you a 5, your average is 3, which makes it seem like your audience is indifferent when the reality is that they’re sharply divided.
Medians
A median is the middle value when you line up every response to a question from lowest to highest. Outliers don’t affect it as significantly, so it’s a useful companion to the average.
Distributions
A distribution shows you how responses are spread across every possible answer. If you create a bar chart and see answers piled at one end, or spread evenly across the scale, that shape represents the distribution.
Top-box and bottom-box scoring
Top-box and bottom-box scores are percentages of how many people chose the highest or lowest rating on a scale, respectively.
NPS/CSAT scores
What’s the difference between an NPS and a CSAT score? An NPS is the percentage of promoters (people likely to recommend your business) minus the percentage of detractors (people unlikely to recommend it). A CSAT score is the number of satisfied responses divided by the total number of responses, expressed as a percentage.
Many tools come with built-in features for calculating these scores. If I were using Jotform, for instance, at the writing center, I could’ve asked the Jotform AI Data Assistant something like “What percentage of freshmen rated their session a 5?” to calculate a top-box score. And if I were sharing survey results with other tutors, I could use the Jotform Report Builder to mold the data into charts that make it easier to pull key takeaways.
6. Analyze open-ended responses for themes
After you’ve crunched the numbers, it’s time to analyze the open-ended responses.
One process for doing this is called “survey coding.” You write down themes that surface in answers, then store each answer under a theme. Whenever I do this, I prefer to read all the answers first so I understand the range of what people expressed. If theme ideas occur to me on that first pass, I write them down. I finalize the list before I start sorting.
If you’re using AI to help you with survey coding, you could also connect your AI tool to the Jotform MCP.
New to Jotform MCP?
Jotform MCP hooks up your AI tool to Jotform directly so you can carry out actions in Jotform from a prompt. For example, you could assist your qualitative survey analysis with a prompt such as;
“I want to create a report for my open-ended question [enter question here]. While survey coding, I identified [X], [Y], and [Z] as themes. Review the form data, verify that these themes are accurate, and identify others I may have missed.”
7. Segment and cross-tabulate the data
You could analyze your numerical and open-ended responses at face value and stop there. But you’d miss out on valuable insights. To find those, you need to segment and cross-tabulate your data.
When you segment data, you break down respondents into categories. Maybe you’re a nonprofit coordinator who has surveyed donors about how they want you to spend their money. You might group those donors by age, profession, or region to find out how their opinions differ. That way, when you contact those people or speak in front of those audiences, you can tailor your message accordingly.
“Categories” can be anything. At the writing center, we were interested in what year our respondents were (freshman, sophomore, junior, or senior) and how many times they’d visited the writing center. The answer you wrote down in step 1 should help you decide on categories.
Once you have your segments, cross-tabulate the data by placing it in a table. Pick two variables; put one in the rows and another in the columns. Each cell will show you how that specific group answered.
With the class year running down the side of a table and satisfaction ratings running across the top, we could’ve seen at a glance whether seniors were rating their sessions lower than freshmen were.
8. Turn findings into action items
When you’re finished, pull out the purpose you wrote down in step 1 and ask: How does the data support the decision I need to make?
Record every insight you come up with. And make sure each one is tied to an action item, a specific person who will execute it, and a first step to take.
How to analyze survey data in Jotform
Now let’s put these steps into practice.
For the purposes of this section, pretend I’m a marketer who works for an olive oil company. I’ve created a resource hub on my website full of olive oil recipes, tricks for growing olive trees, and stories about the farms my company sources from. I want feedback from visitors about the quality of this resource hub so I can improve it, potentially drawing more traffic.
1. Create your survey
You can create a survey in one of three ways:
- Pick one from more than 13,000 survey templates, searchable by category.
- Head to the Jotform AI Form Builder to start from a plain-language prompt.
- Connect your AI tool to Jotform MCP, which is great if you’re already working in AI, brainstorming which questions to ask.
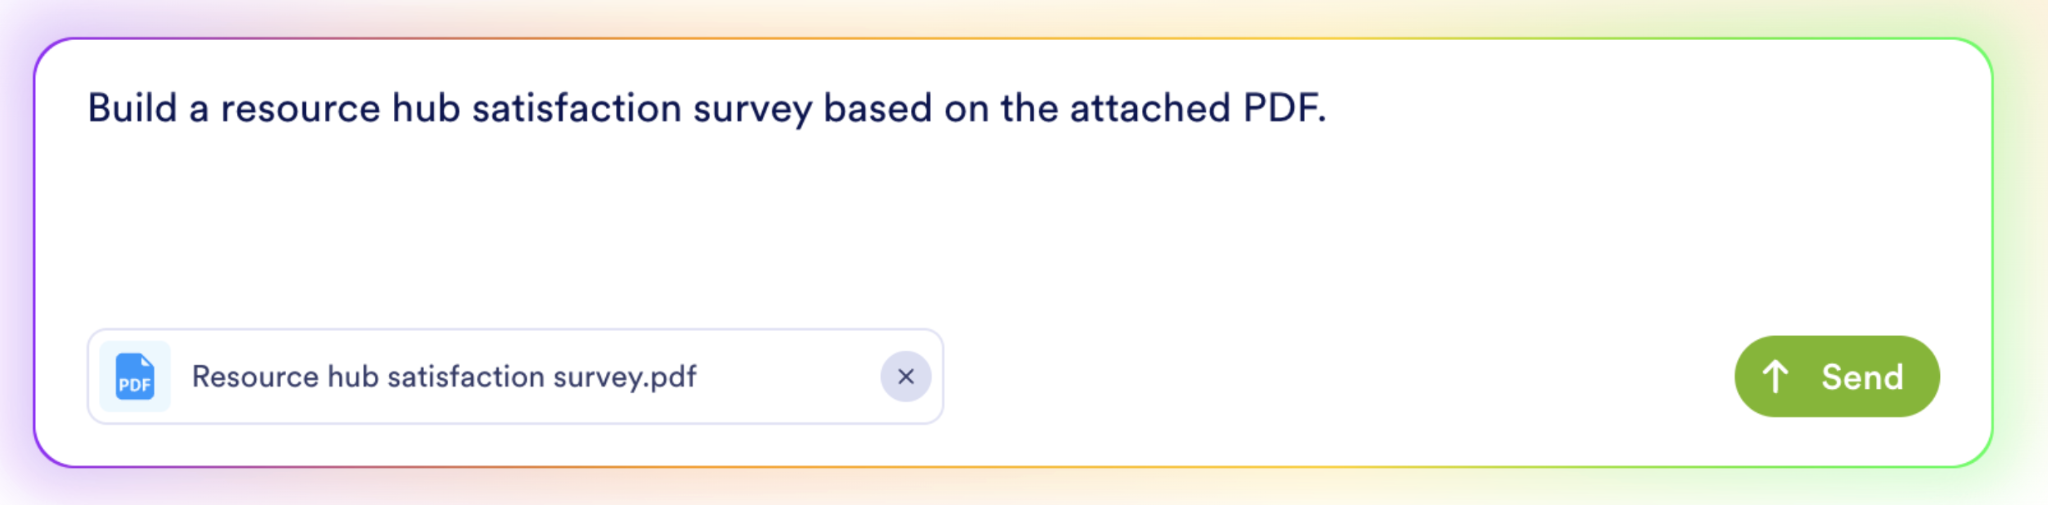
My questions are ready to go, so I’m starting with the Jotform AI Form Builder. I wrote a simple prompt and attached a PDF with my questions.
Pro Tip
A thoughtfully crafted survey can encourage participation and help you get quality responses. For specific tips, read Jotform’s guide to writing good survey questions (a five-minute read).
The AI Form Builder generates a survey, then creates a preview. From here, you can edit as needed by clicking, typing, and dragging and dropping.
Click Add Element + to plug in different question types. Jotform comes with standard options and hundreds of widgets for adding specialized questions.
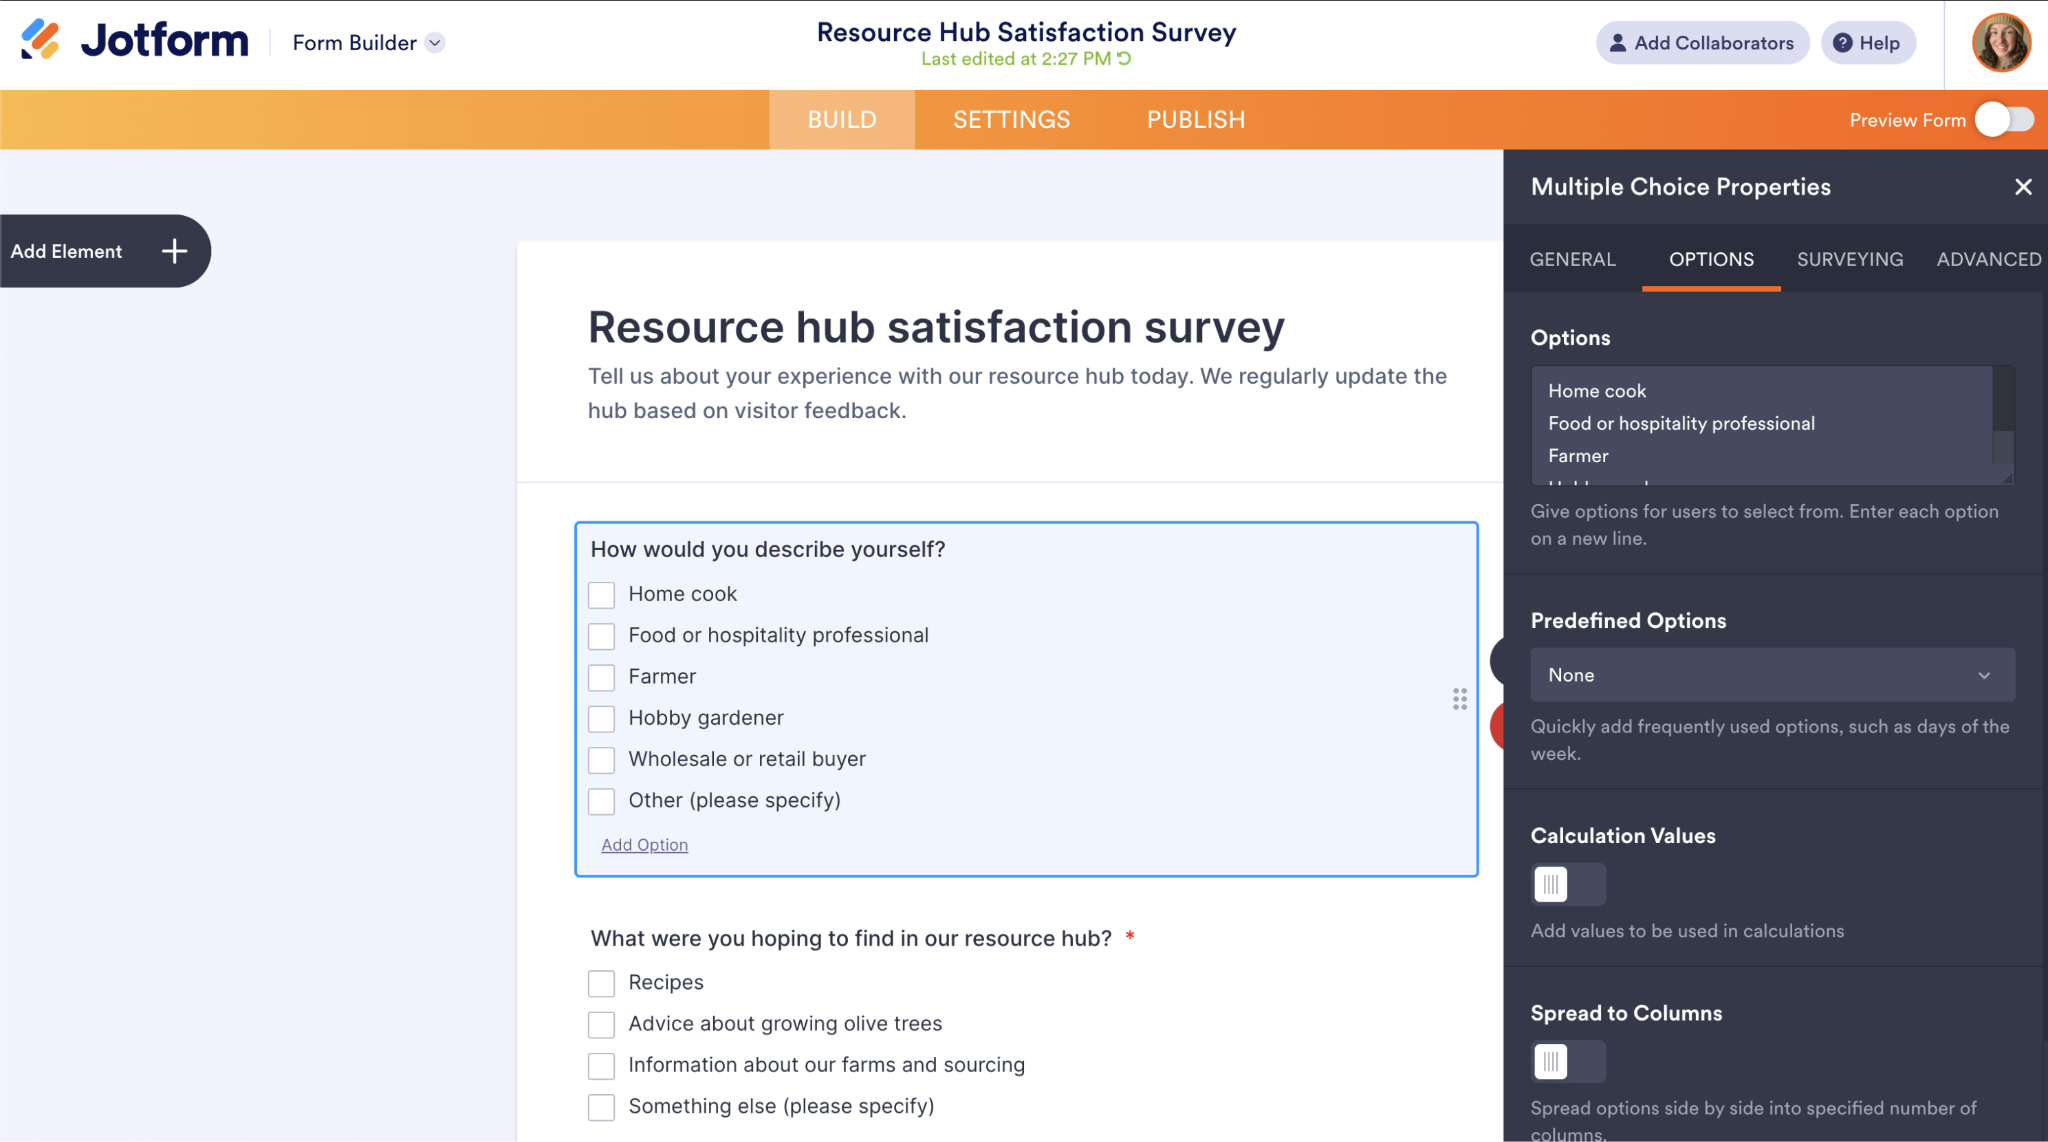
When you’re ready, click the Publish tab. You can share your survey in multiple ways, including via a direct form link, embed tools, and third-party sharing options.
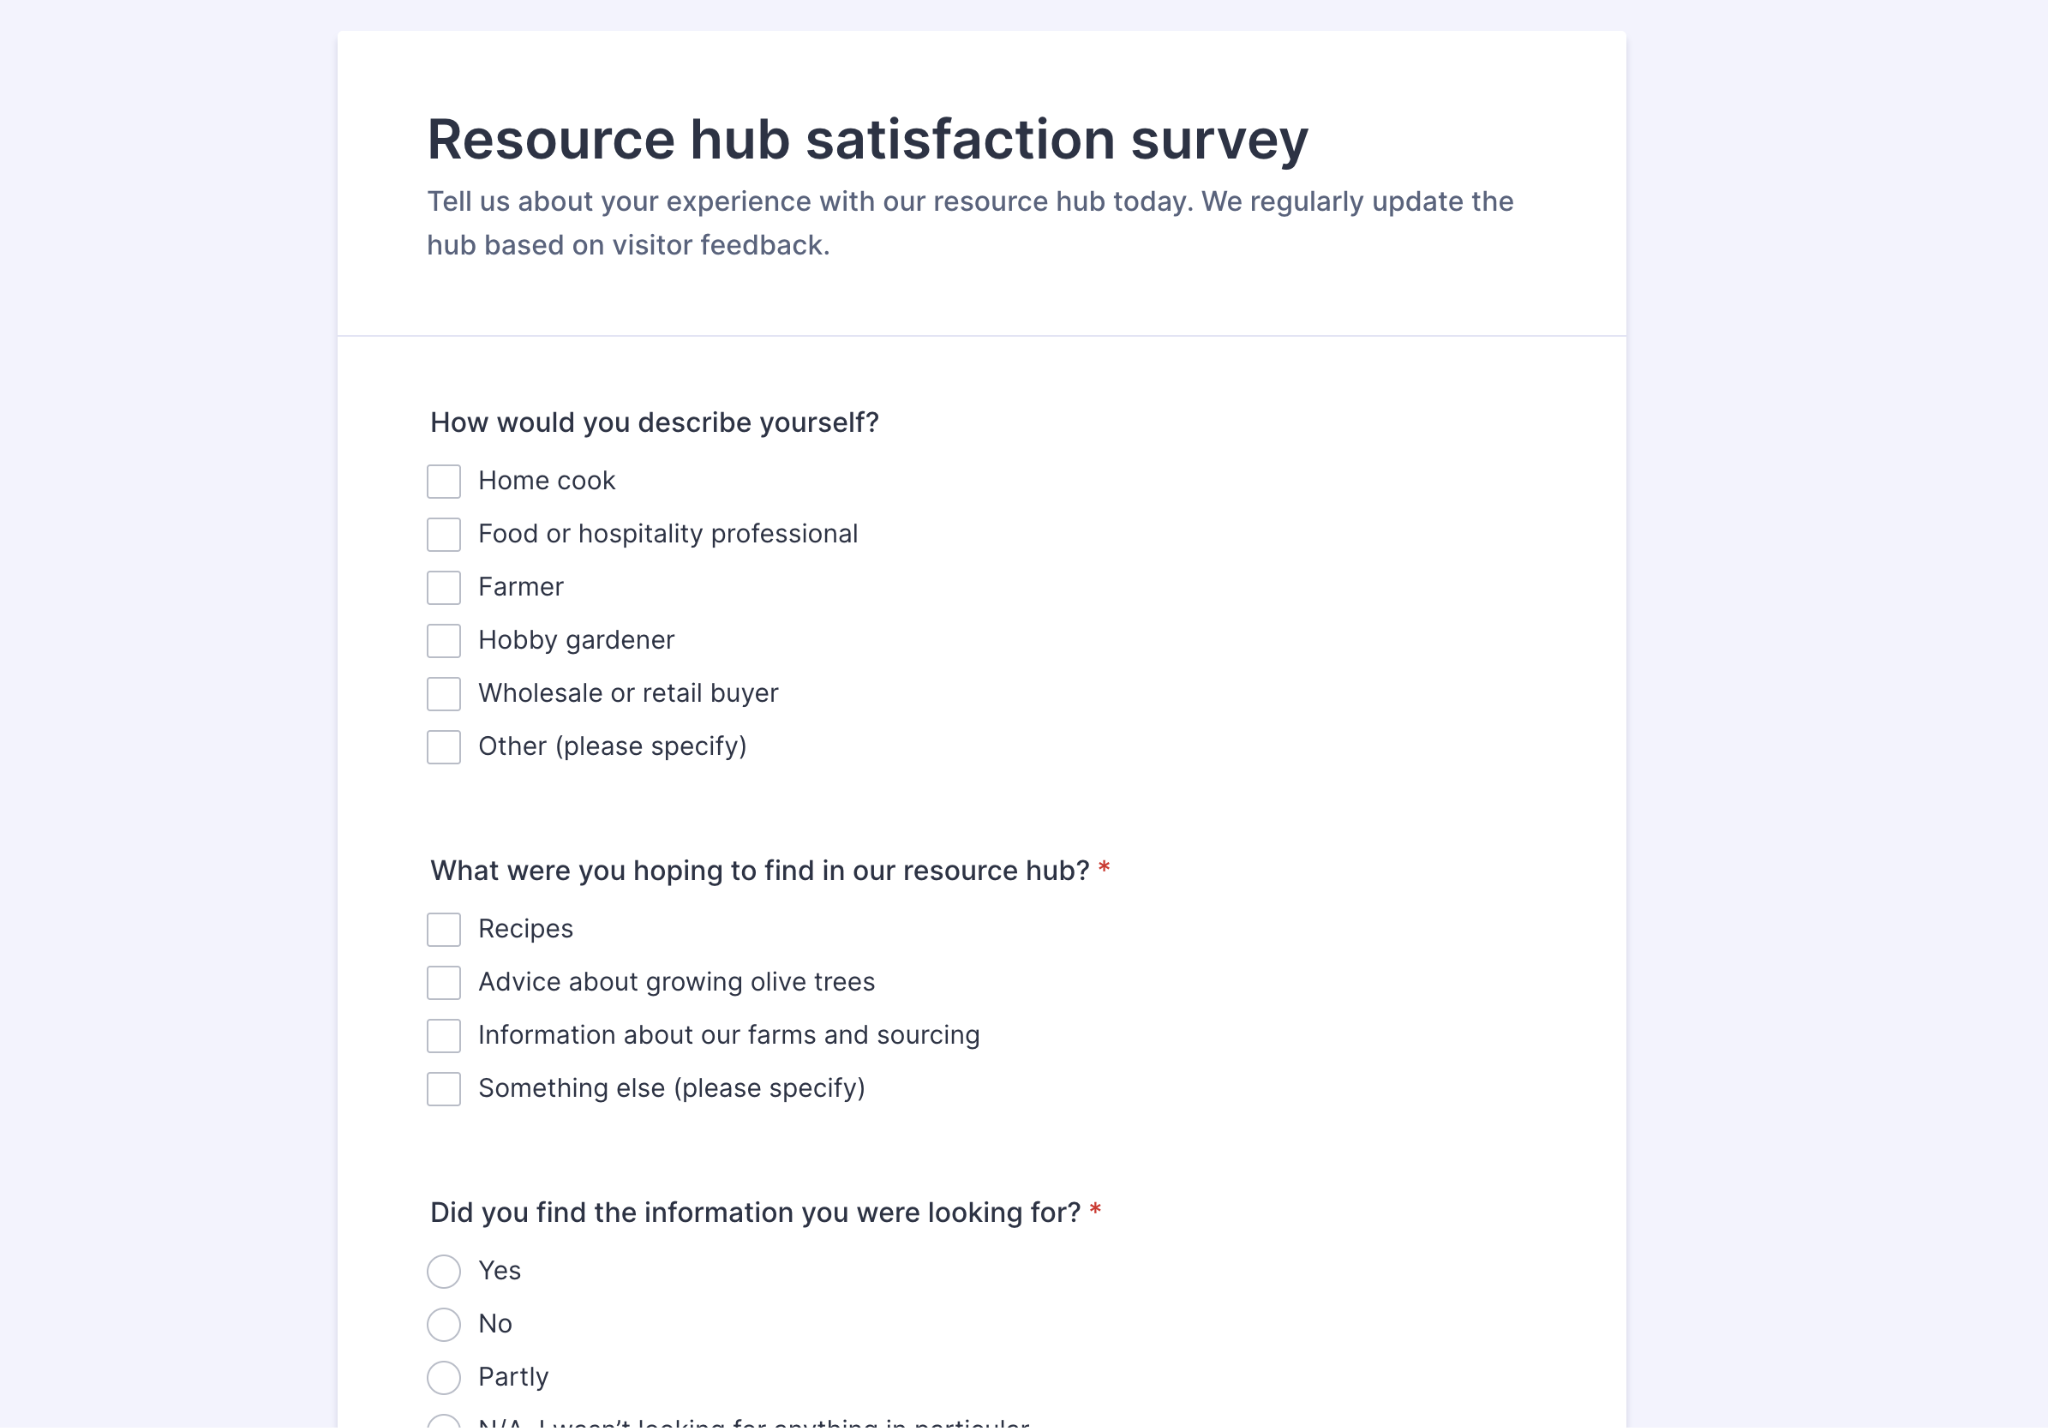
Here’s what my survey looks like.
2. Organize responses in Jotform Tables
Every response you receive will automatically flow into a Jotform table. (You can also send submissions to apps outside of Jotform.)
To access your Jotform table, head to your workspace.
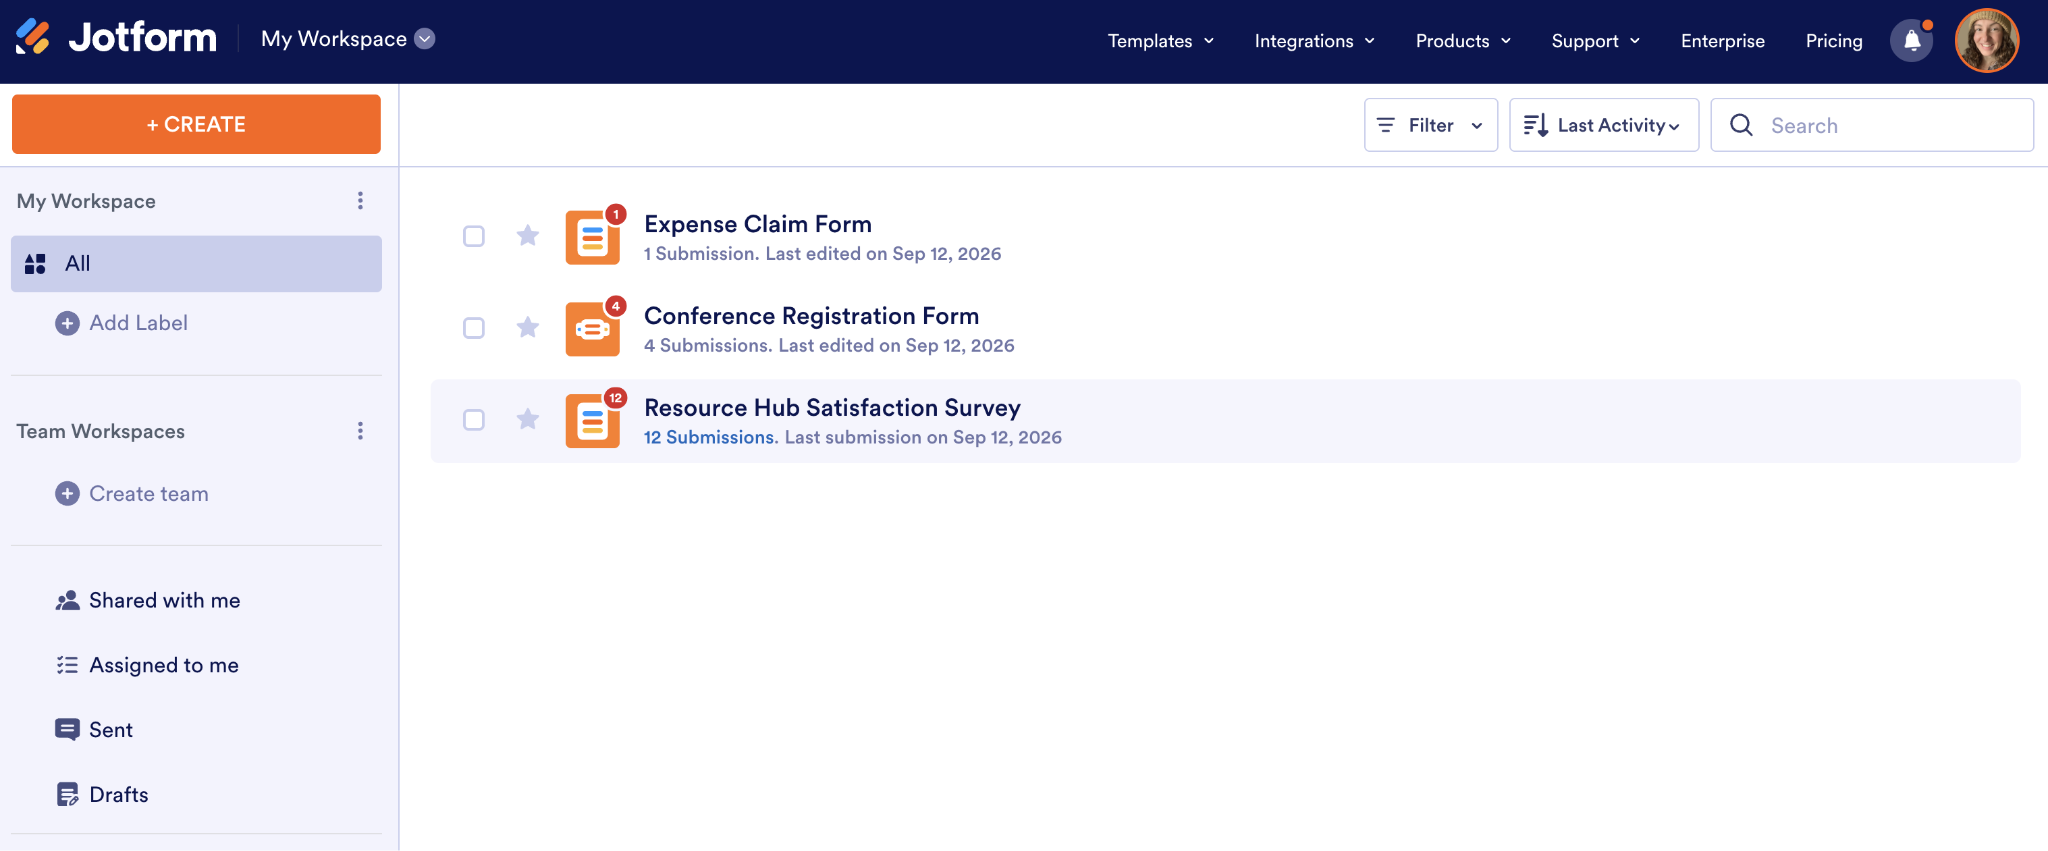
Under each form’s name, you’ll see the number of submissions you’ve gotten. Click the number to go to the table.
Here’s what my table looks like.
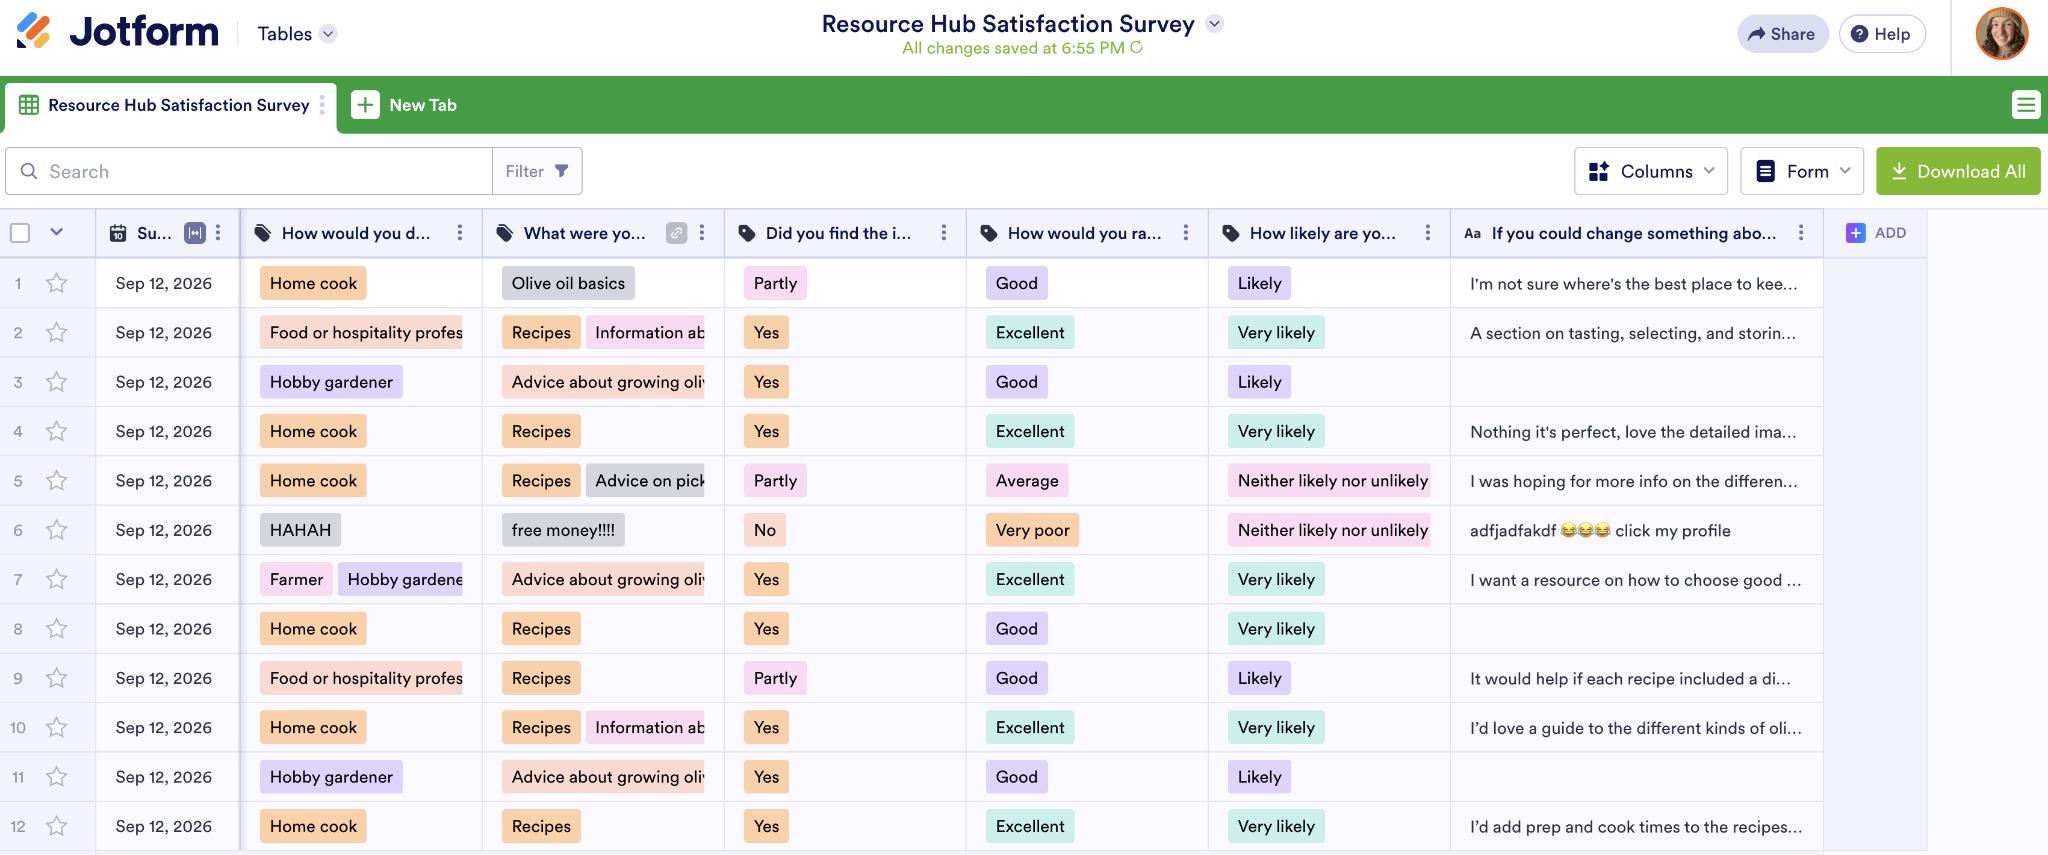
You have several ways to organize your responses. Click the Three dots icon (⋮) next to a column to sort it in ascending or descending order.
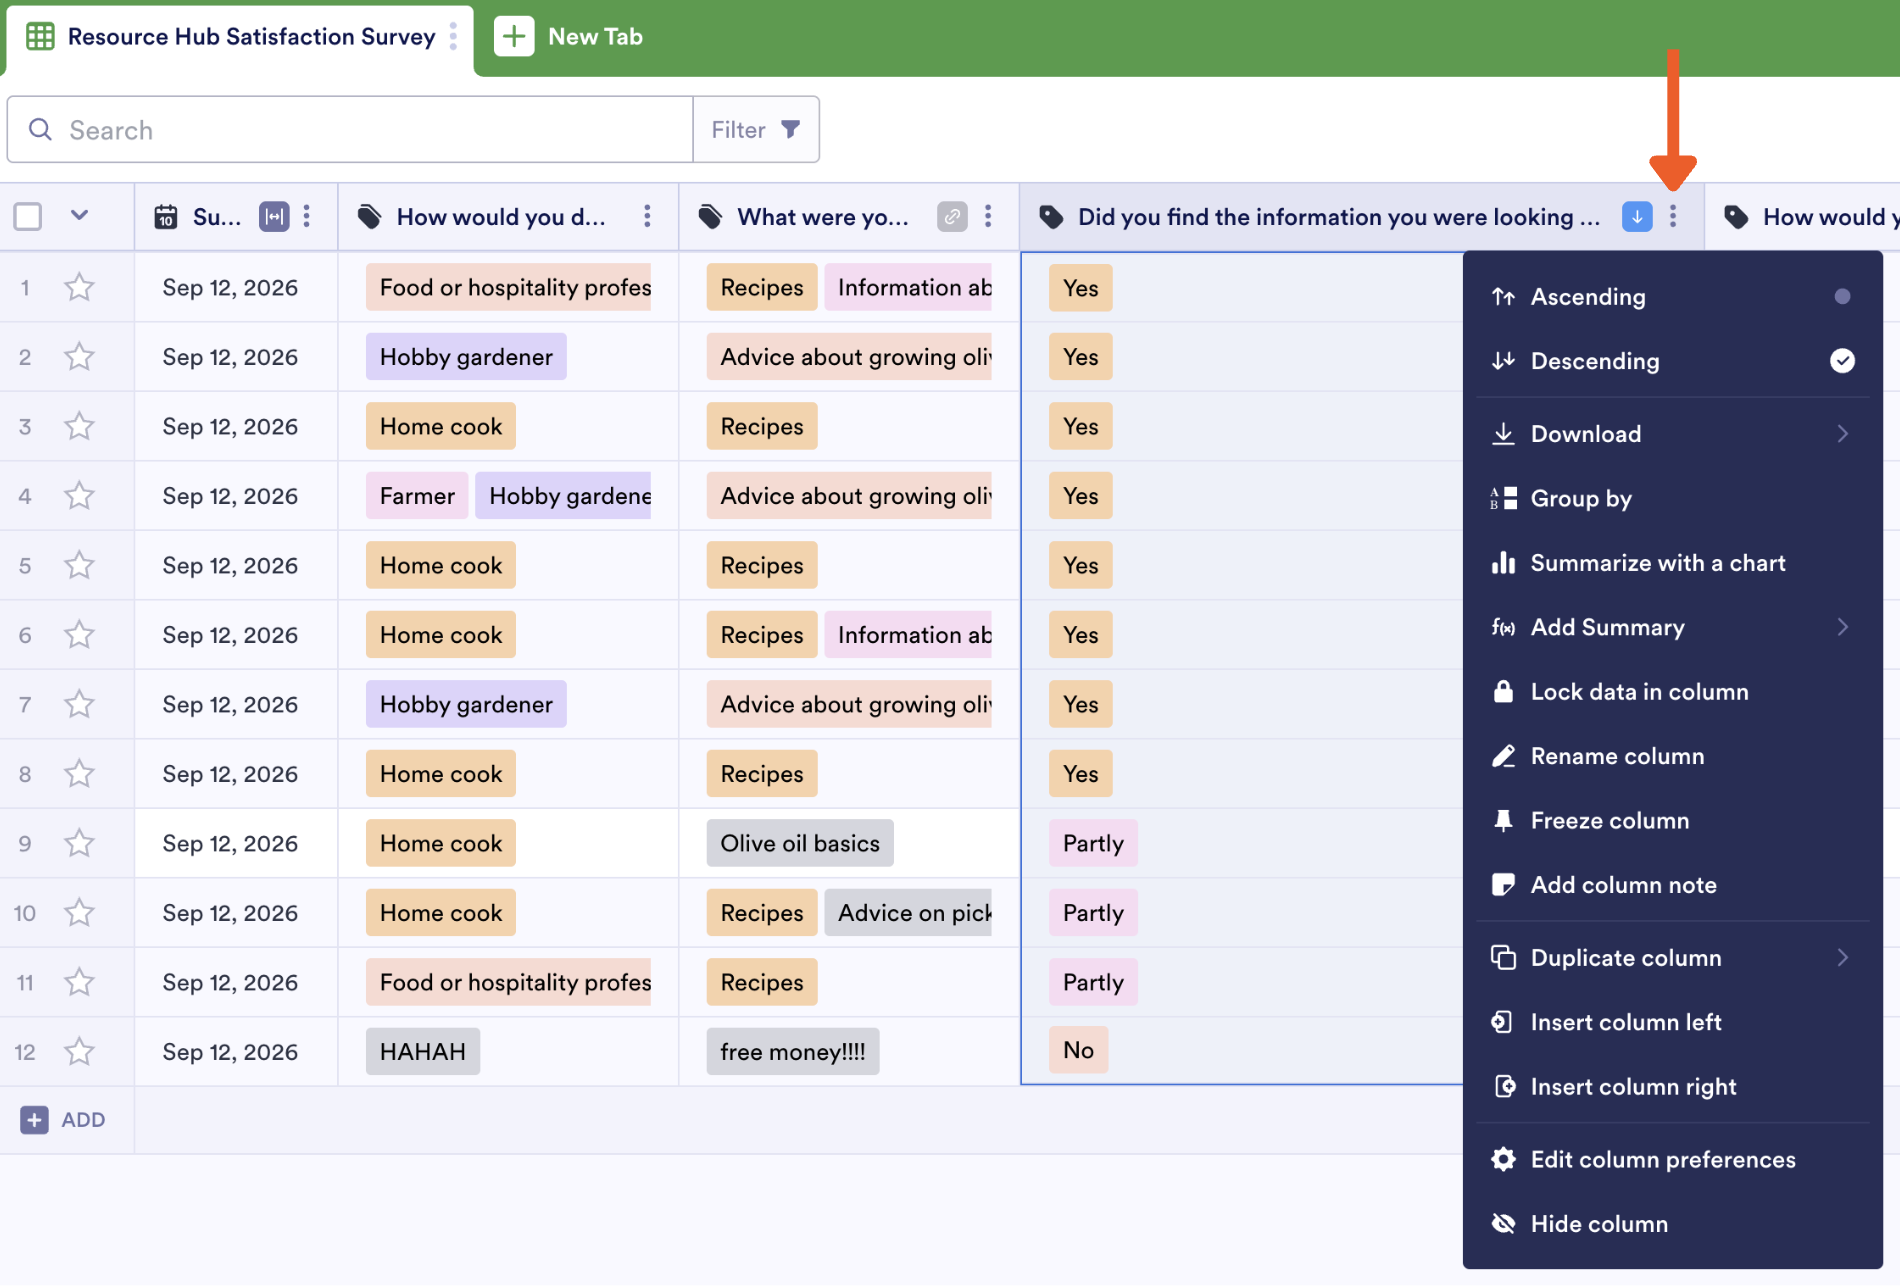
Sorting can help speed up the cleanup process. For example, when I sort by content quality, it’s easy for me to see that my single poor rating turns out to be junk. The respondent answered “HAHAH” and “free money!!!!” in the text fields, a clear signal that I can strike it from the dataset.
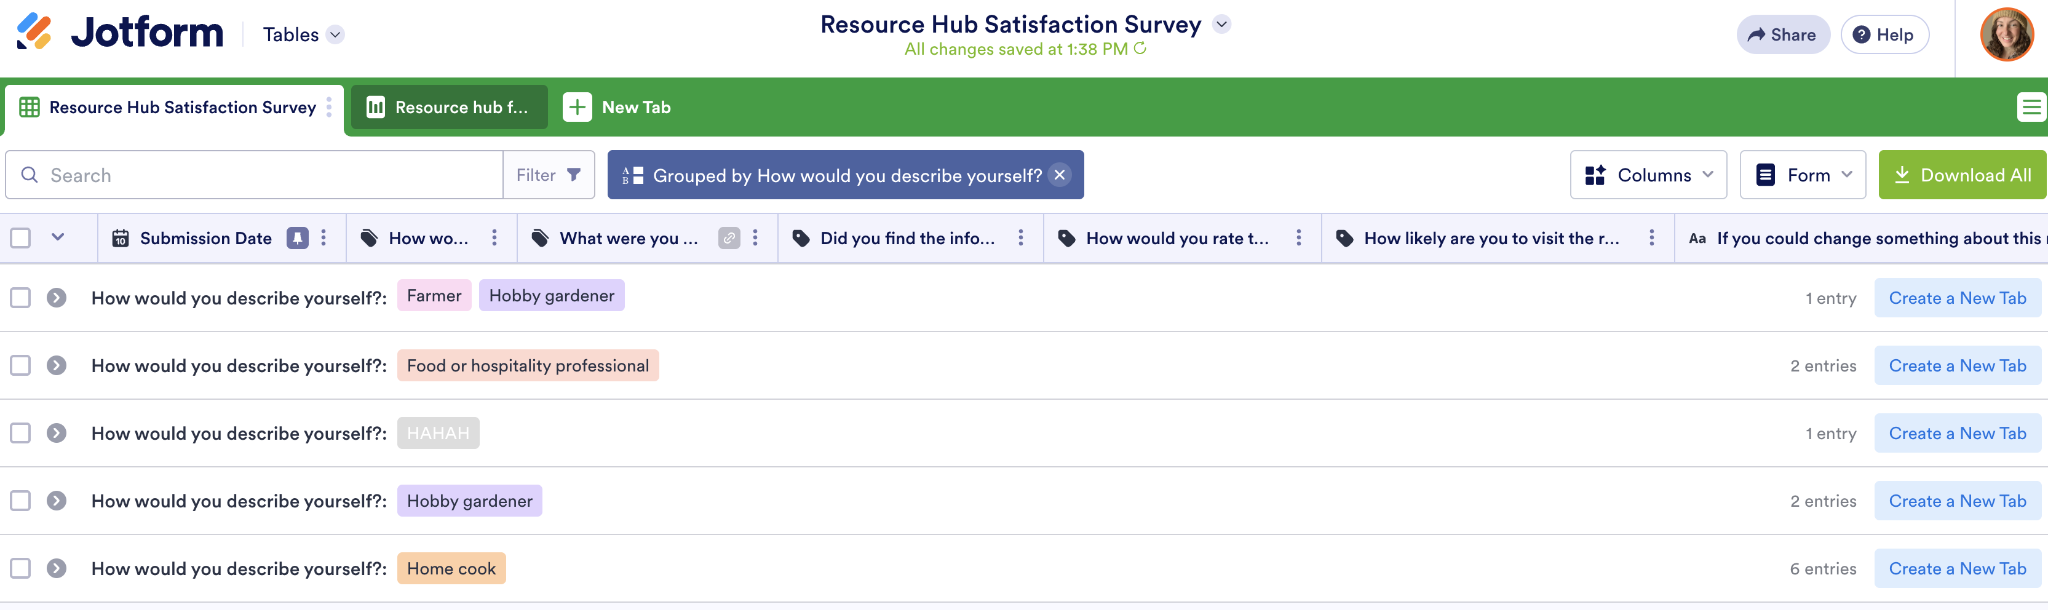
From the same menu, you can also click Group By to organize a row into collapsible groups, helping you check the quality of your sample.
Grouping by “How would you describe yourself?” highlights the mix of people who answered my survey. If six home cooks and only one farmer responded, that might be a sign my olive tree guides aren’t reaching my target audience.
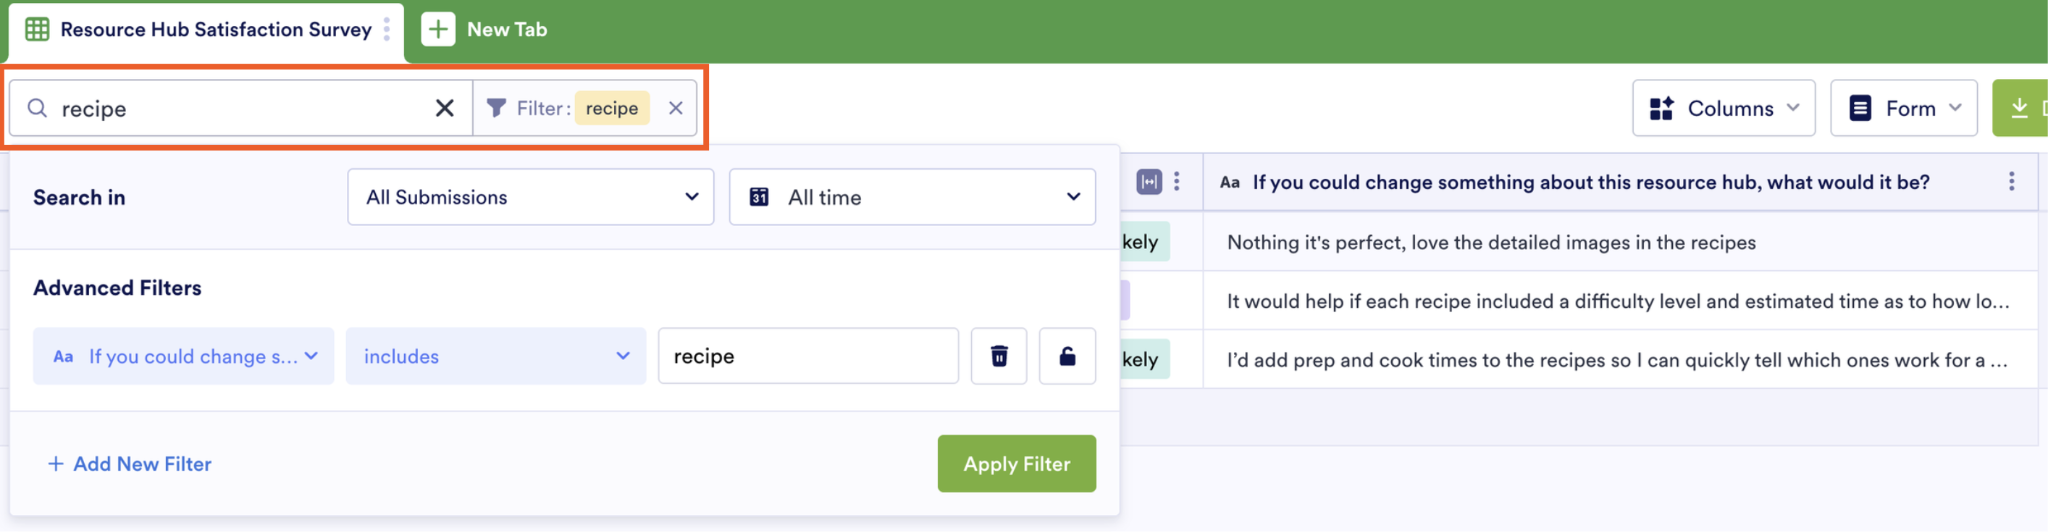
Apply filters to show only data you care about. Type your desired term into the search bar, or click Filter for advanced options. For example, I created a view isolating every open-ended answer that mentions the word “recipe.”
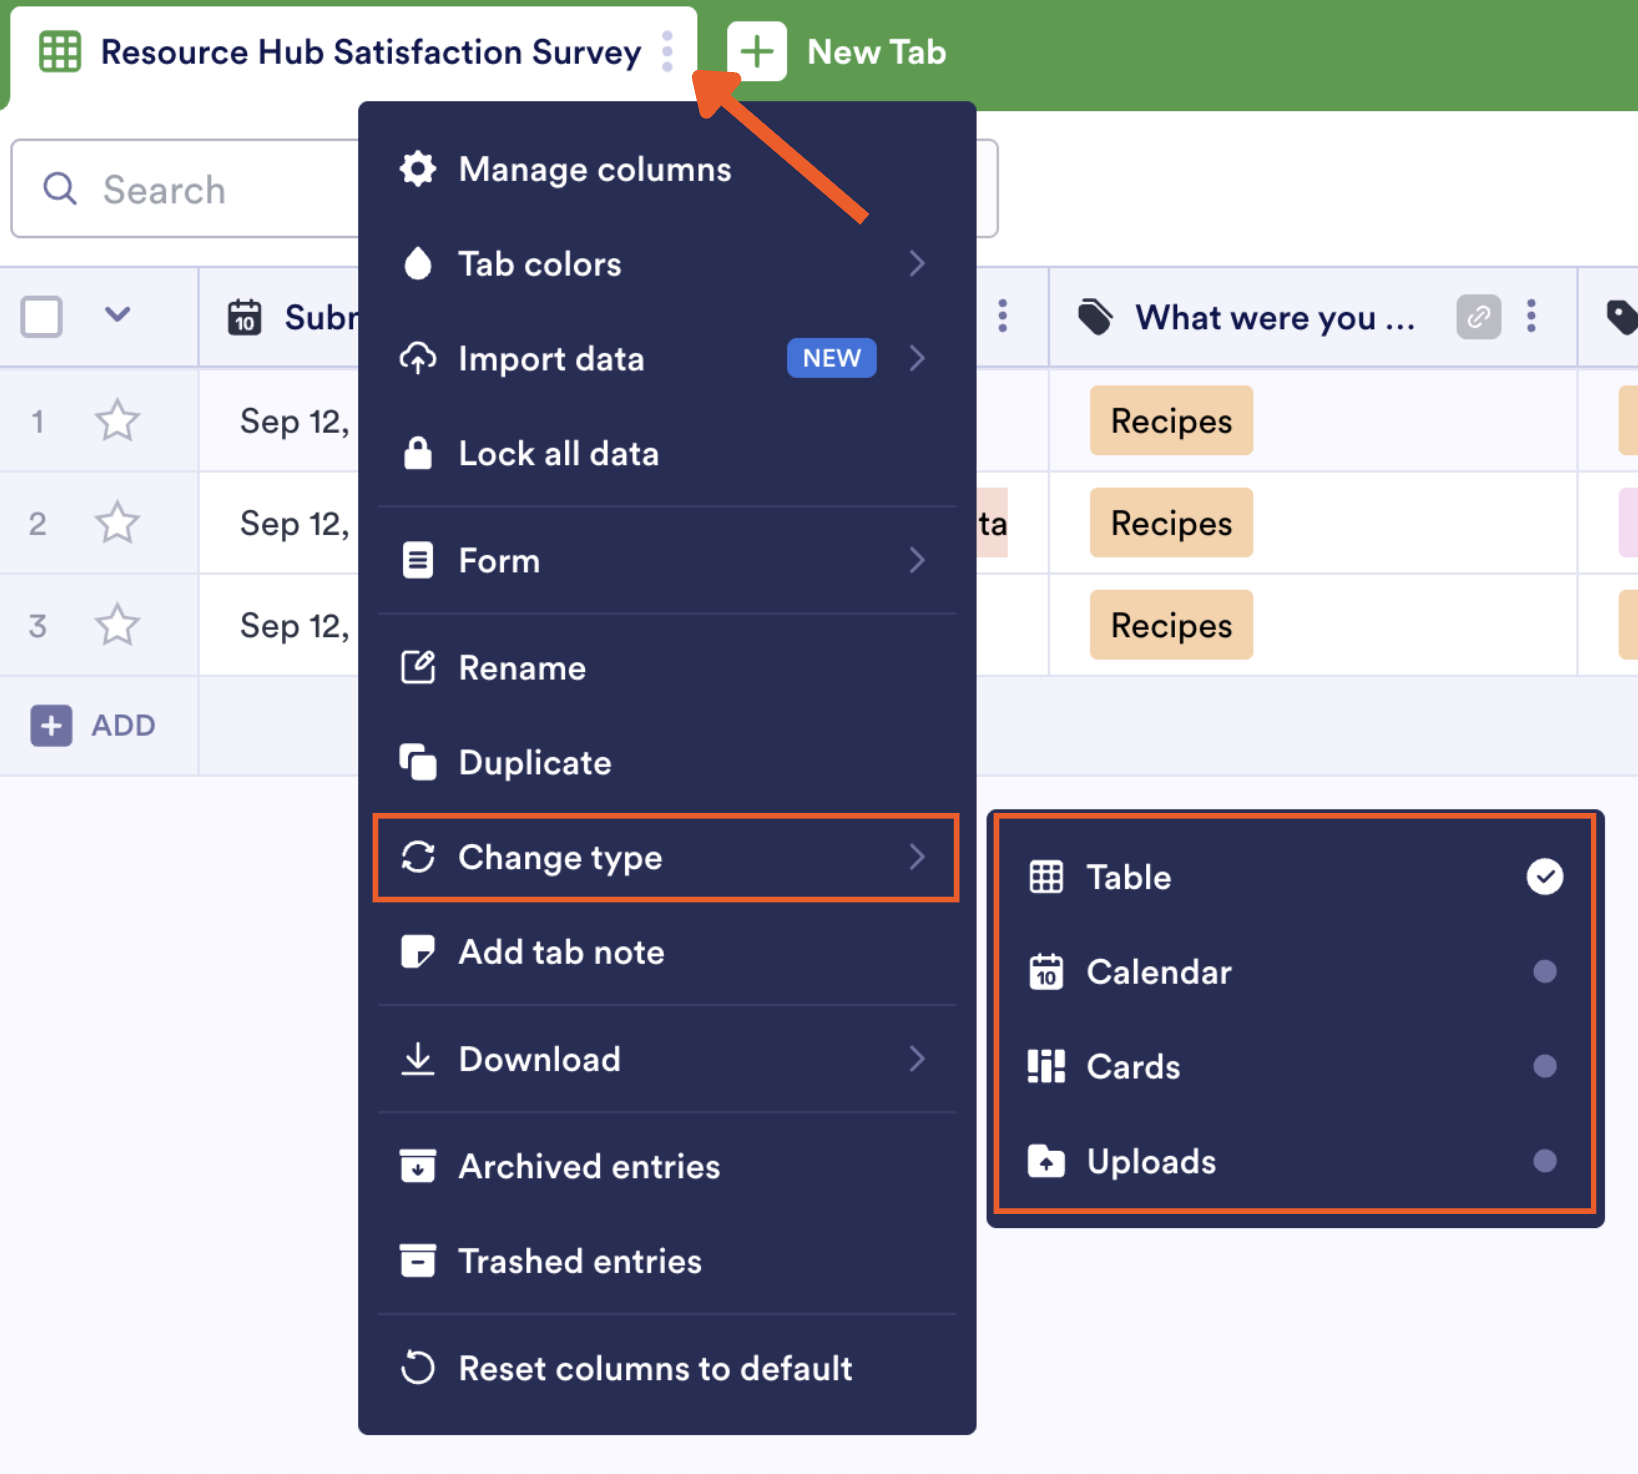
To visualize your data in another way, click the Three dots icon (⋮) next to the tab name and change the view from there.
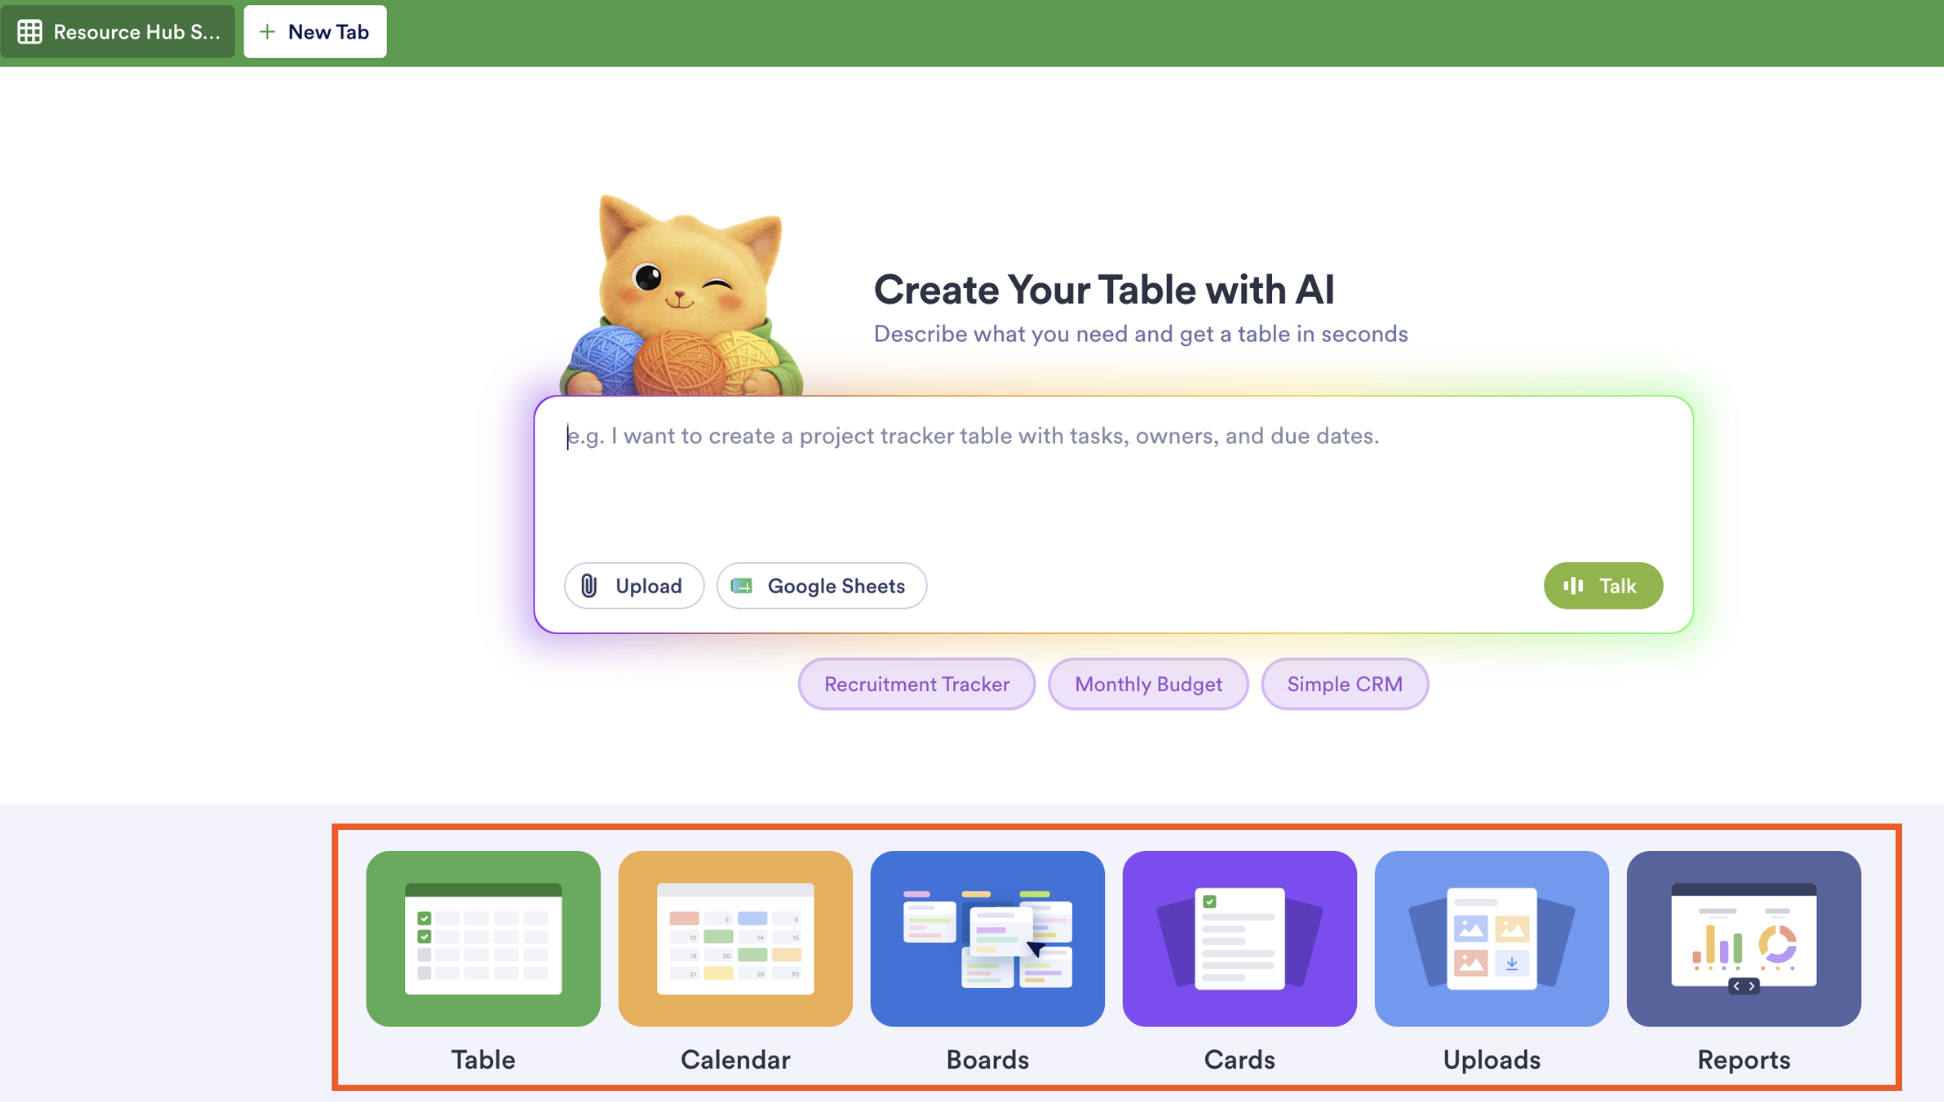
To preserve this structure and add another tab, click New Tab. At the bottom of the screen, you’ll see options for different visual types. Click the one you want. I’ll choose Cards.
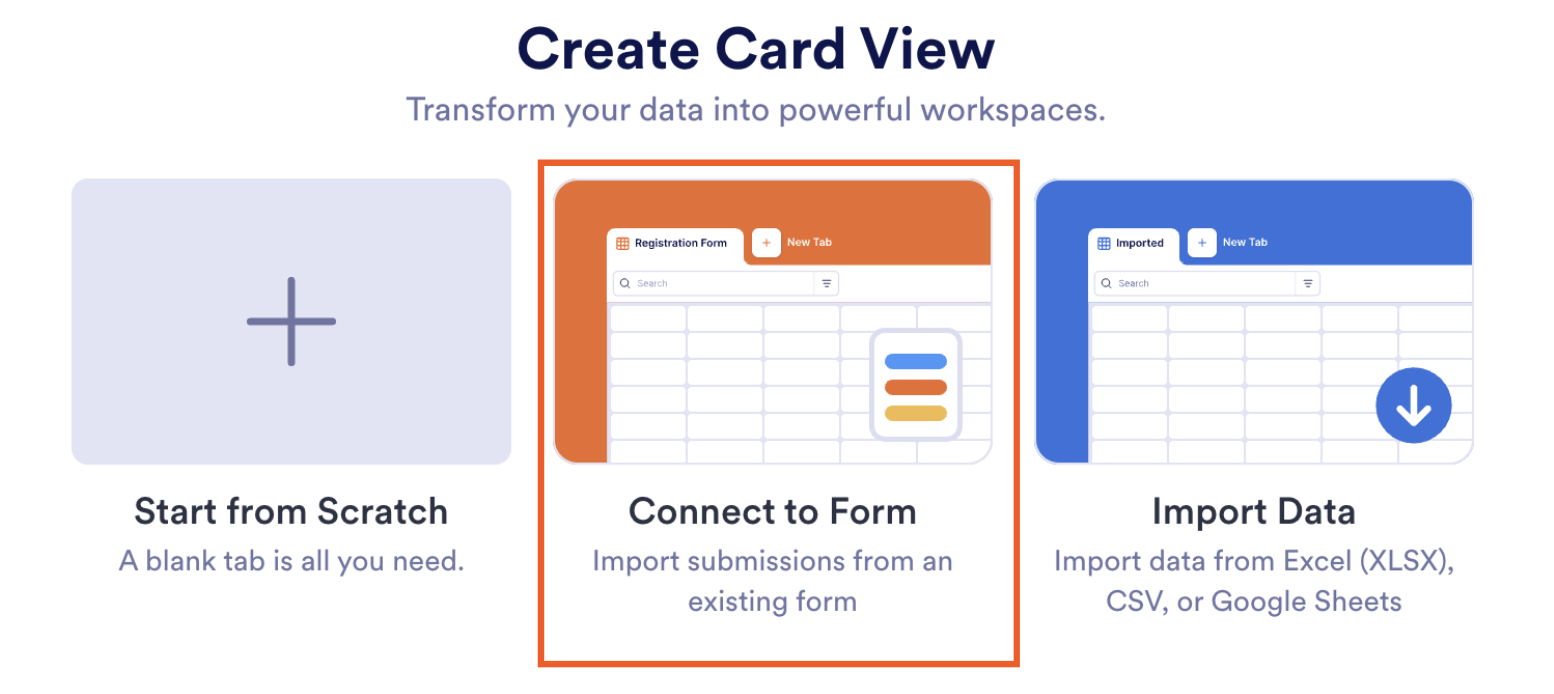
Next, click Connect to Form.
Configure the look of your view, then click Create.
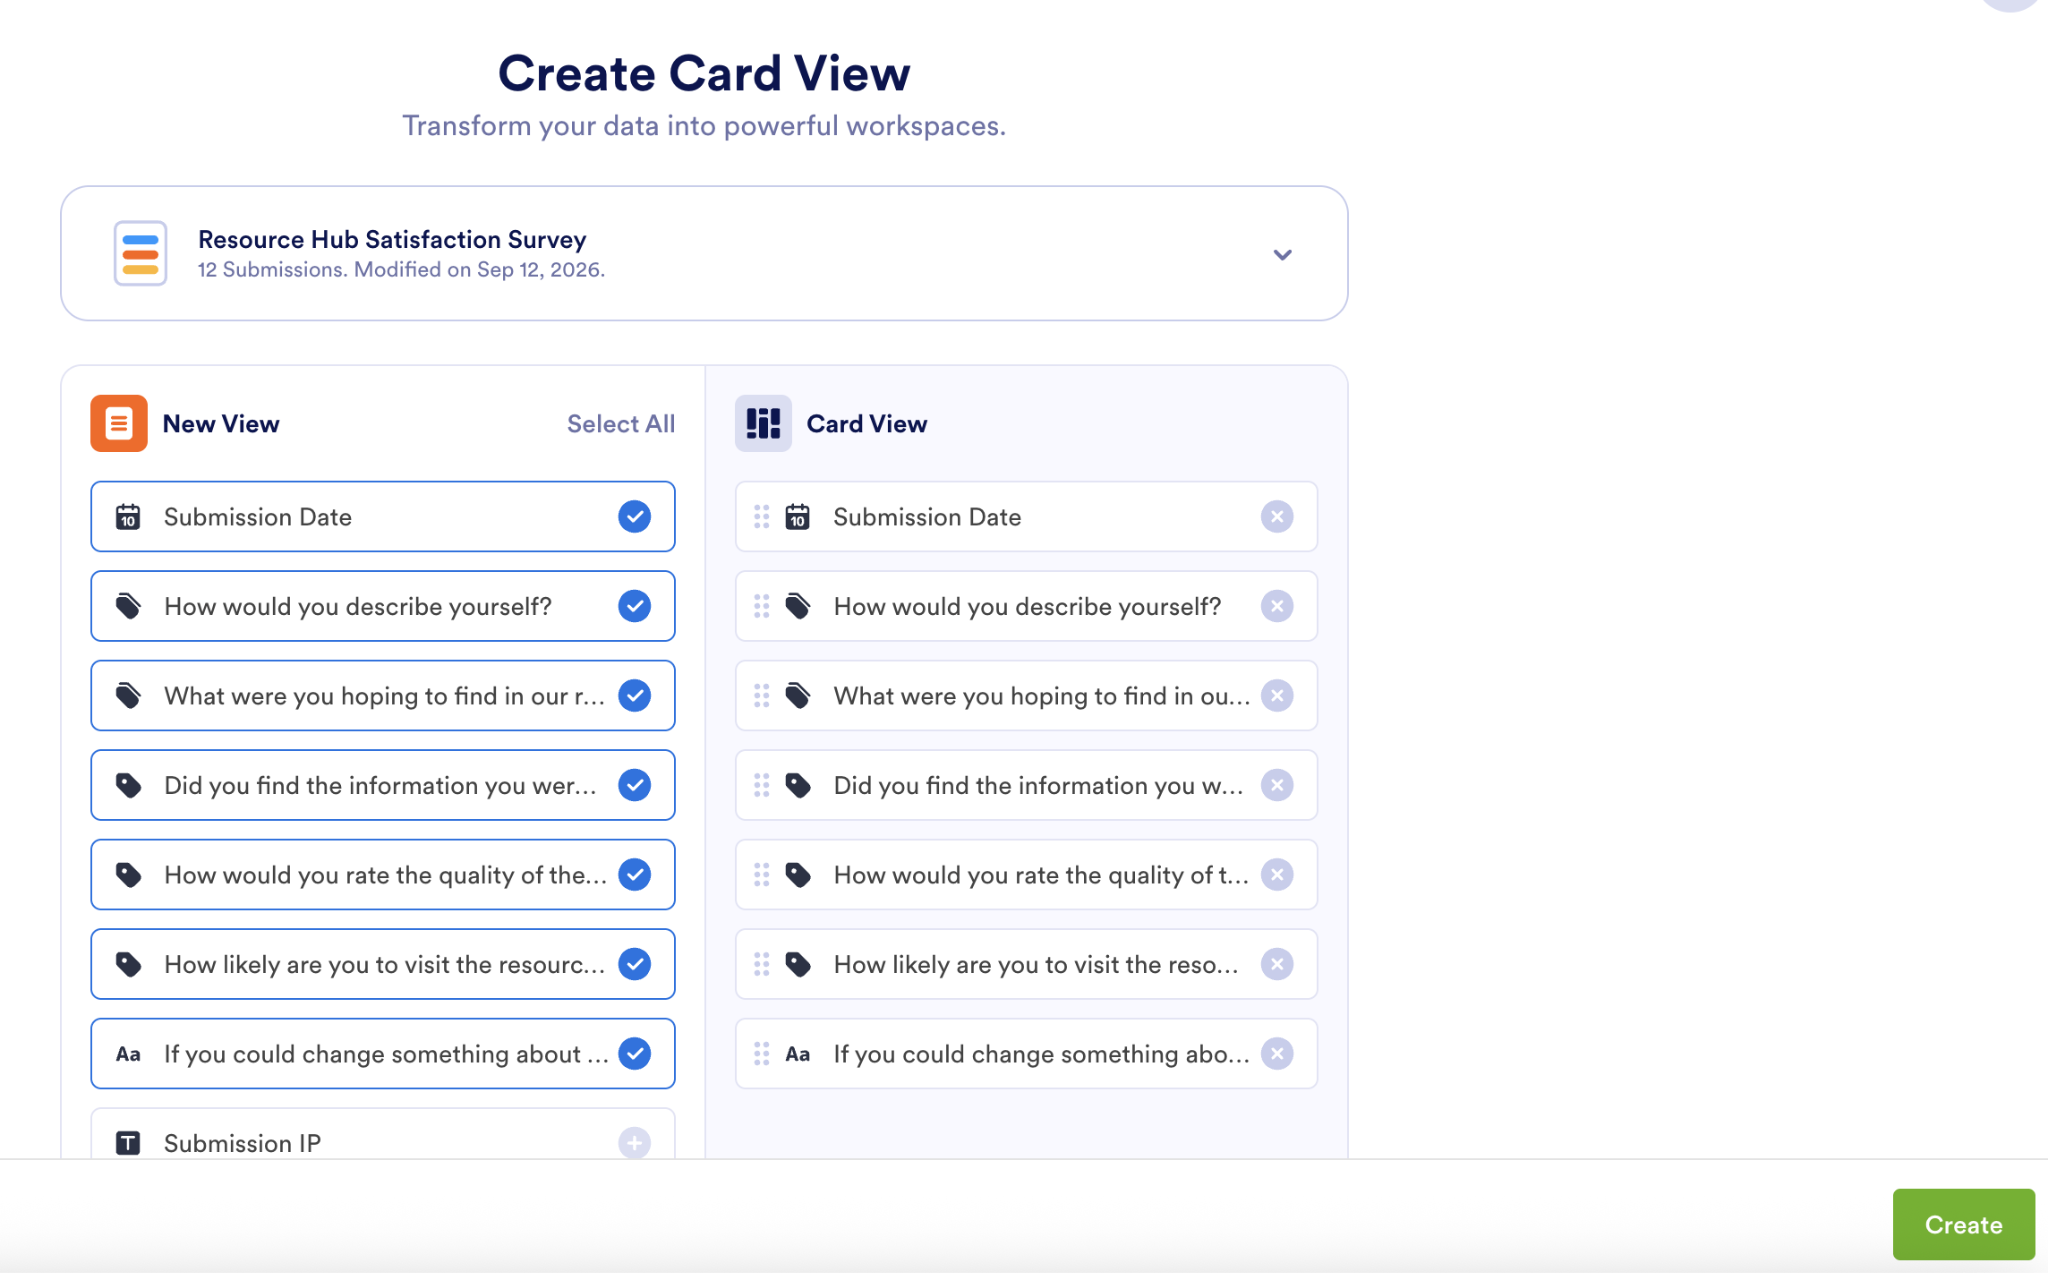
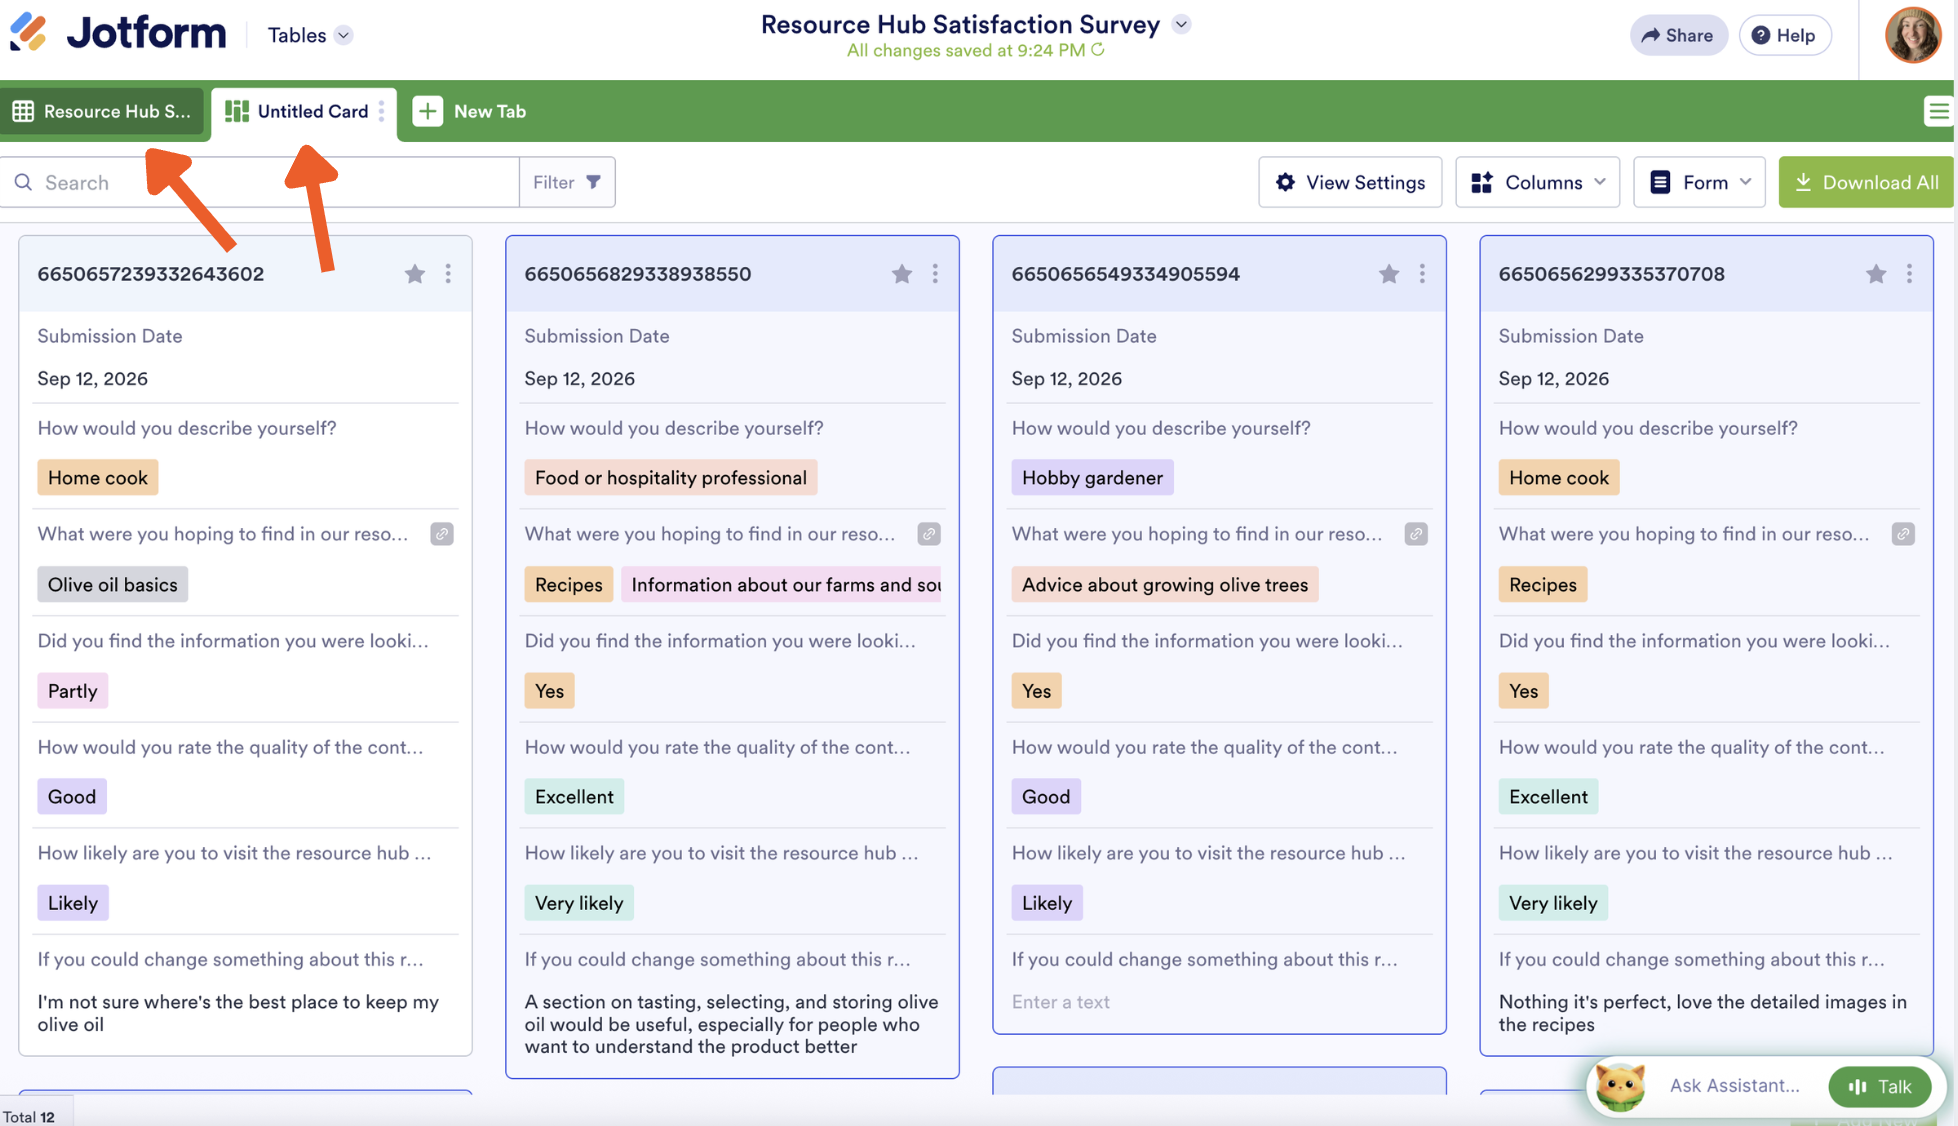
You’ll see your new editable view. And at any point, you can toggle back to the table in the tabs.
3. Check survey performance with Jotform Form Analytics
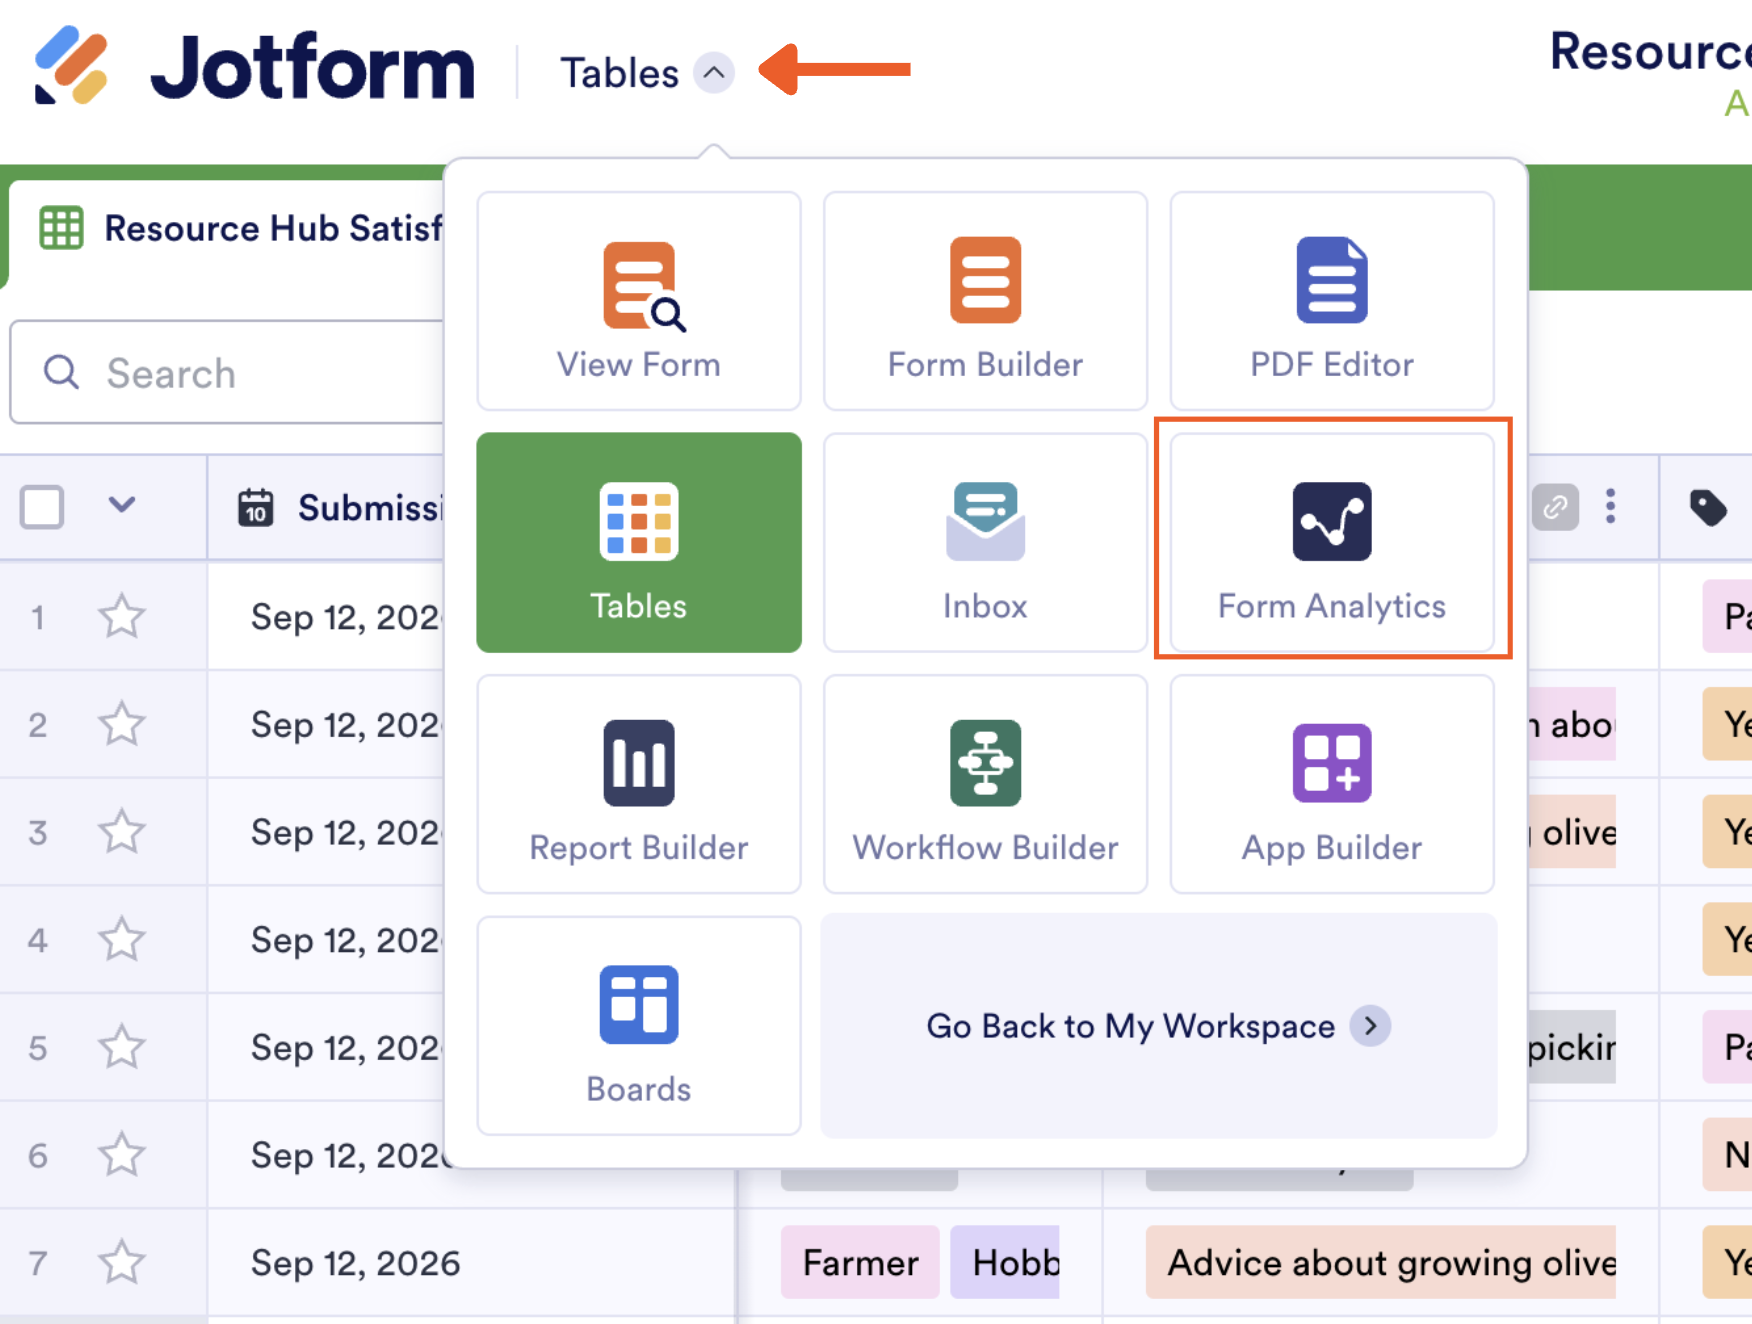
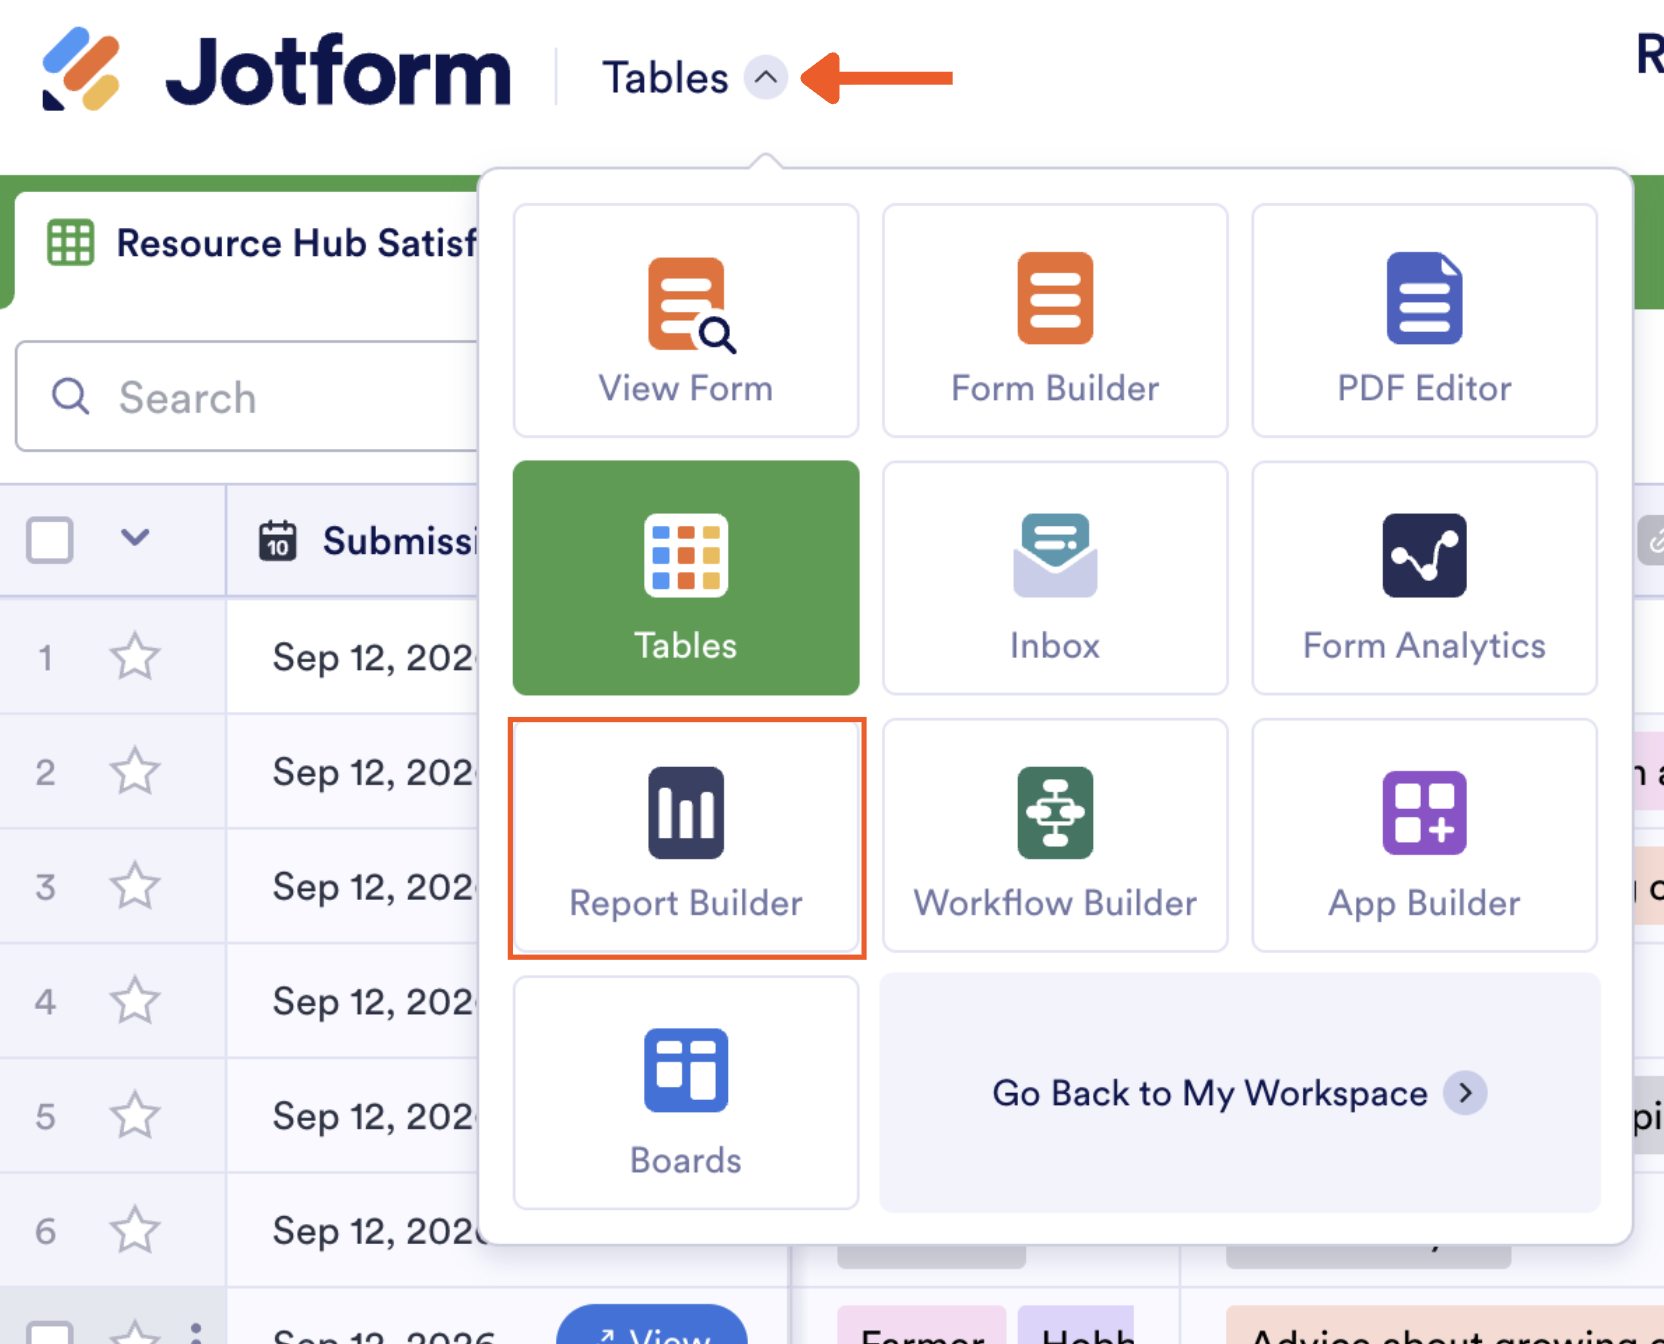
Form Analytics shows you performance insights. Access it by going to the Form Analytics dashboard or, from your table, by clicking the arrow next to Tables in the top-left corner, then clicking Form Analytics.
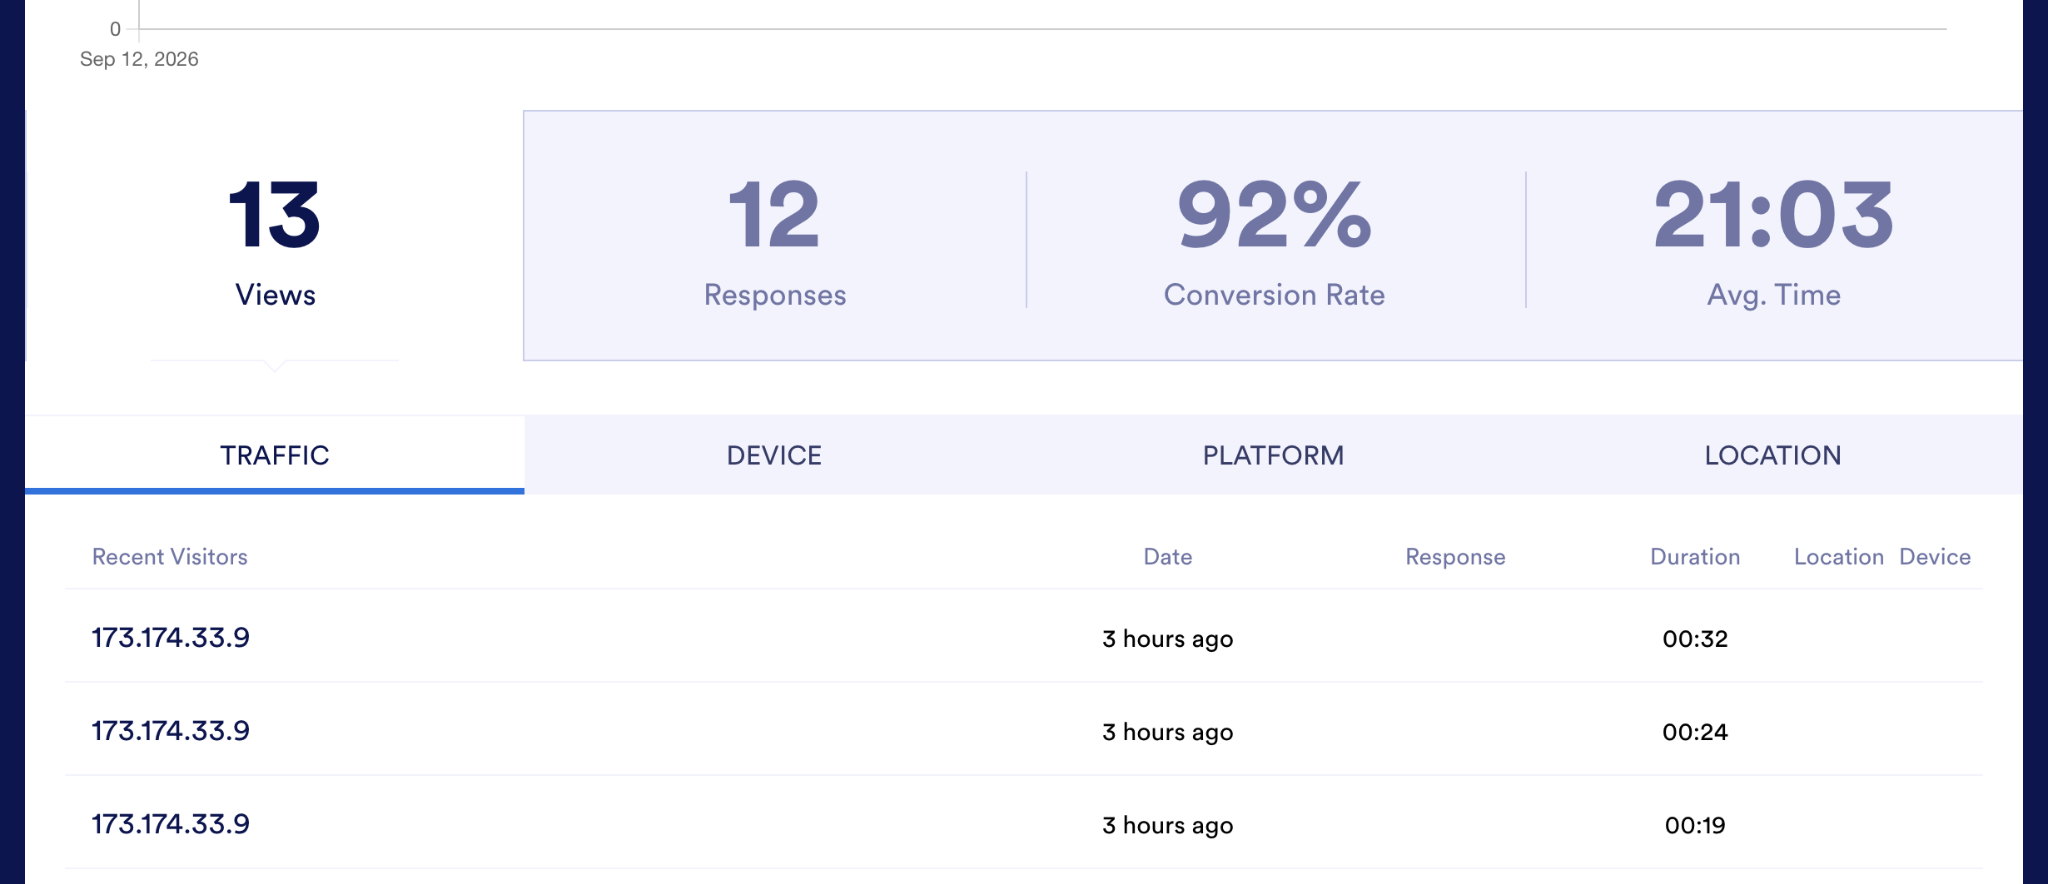
You’ll see a graph of form views over time and, beneath it, four stats: views, responses, conversion rate, and average completion time. The traffic, device, platform, and location tabs tell you a little about who responded, giving you more helpful context for assessing sample quality.
4. Build visual reports with Jotform Report Builder
Once you know how well your data and survey are performing, you may want to share your insights with teammates. With the Jotform Report Builder, you can convert your responses into a customized report and download, print, or publish it as a shareable link.
To start, head to the Report Builder dashboard. To access it from your table, click the arrow next to Tables in the top-left corner and click Report Builder.
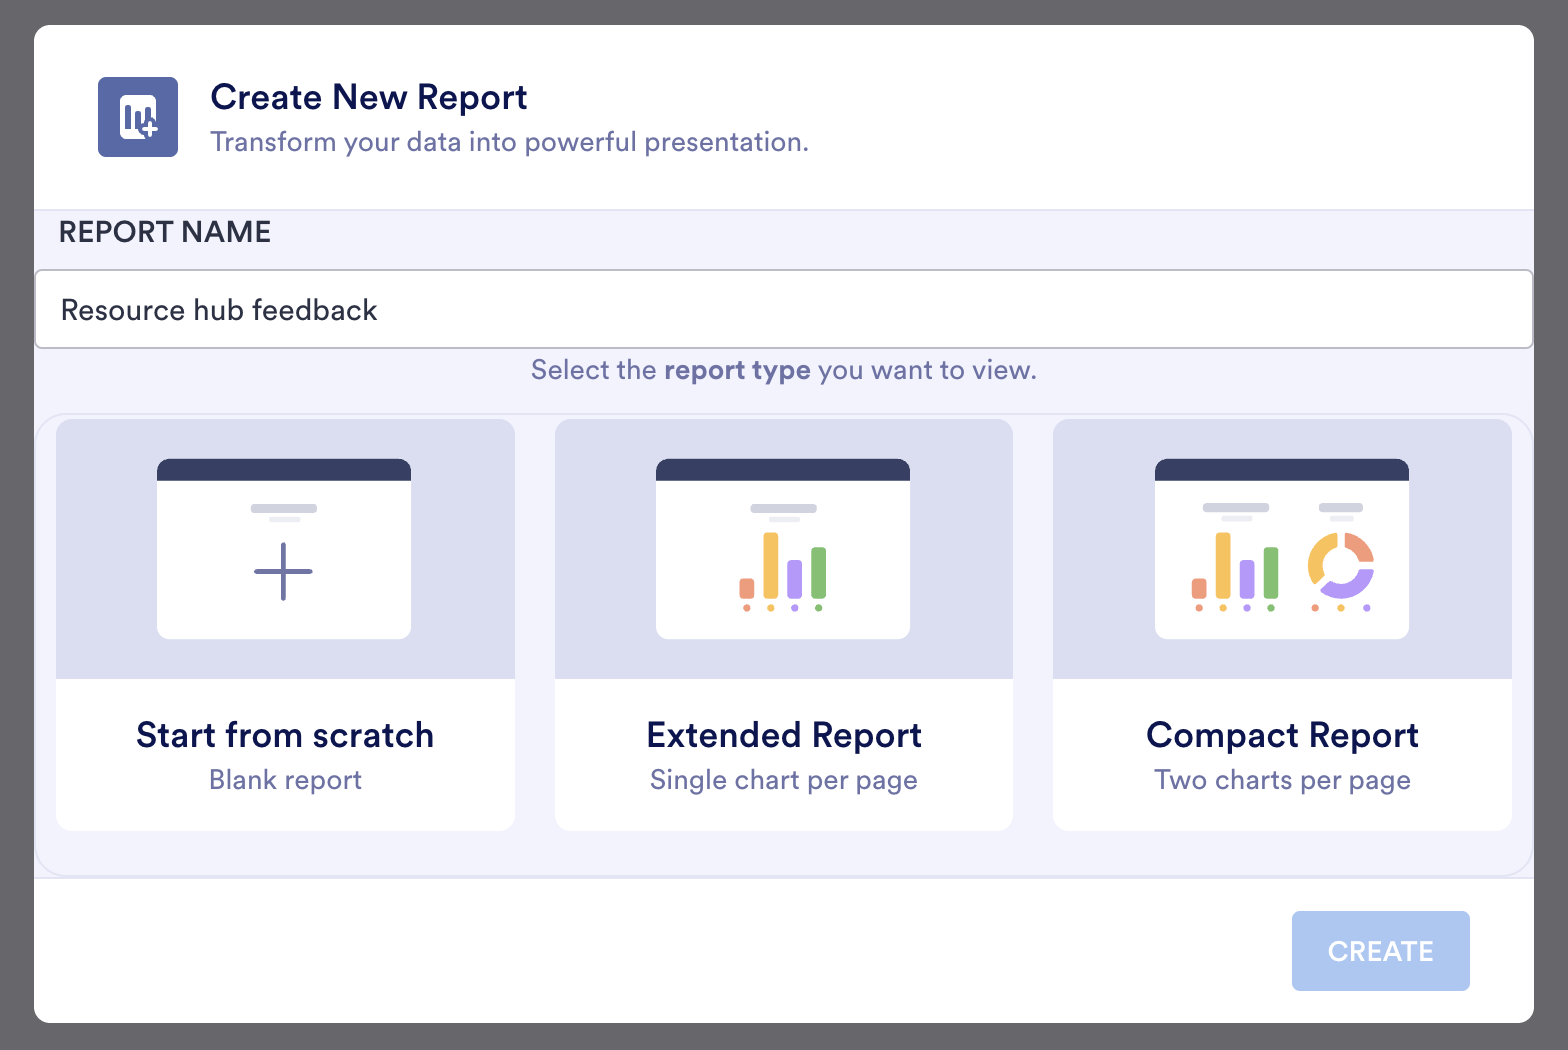
Now choose your desired report type:
- Start From Scratch: This gives you an empty report page. You manually add report types and design the layout yourself.
- Extended Report: Select this to generate a report that has one chart per page, based on your form fields.
- Compact Report: This generates a report with two charts per page, based on your form fields.
I started with one chart per page.
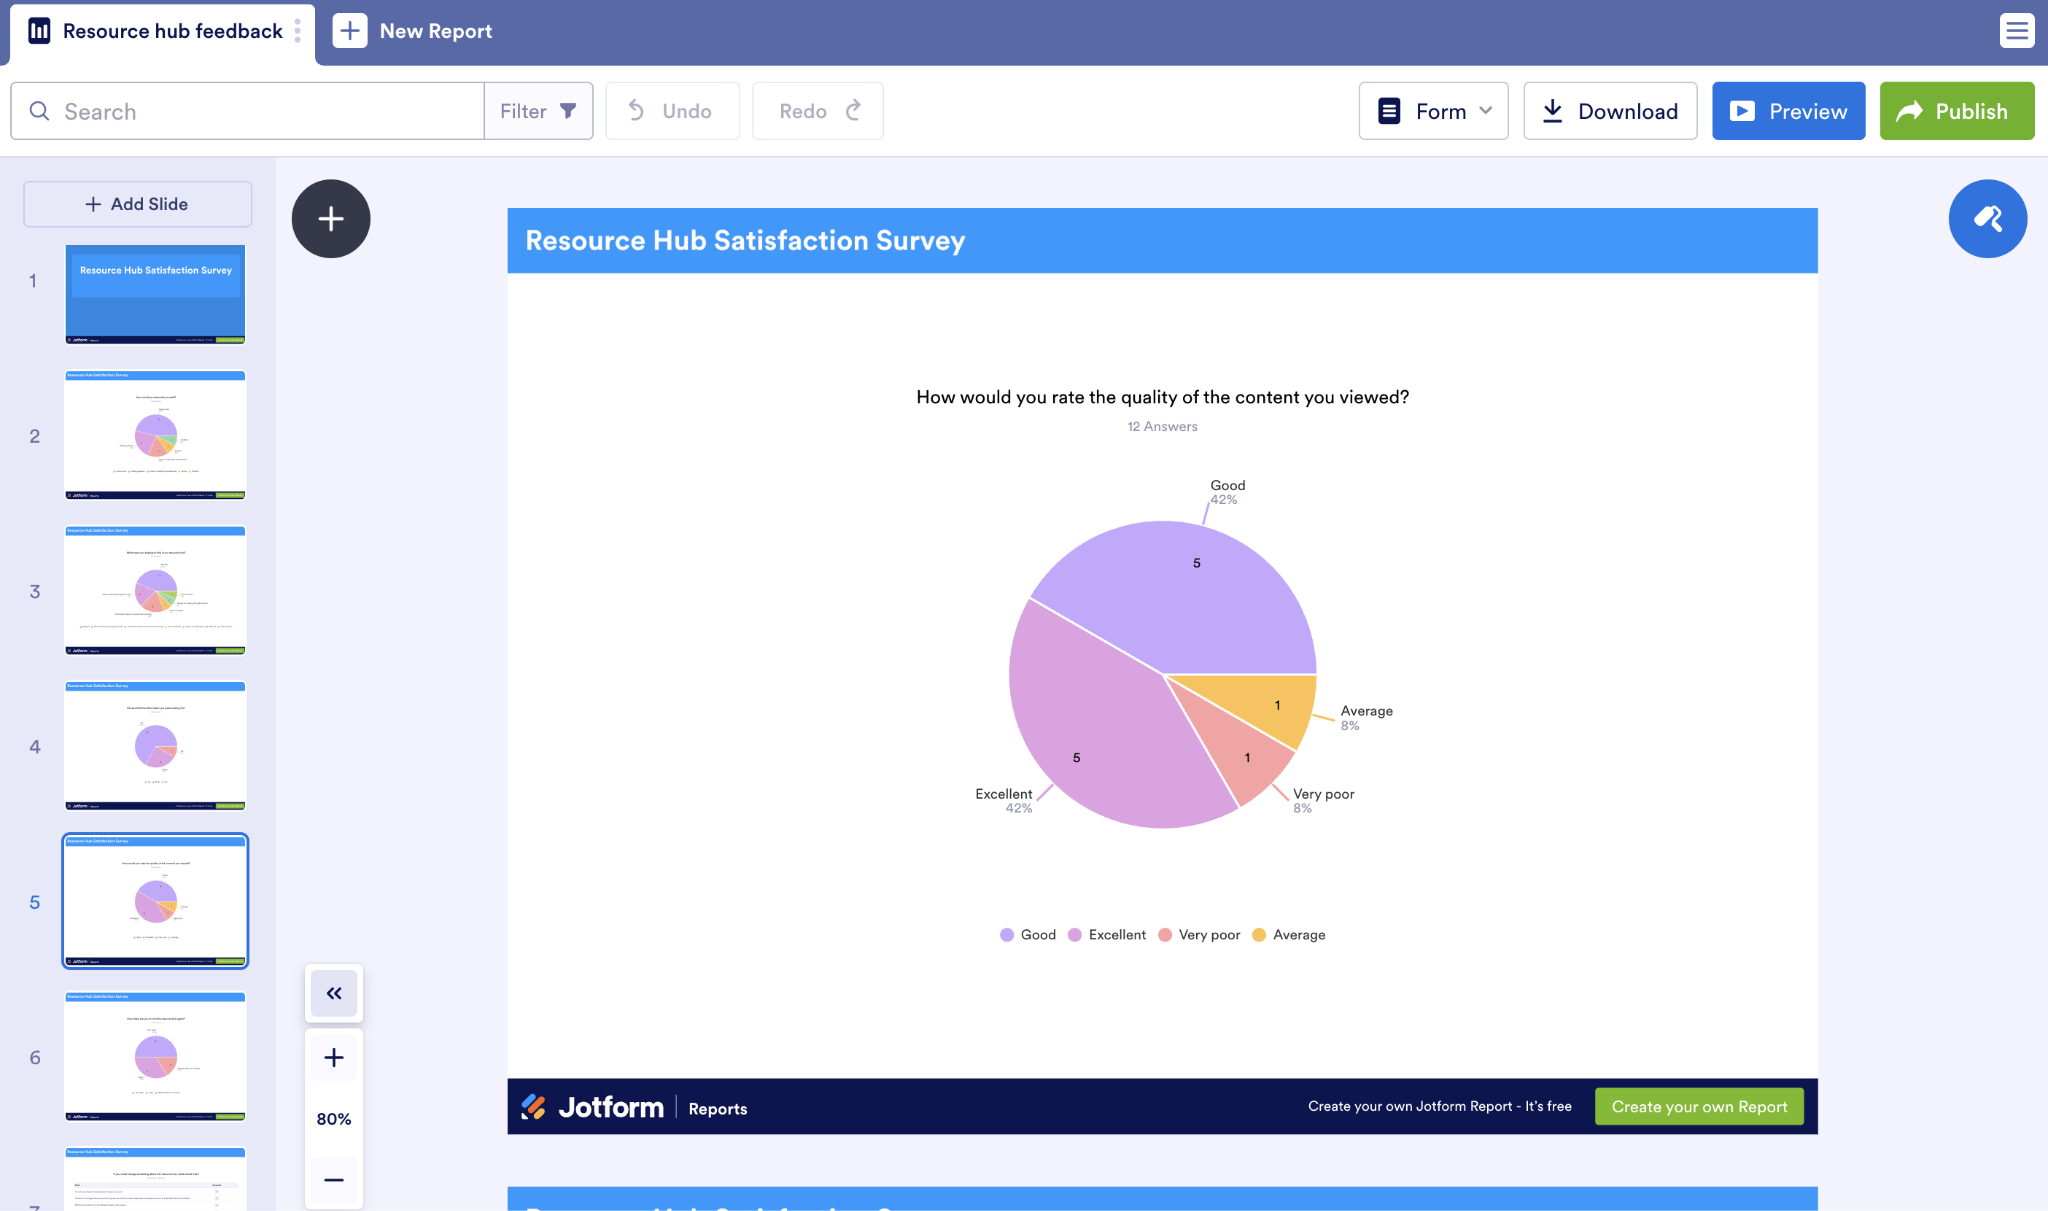
To simulate cross-tabulation, I duplicated a slide that measures how satisfied visitors were with the content quality. Then I filtered each slide by audience, so I can see how two different audiences felt about the content.
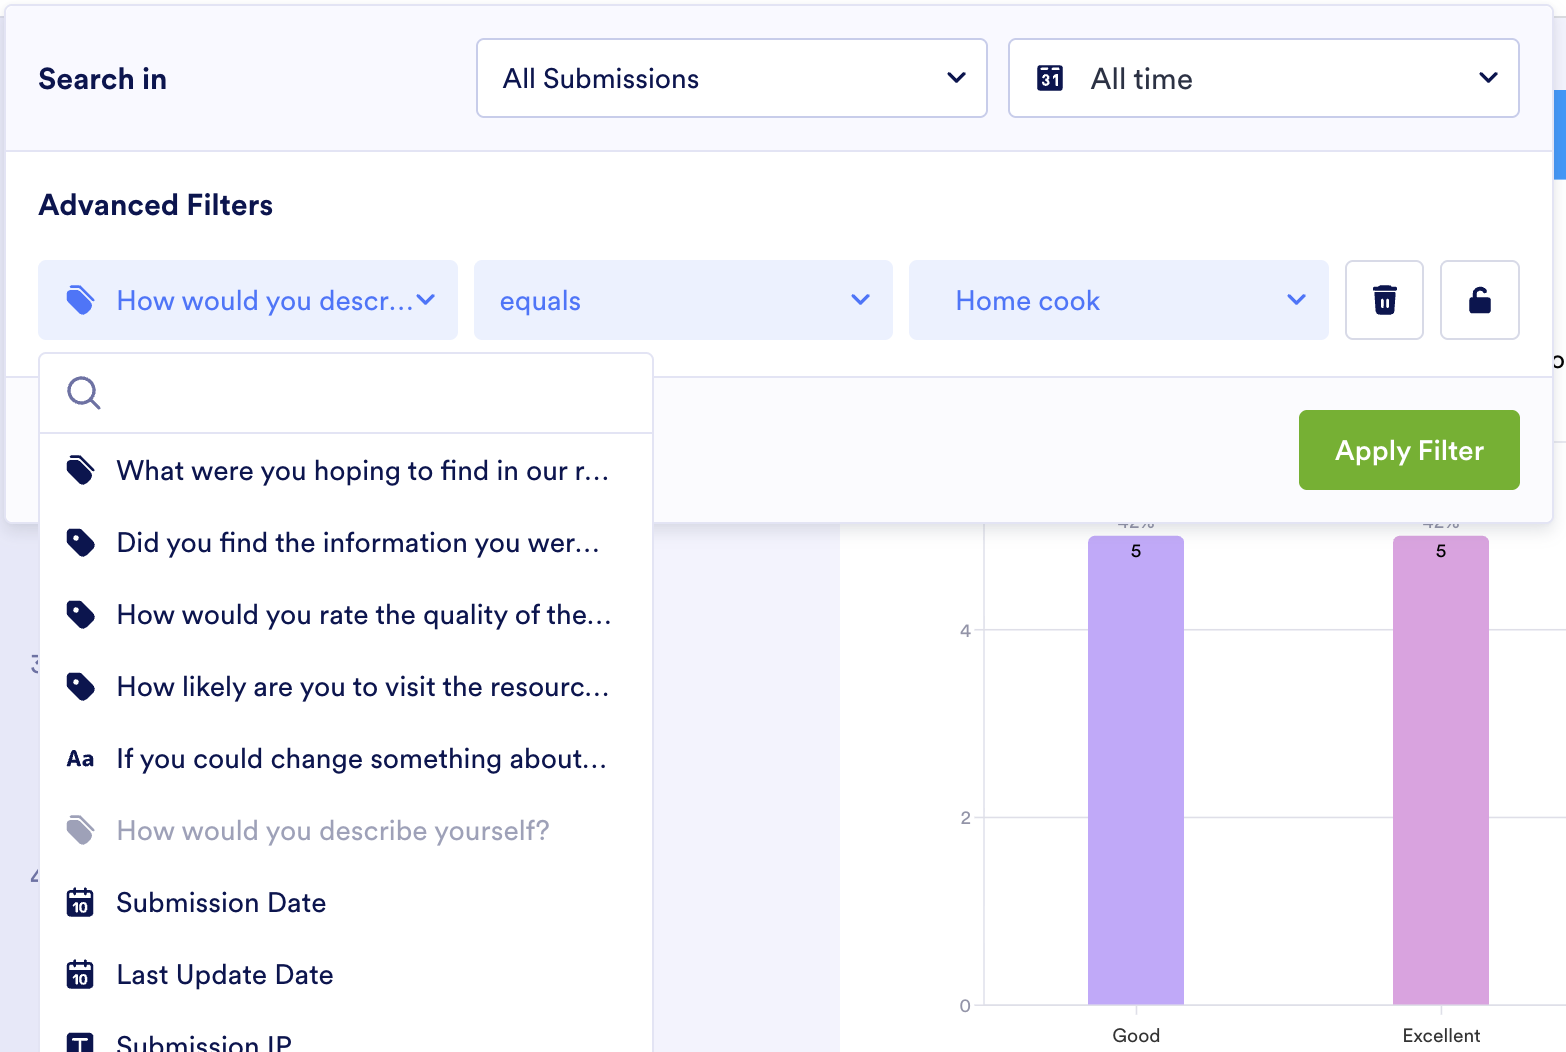
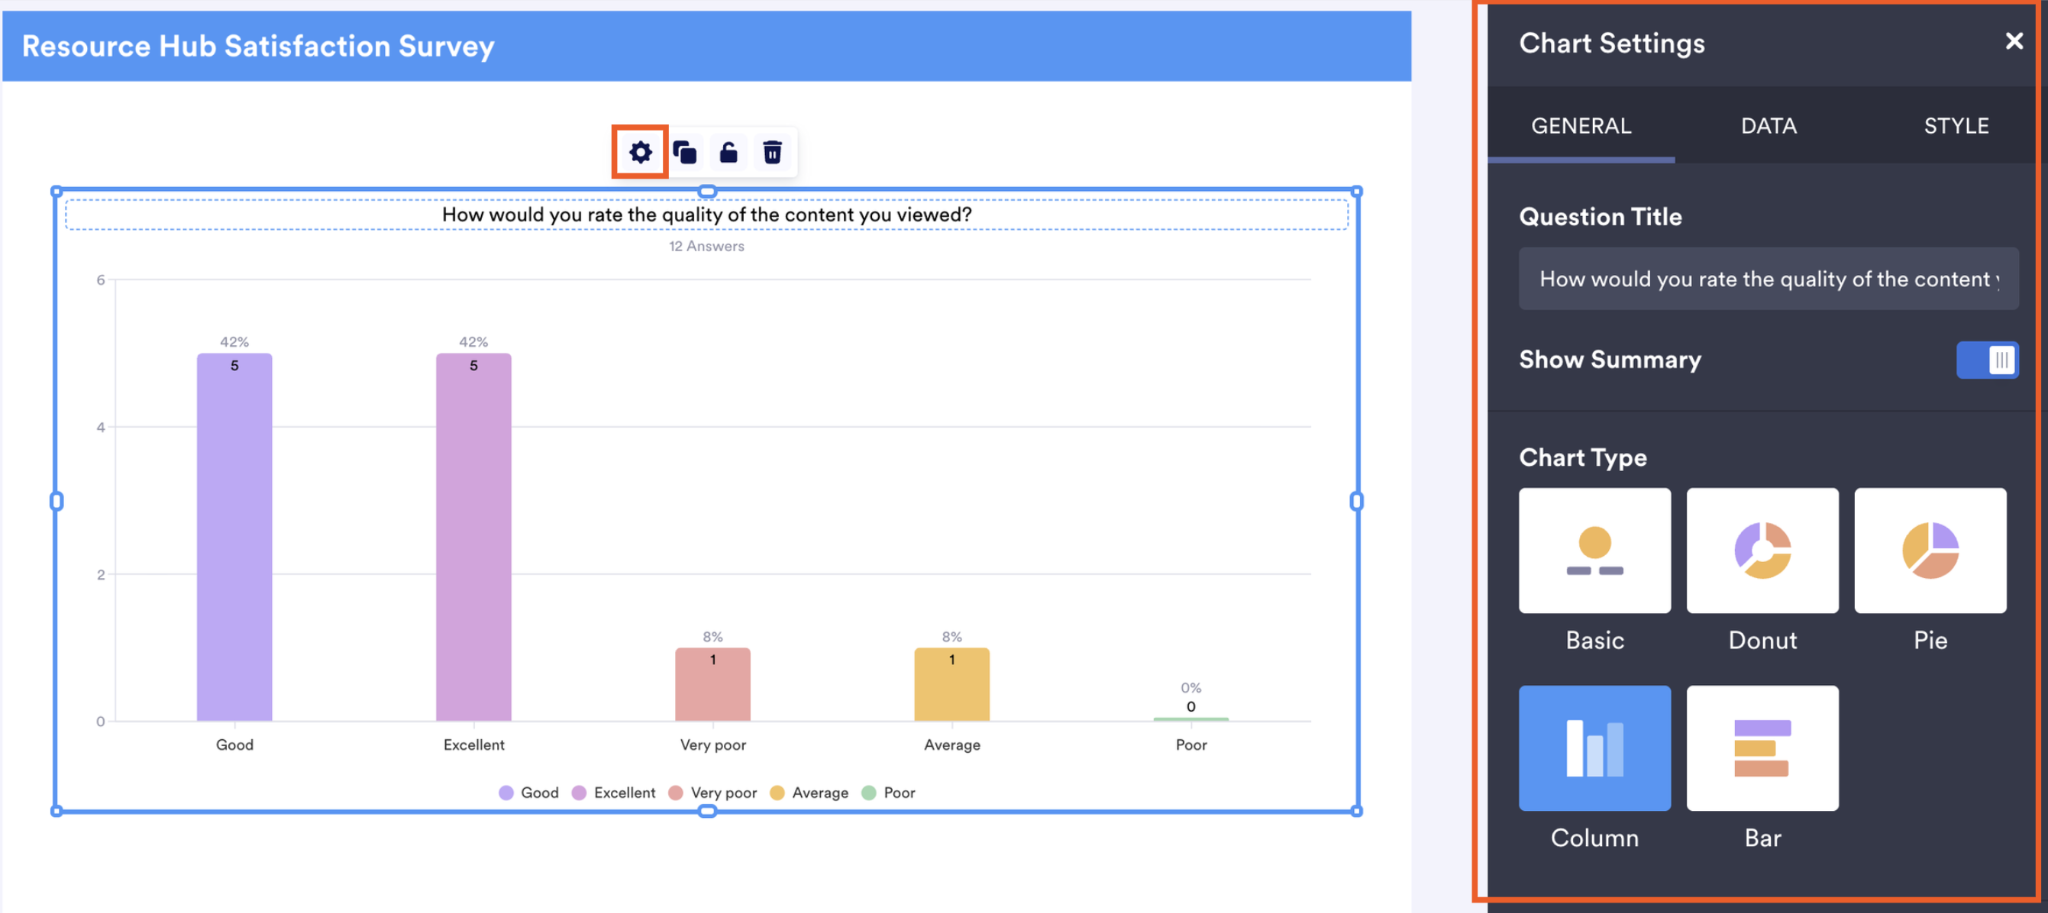
Last, if you want to change the visual type, click any Chart, then the Gear Icon. A settings panel will appear that lets you modify the chart type along with styles and how the data gets represented.
5. Ask Jotform AI Data Assistant questions about your survey results
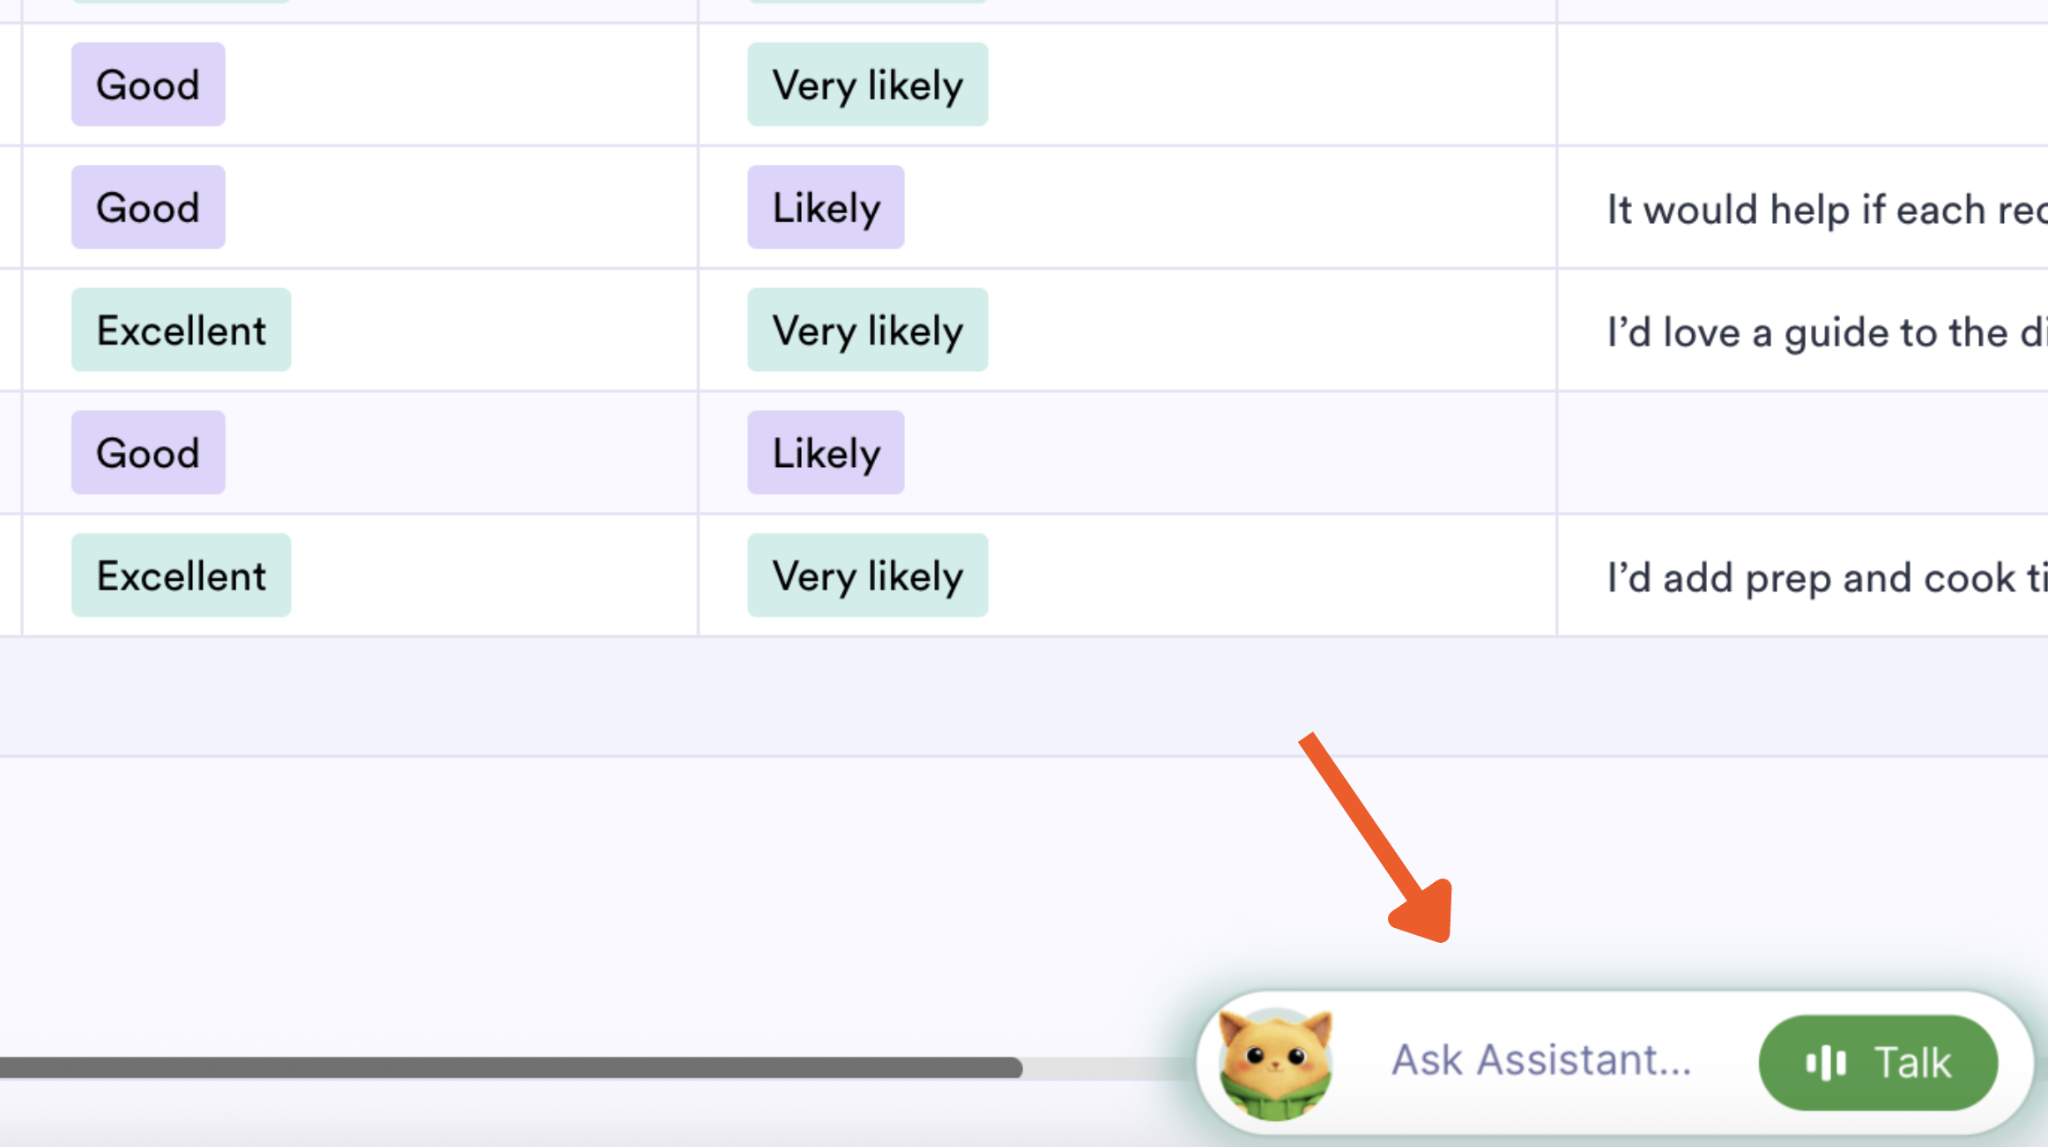
At any point in your analysis, you can return to Jotform Tables and ask plain-language questions of Jotform’s built-in AI tool, AI Data Assistant. (It’s always accessible at the bottom-right of the page next to Podo, Jotform’s feline mascot.)
For my resource hub, I asked it to pull themes from my open-ended question and help me with the coding process.
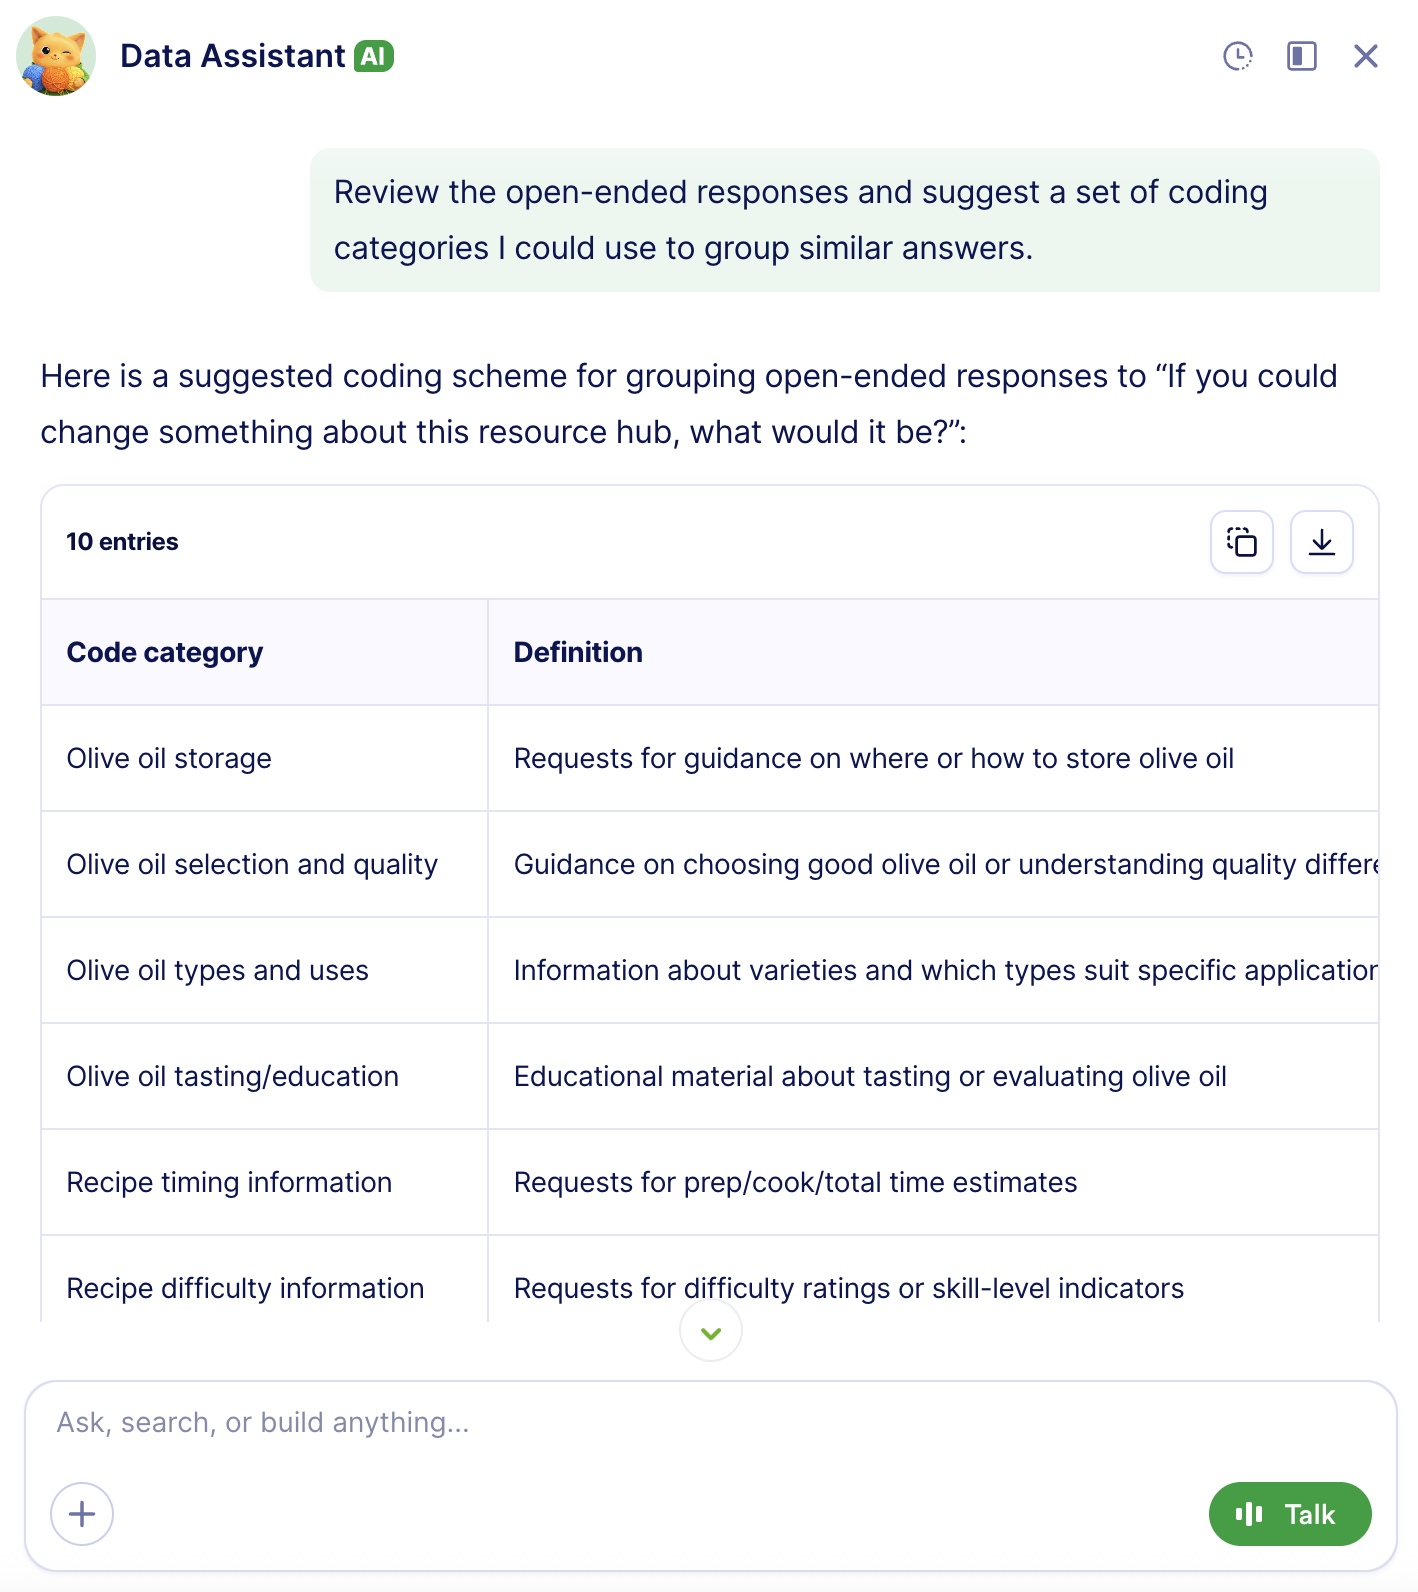
The AI Data Assistant features aren’t limited to analysis. They can build things for you or recommend next steps, too. Try asking it any of these questions (tailored to your dataset, of course):
- “Summarize the top complaints from customers who rated us 3 or lower.”
- “Which product feature was mentioned most often?”
- “Create a chart of satisfaction scores by month.”
- “Show responses from customers who mentioned pricing.”
- “What follow-up actions should I take based on the survey results?”
6. Follow up on survey insights
You’ve collected the data, looked at your results, shared your findings, and (potentially with help from the AI Data Assistant) outlined your next steps. Now you’ll want to assign a person to execute your action items.
You don’t need a third-party tool to do this. Jotform Tables and Jotform Workflows can handle it.
To track which submissions need attention, add a status column to your table. Click + Add to the right of your last column and choose Single Selection. Then click Next.
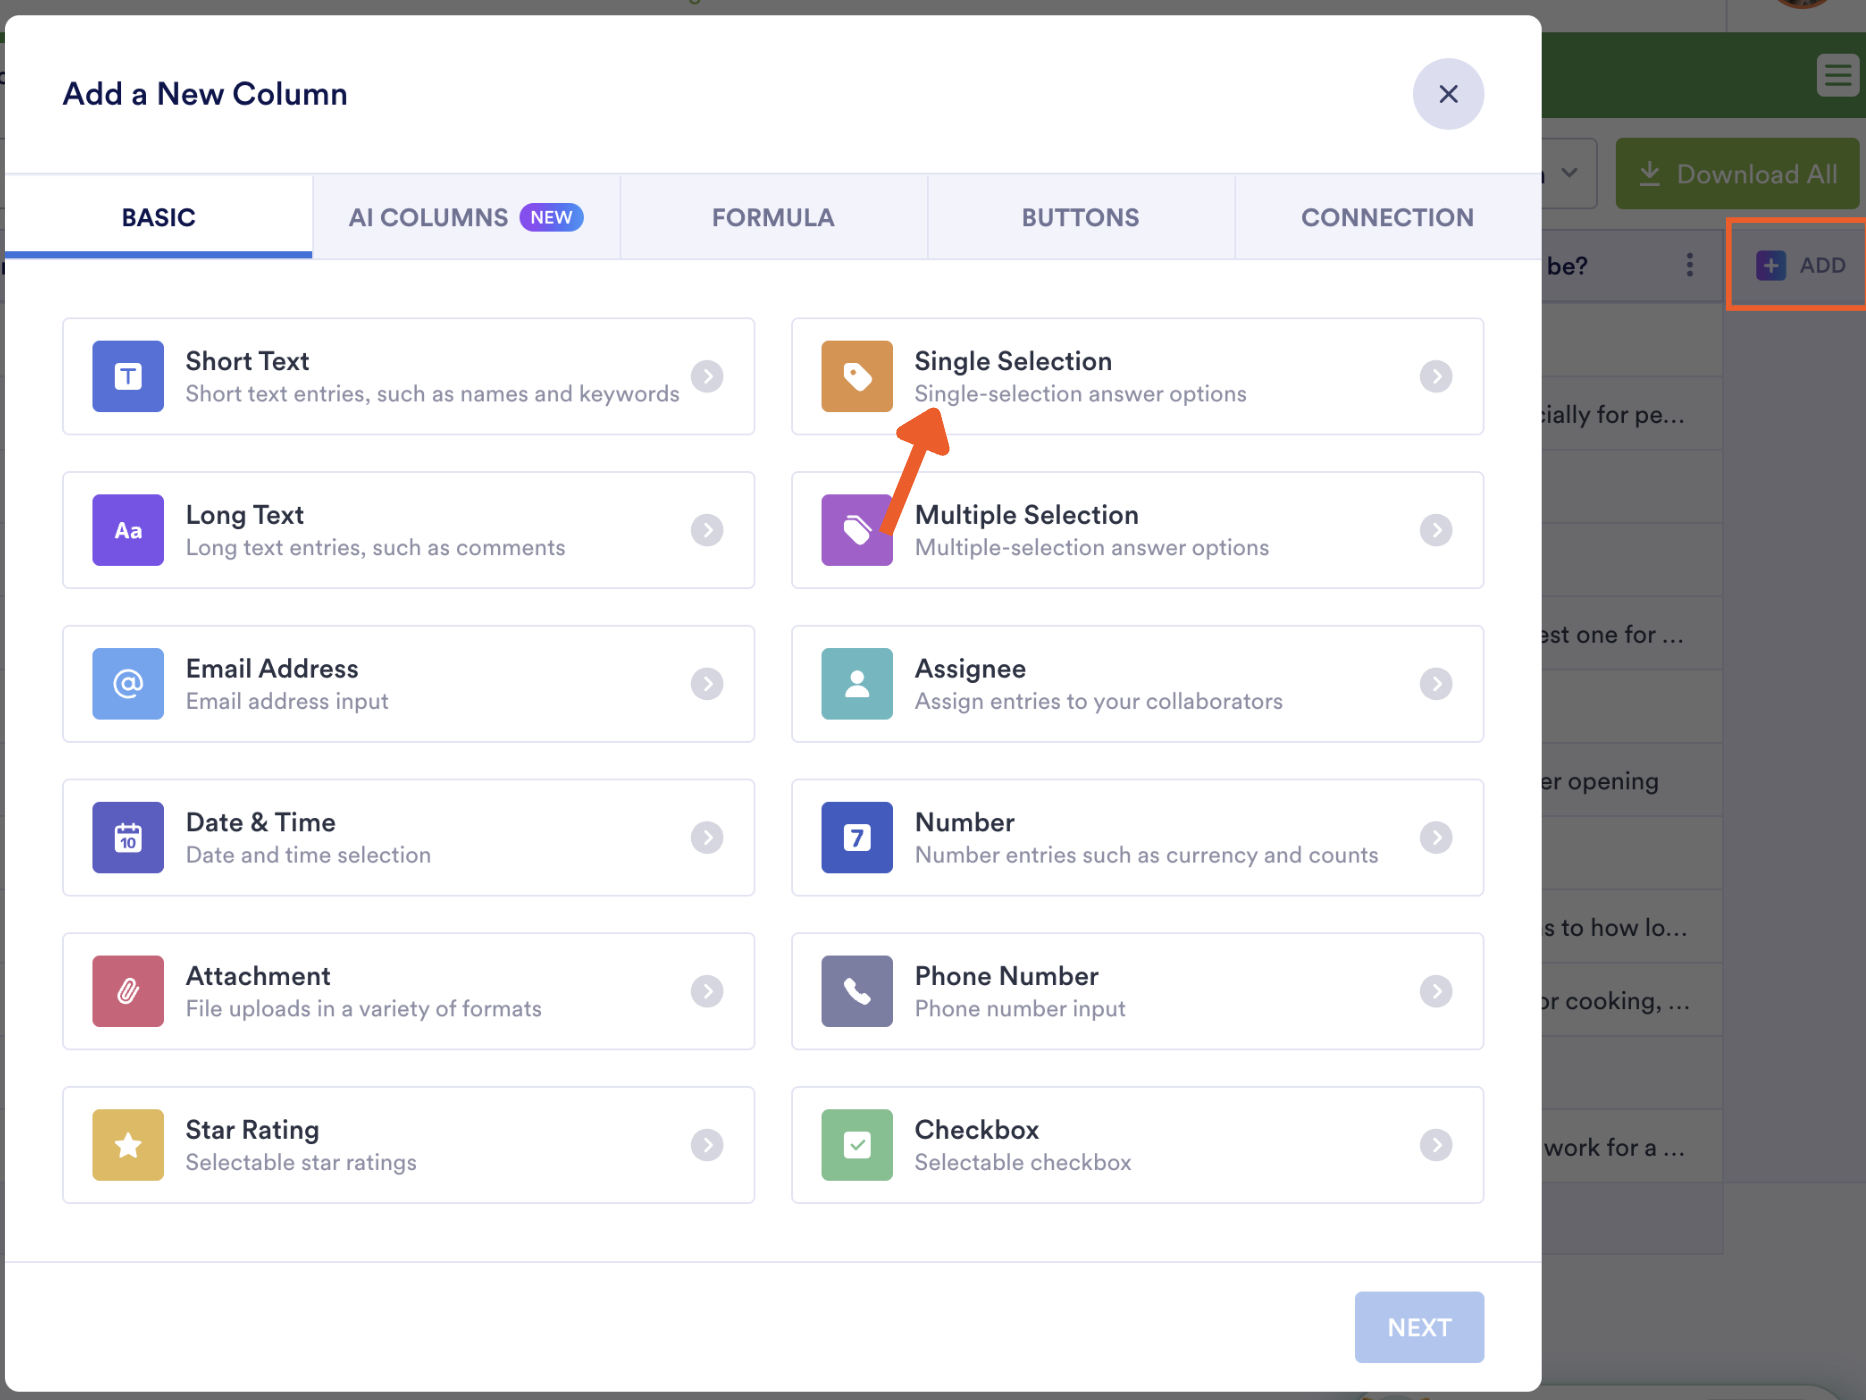
Name the column something like “Status” and add options such as “New,” “Needs Review,” “Contacted,” and “Resolved,” then click Create Column.
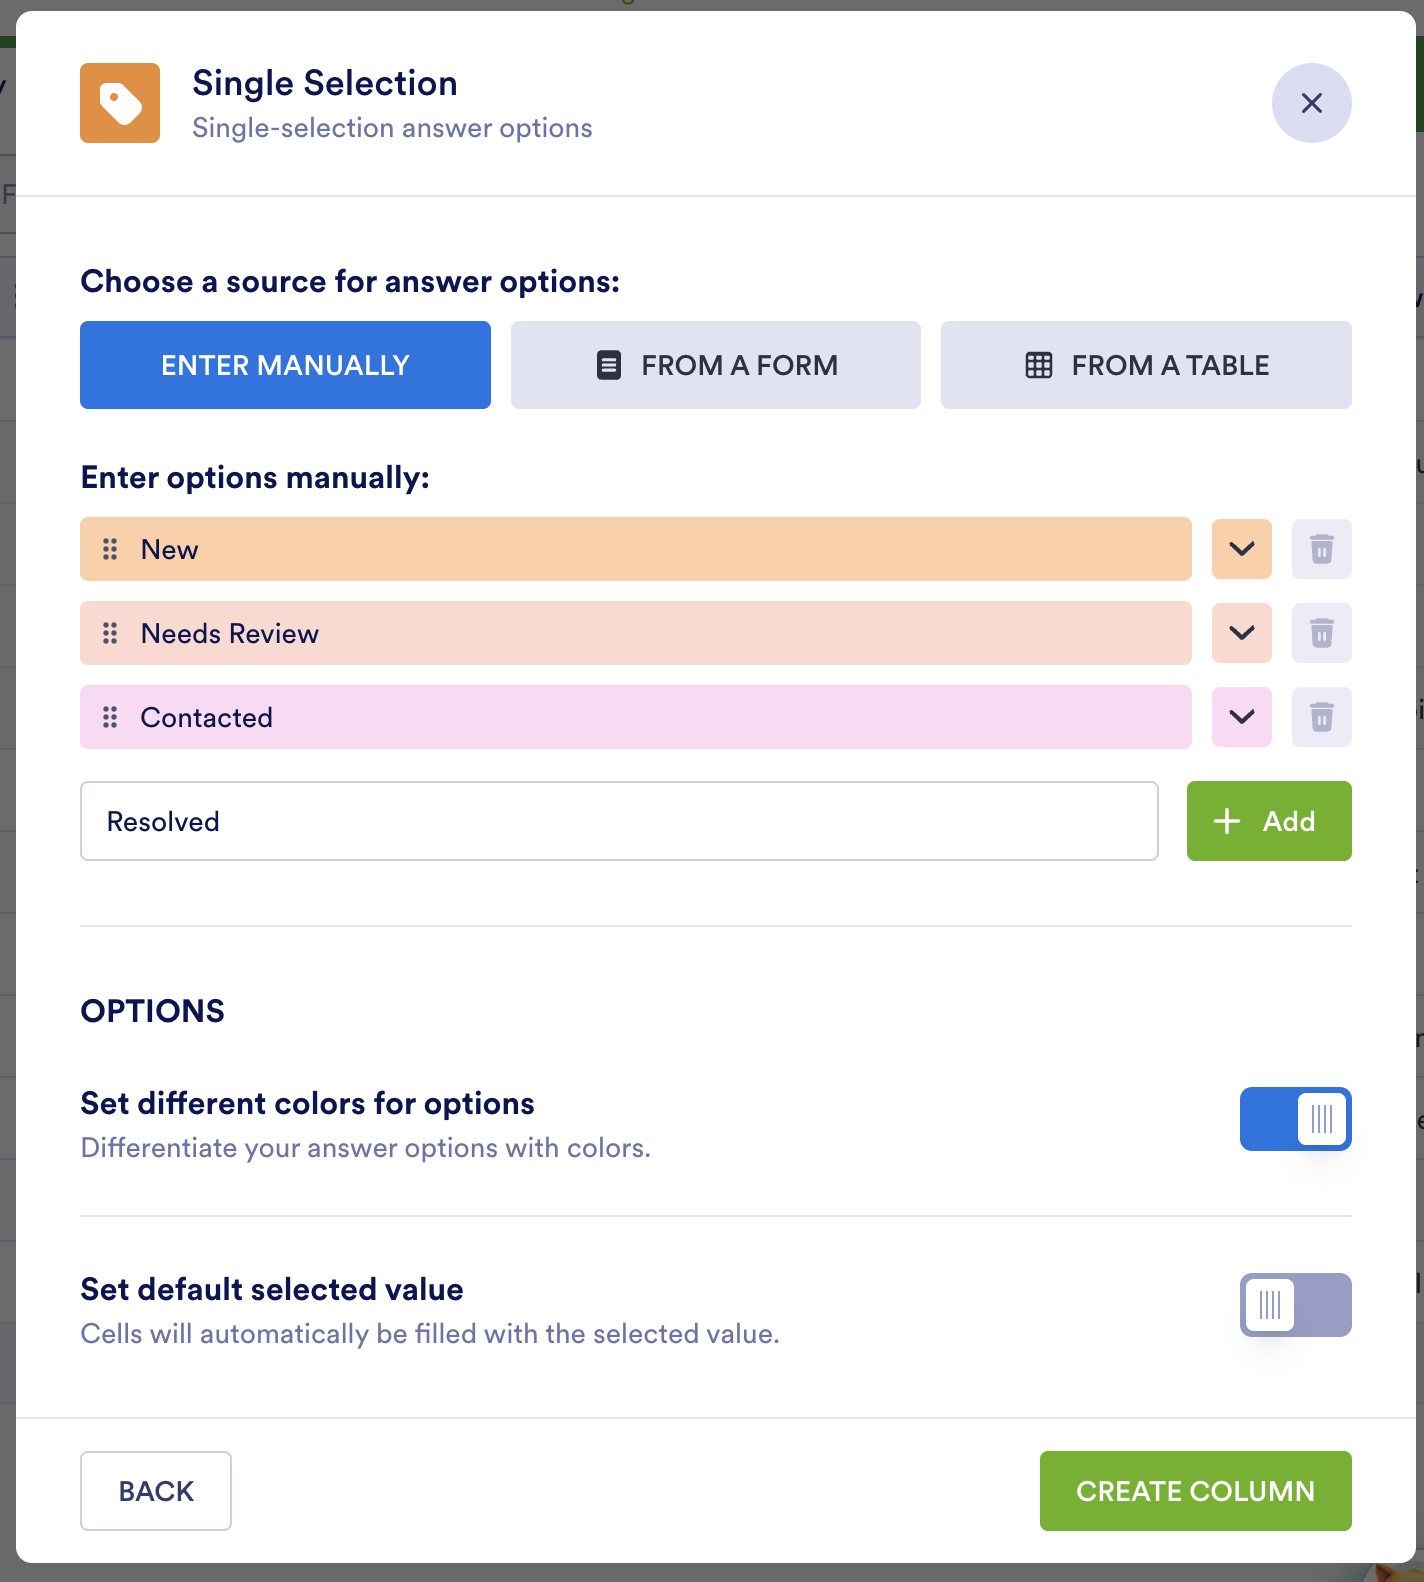
You and your collaborators can now label submissions as you work through them and filter the table to see everything still in “Needs Review.” If you want, for example, every poor rating routed to a manager automatically, you can build that automation in Jotform Workflows. (Find more on that in Jotform’s step-by-step guide to building workflows.)
You can even add an action button to your Jotform table with a tailored email template for notifying your teammates of required follow-up actions. (Jotform also has a guide to sending emails with form data.)
Jotform covers so much: It can build your survey, collect and organize responses, visualize the data, put AI to work on analysis, and route the follow-up to the right person. If you need heavier features, such as statistical modeling, inferential testing, or other complex intelligence work, you can export data to a dedicated stats or business intelligence tool.
How to present survey results clearly
After a long afternoon of analyzing survey responses, the last thing the writing center director and I wanted to do was more work. But assembling your findings into a clear report is worth the effort. A slapdash report will mean very little to someone who isn’t as close to the data as you are.
Here are some best practices to follow:
- Begin your report with a summary: In three to five sentences, explain why you ran the survey, highlight major findings, and state actionable next steps. This primes your stakeholders for everything that follows in the report.
- Orient them with key details: Next, give them the lay of the land. Explain how and when you conducted the survey, including your sample size and audience.
- Include supporting visuals: Use charts to represent patterns you noticed and tables to present details such as exact values. Just don’t overdo it. Too many visuals, especially if they aren’t adding value, can overwhelm a reader.
- Support and act on your findings: Back up every finding you present with evidence and pair it with a recommended action. No action to recommend? Then maybe that finding isn’t as revelatory as you thought; consider cutting it.
- Add open-ended quotes sparingly: Pull a quote when someone articulates a theme perfectly or when an outlier is worth flagging for future action. As with visuals, don’t pad your report with too many quotes.
- Make reports shareable: Make it easy for stakeholders to access your report by sending it in whatever format works best for them. The Jotform Report Builder lets you share by link, embed, or PDF.
FAQs about analyzing survey data
First, be clear about the purpose of your survey. Then check your response rate, toss incomplete or nonsensical submissions, and label each question by type, because different types call for different survey data analysis methods. From there, analyze your quantitative data followed by your open-ended answers. Segment and cross-tabulate, and then turn your findings into action items.
There isn’t one best way. It depends on your question types and the decision you’re trying to make after the analysis. A few best practices hold up across the board, though. Survey people whose opinions you care about. Don’t rely on averages alone to represent your data, because they hide outliers and mixed opinions. Segment your respondents into categories and compare how each group answered. And always end with action items.
Read all your responses first so you understand the range. Then do some survey coding. Write down the themes that surface in the answers, file every answer under a theme, and count how many answers landed in each theme. AI tools can speed this process up.
Package the data in a report that’s clear and easily shareable. Start with a brief summary. Explain how and when you conducted the survey, including details such as your sample size and audience. Use visuals and quotes from open-ended answers when they’re helpful. For every finding you present, back it up with evidence and pair it with a recommended action. And share the report by link, embed, or PDF, however your stakeholder prefers to receive it.
Yes. Jotform Tables organizes your responses into a table you can filter and segment for easy analysis. The Jotform AI Data Assistant answers questions about your data in plain English. The Jotform Report Builder turns numbers into visuals you can share with stakeholders. You can also connect the Jotform MCP to your AI tool to assist you with analysis right from your AI chat window.
This article is for marketers, customer experience teams, HR teams, educators, researchers, nonprofits, and small business owners who have collected survey responses and need a clear, practical way to turn raw answers into useful insights, reports, and follow-up actions.



































































































Send Comment: