Tips for an effective survey report
- Start with an introduction
- Use visualizations
- Focus on key facts first
- Categorize results
- Summarize your findings
- Integrate company branding
Conducting a survey is a great way to gather insights from your target demographic. But you’ll limit the effectiveness of the results if you don’t have the right strategy to analyze and report the information.
Once you’ve published and collected data from an online survey, it’s time to analyze the information and format it in a presentable way. Let’s dive into the ins and outs of how to write a survey report.
Survey report basics
You conduct research because you want to answer a question. Do your customers like your product? Why or why not? Did your customers get good service from the support team? If not, how could you improve? One way to find out is to conduct a survey.
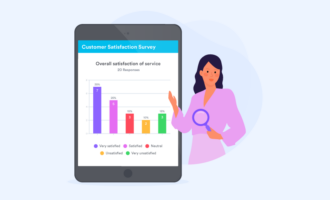
The survey report presents the results of the survey objectively, summarizing the responses. Most survey reports show the results in visually appealing ways by including graphs and charts.
It’s important to make the report easy to follow — for example, creating different sections for various survey question categories and using headings and subheadings to call out those categories. Your survey report should be interesting, but always focus on summarizing the information accurately.
Survey administration and data collection
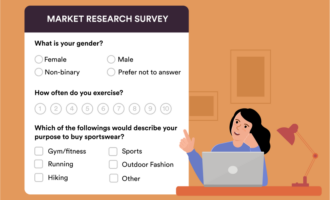
Before drafting a survey, consider what you want to achieve, then shape the questions to gather the kind of information that will help you reach those goals. You’ll likely want to include two types of questions:
- Quantitative. These are questions that yield a numerical response. Some of the most common quantitative questions ask respondents how satisfied they are with a product or service or how likely they would be to recommend a service to someone else. Respondents then have a scale of numbers to choose from. This numerical data can measure variables, and the results fit easily into graphs and charts.
- Qualitative. These questions gather more details from respondents about their experiences and opinions. As an example, if you were an online retailer, you might ask respondents to describe how you could improve their shopping experience.
Quantitative results are a little easier to present in a report because the numbers can quickly translate into easy-to-understand graphics. When you include qualitative questions, you’ll need to analyze and interpret the responses in text to share the results effectively with others.
Tips for an effective survey report
Here are a few best practices for creating a quality survey report:
- Start with an introduction. Set the tone by explaining the purpose of the survey. Provide context for the information you’re presenting.
- Use visualizations. Images and graphs are an effective way to tell a story. Keep it interesting with different visuals, such as pie charts, bar graphs, and other formats. But make sure to use the type of visual that best demonstrates the results.
- Focus on key facts first. What are the most critical data points you want to share? Include those at the beginning of the survey report.
- Categorize results. Group similar data together to show relationships. Consider using headings and subheadings to break up the information.
- Summarize your findings. At the end of the survey report, give the reader an overview of the information. Include takeaways that you can use to make improvements.
- Integrate company branding. Look for ways to infuse your brand in the survey report — at minimum, make sure you include your logo at the top of the document and a footer with your company’s information. And don’t forget to select presentation colors that align with your branding guidelines.
The aesthetics of your report matter. Even the smallest details can communicate volumes about your organization. So make sure the survey report is professional and concise while sharing accurate information.
Sharable survey reports
Now that you’ve created your survey report, how will you share it with others? Here are a few options to consider:
- Send a URL to a cloud-based report
- Embed the report on a website
- Download the report to distribute as a PDF
- Print a copy of the report for in-person meetings
You may also want to use multiple report-sharing features to accommodate the varying needs of your audience.
Built-in reporting features
If you don’t want to write a survey report from scratch, don’t worry! The simplest solution is to use a survey tool with built-in reporting features. You can pair a Jotform survey template with the Jotform Report Builder to visualize and present data in just a few clicks.
Jotform Report Builder makes it easy to convert collected survey data into beautiful visuals and charts. You can use auto-generated reports, but you also have the ability to customize the report layout to match the unique needs of your organization. You can share these survey reports in seconds, and they are updated automatically whenever new responses are submitted.
Student Survey Example Report
Additionally, the Report Builder allows you to filter the data in many ways, which is a huge help when it comes to analyzing the information you’ve collected. You can use these powerful insights to improve your business and meet the needs of your customers more effectively.





















Send Comment:
4 Comments:
28 days ago
साक्षरता पर सर्वे रिपोर्ट कैसे बनेगी
साक्षरता पर
More than a year ago
Choice of the question and answer
More than a year ago
Can you please provide a draft of a survey report?
More than a year ago
Can you please provide me demo of a survey